Equality and Health Inequalities Pack - OFFICIAL Gateway ref: 08541 - NHS England
←
→
Page content transcription
If your browser does not render page correctly, please read the page content below
Equality and Health Inequalities Pack
NHS Lewisham CCG
December 2018
Email for enquiries: england.eandhi@nhs.net

                                                      OFFICIAL
                                              Gateway ref: 08541

                                                         v 13:09:20
v 13:09:20

 Acknowledgements
       jjjjj
 We would like to thank Clinical Commissioning Groups (CCGs) for their help developing and testing these packs. In
 particular we would like to thank: Newham, Bromley, Somerset and Dorset for reviewing and discussing various
 versions of their packs with us.

 We would like to thank Professors Chris Bentley (Health Inequalities National Support Team Associate) and Richard
 Cookson of York University for their regular inputs during the development of these packs. In particular we would like to
 thank them for their time reviewing successive iterations, engaging with CCGs and making suggestions for both
 developing the analyses and for making them more accessible to CCGs.

 We would like to thank Public Health England (PHE) and Department of Health and Social Care (DHSC) analysts for
 discussing a sample pack and for making suggestions for improving the analyses within it.

 We would like to thank the many colleagues across NHS England for their help developing these packs, including the
 Equalities and Health Inequalities Unit, NHS England analysts, directors across business priorities and National
 Clinical Directors.

NHS Lewisham CCG                                                                                      NHS RightCare            2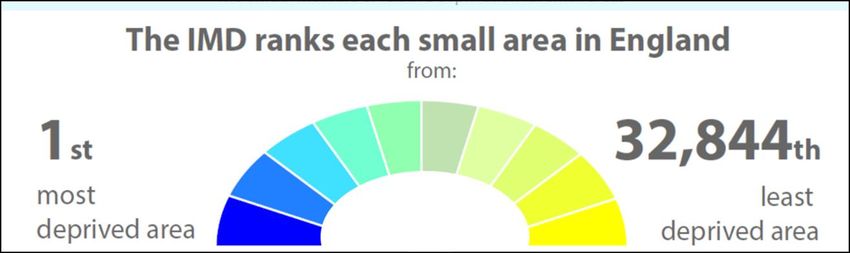
Contents
  •   Foreword                                                            4
  •   Executive Statistical Summary                                       5-6
  •   Executive Summary - Case Studies and Resources                      7
  •   Your Equality and Health Inequalities Pack                          8
  •   The National Big Picture                                            9
  •   Why Should Addressing Health Inequalities be a Priority for CCGs?   10
  •   What Contributes to the Development of Health Inequalities?         11
  •   Your most similar CCGs                                              12
  •   Measure of deprivation                                              13
  •   Your data                                                           14
  •   Inequalities in Unplanned Hospitalisations                          15-32
  •   Inequalities in Psychological Therapies                             33-43
  •   Resources for Addressing Health Inequalities                        44-53
  •   Useful Links                                                        54
  •   Action Planning                                                     55-57
  •   Annex of Detailed Tables                                            58-68

NHS Lewisham CCG                                                          NHS RightCare   3

Foreword
  We are committed to ensuring that all those using the NHS have fair and equitable access to high quality services
  that are appropriate and in proportion to their needs. In addition we have a specific focus on those with protected
  characteristics (by reason of age, membership of disadvantaged groups or living in disadvantaged areas).

  These NHS RightCare Equality and Health Inequality packs will help pinpoint areas of unwarranted variation and
  refocus resources on specific geographies, clinical areas and population groups. They will help the NHS to be
  fairer, as well as to improve quality and make best use of the tax payers’ pound.

  Matthew Swindells:                 Deputy Chief Executive
                                     National Director Operations and Information
                                     NHS England
  Professor Stephen Powis:           National Medical Director NHS England
  Professor Jane Cummings:           Chief Nursing Officer England and Regional Director London
                                     NHS England

NHS Lewisham CCG                                                                                     NHS RightCare      4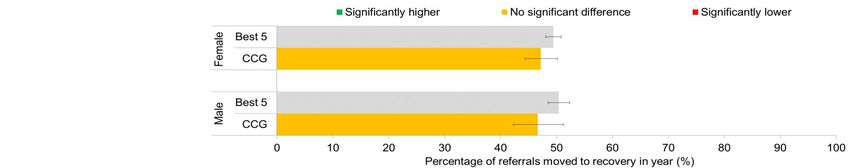
Executive Statistical Summary
 Unplanned Hospitalisations for Chronic Ambulatory Care Sensitive Conditions and
 Urgent Care Sensitive Conditions for 2016/17

 The Absolute Gradient of Inequality (AGI) - change over time
  ● Between 2015/16 and 2016/17, inequality decreased (but the change was not statistically significant)
  ● Between 2014/15 and 2016/17, inequality decreased*

• AGI - comparisons of CCG with Similar 10
  ● Your CCG has lower* inequality than 2 of your Similar 10

 ● Your CCG has similar inequality to 6 of your Similar 10 (3 lower, 3 higher, but the difference was not statistically significant)

 ● Your CCG has higher* inequality than 2 of your Similar 10

 Protected characteristic groups - CCG compared with best 5 of Similar 10
 ● Your CCG had significantly lower* unplanned hospitalisations for 1 of the 22 groups

 ● Your CCG had similar unplanned hospitalisations for 17 of the 22 groups
   (lower for 4, higher for 13 but the difference was not statistically significant)
  ● Your CCG had significantly higher* unplanned hospitalisations for 4 of the 22 groups

 Notes: *Statistically significant differences
 The number of groups (sex, age and ethnic) shown for a CCG will vary, as groups with insufficient data are not counted.

NHS Lewisham CCG                                                                                                           NHS RightCare   5
Executive Statistical Summary
 Improving Access to Psychological Therapies (IAPT) 2016/17 - CCG compared
 with best 5 of the Similar 10
 Quintiles of deprivation - rate of referrals finishing treatment
 ● Your CCG had higher* referrals for 0 of the 5 quintiles
  ● Your CCG had similar referrals for 5 of the 5 quintiles (higher for 3, lower for 2, but the difference was not statistically significant)
 ● Your CCG had lower* referrals for 0 of the 5 quintiles

 Quintiles of deprivation - percentage of referrals moving to recovery
 ● Your CCG had higher* recoveries for 0 of the 5 quintiles
 ● Your CCG had similar recoveries for 5 of the 5 quintiles (higher for 1, lower for 4, but the difference was not statistically significant)
 ● Your CCG had lower* recoveries for 0 of the 5 quintiles

 Protected characteristics - rate of referrals finishing treatment
 ● Your CCG had higher* referrals for 0 of the 11 groups
 ● Your CCG had similar referrals for 9 of the 11 groups (higher for 4, lower for 5, but the difference was not statistically significant)
 ● Your CCG had lower* referrals for 2 of the 11 groups

 Protected characteristics - percentage of referrals moving to recovery
 ● Your CCG had higher* recoveries for 0 of the 10 groups
 ● Your CCG had similar recoveries for 10 of the 10 groups (higher for 3, lower for 7, but the difference was not statistically significant)
 ● Your CCG had lower* recoveries for 0 of the 10 groups
Notes: *Statistically significant differences
The number of groups (sex, age and ethnic) shown for a CCG will vary, as groups with insufficient data are not counted. Similarly, the
number of England quintiles shown will vary, as quintiles with insufficient data are not counted.
NHS Lewisham CCG                                                                                                              NHS RightCare     6
Executive Summary - Case Studies and Resources
  This pack contains a range of case studies on interventions that can be used to help promote equality and reduce health inequalities. These are listed
  below under the area they relate to. More detail on the studies and explanation of how they might be used to support action planning is set out in the
  section Promoting Equality and Reducing Health Inequalities, from Data and Case Studies to Action Planning starting on page 44. This section also
  contains links to resources including NHS RightCare products, NHS Health Check Data, the UCL's Institute of Health Equity's website, York
  University's Centre for Health Economics' website and Public Health England's Health Profile for England.

                 New Care Models
                 Community Outpatient Services (Sandwell and West Birmingham CCG)
                 Healthy Lives (Sandwell and West Birmingham CCG)
                 Digital
                 Doc Abode - workforce software to improve Urgent and Primary Care Access, Resilience & Scale
                 Emergency Care
                 Self Management (Flo Telehealth)
                 Social Prescribing (Rotherham CCG)
                 Falls Specialist Response Car (Queen’s Hospital North East London)
                 GP Led Triage and Redirection (Care UK and St Georges Hospital)
                 Rapid Access Doctor (Sutton CCG)
                 Dedicated Community Nurse (Kingston CCG)
                 Non-clinical Navigators (City and Hackney CCG)
                 Rapid Response Service (Camden)
                 Primary Care
                 Disruptive Prevention (West Wakefield)
                 Improving Working Practices (Tower Hamlets)
                 Tool for Reducing Inequalities in Access to GP Services
                 Cancer
                 Prostate Cancer Diagnosis (UCLH Cancer Collaborative)
                 Catching More Cancers Early (Manchester)
                 Access to Cancer Screening (Kingston)
                 Learning Disability Network Cancer Screening (North East and Cumbria)
                 Psychological Therapies
                 Health and Justice – Liaison and Diversion services
                 Street Triage Scheme (Nottinghamshire Healthcare NHS Foundation Trust)
                 Cognitive Behavioural Therapy (CBT) in GP Surgeries (Islington)
                 Improving Access to Psychological Therapies (IAPT) for Older People (Yorkshire)
                 Community Perinatal Team (CPT) (Hertfordshire)
                 Hear Our Voice (Cornwall) - Self-care for Young People
                 Mother and Baby Unit (MBU) (South West)
                 Motiv8 (Havant) - Improving Confidence in Young People

NHS Lewisham CCG                                                                                                             NHS RightCare                 7
Your Equality and Health Inequalities
  Pack
  This pack contains data on a number of healthcare areas in your CCG to demonstrate where there are potential
  opportunities for addressing equality and tackling health inequalities. The information contained in this pack is
  specific to your CCG and should be used to support local discussions and inform a more in-depth analysis.
  Additionally, there is information on different interventions that may address these areas. CCGs should consider
  which interventions could be appropriate for their demographic and engage with other CCGs to seek out examples
  of successful implementation.

  By using this information, together with other packs and local intelligence such as the joint strategic needs
  assessment, long-term conditions and focus packs, your local health economy will be able to ensure its plans
  focus on those opportunities which have the potential to provide the biggest improvements in health outcomes and
  resource allocations and the biggest reductions in health inequalities.

  NHS England, Public Health England and CCGs have legal duties under the Equality Act 2010 with regard to
  eliminating discrimination, harassment and victimisation, to advance equality of opportunity, and to foster good
  relations between people who share a relevant protected characteristic and those who do not share it. There are
  also legal duties under the Health and Social Care Act 2012 with regard to reducing health inequalities between
  patients in access to, and outcomes from healthcare services, and to ensure services are provided in an integrated
  way where this might reduce health inequalities. Commissioners should continue to use these packs and
  supporting tools to drive local action to reduce inequalities in access to services and in the health outcomes
  achieved.

NHS Lewisham CCG                                                                                    NHS RightCare      8

The National Big Picture
    Socioeconomic Status                                                                                          The under 75 mortality rate
                                                                                                                                                                          People with learning
                                                                                                                                                                       disabilities are 4 times as
    People living in deprived areas on average have poorer health                                                from Cardiovascular Disease                          likely to die of preventable
    and shorter lives. Research shows that socioeconomic                                                          (CVD) is almost five times                                      causes5
    inequalities result in increased morbidity and decreased life                                                 higher in the most deprived
                                                                                                                     compared to the least
    expectancy. The UCL Institute of Health Equity estimates 1.3                                                       deprived areas1                                South Asians are up to 6
    to 2.5 million potential years of life lost annually due to
                                                                                                                                                                    times more likely to develop
    inequalities.10                                                                                                                                                       type 2 diabetes6

                                                                                                                African-Caribbean and Asian
                                                                                                                   females over 65 have a
                                                                                                               higher risk of cervical cancer2                          Suicide is currently the
    Protected Characteristics                                                                                                                                        biggest killer of men under
    These are individuals’ characteristics protected by the Equality                                                                                                         35 in the UK7
    Act of 2010. Understanding these different characteristics can                                              Lesbian and bisexual women
    improve patient care in terms of health outcomes, access and                                                 are twice as likely to have
    experiences. There are 9 protected characteristics:                                                                    never
                                                                                                                 had a cervical smear test,                         It is becoming more common
                                                                                                                  compared with women in                             for children to develop type 2
                                                                                                                          general3                                              diabetes8
    •     Age                                           •      Pregnancy and maternity
    •     Disability                                    •      Race
    •     Gender reassignment                           •      Religion or belief                               Older people report receiving
                                                                                                                                                                     Muslim people report worse
                                                                                                                 poorer levels of care than
                                                                                                                                                                    health on average compared
    •     Marriage and civil                            •      Sex                                              younger people with the same
                                                                                                                                                                      to other religious groups9
          partnership                                                                                                    conditions4
                                                        •      Sexual orientation

Sources
1. NHS Outcomes Framework inequality indicators, NHS Digital (2016). 2. Forman, D. "Cancer incidence and survival by major ethnic group, England, 2002–2006". National Cancer Intelligence
Network (2009). 3. Kerker, Bonnie D., Farzad Mostashari, and Lorna Thorpe. "Health care access and utilization among women who have sex with women: sexual behavior and identity". Journal of Urban
Health 83.5 (2006): 970-979. 4. Melzer, David, et al. "Health Care Quality for an Active Later Life". Peninsula College of Medicine and Dentistry, University of Exeter (2012). 5. Rees S, Cullen C, Kavanagh S,
Lelliott P. Chapter 17 Learning Disabilities. In: Stevens A, Raftery J, Mant J, Simpson S. (eds.) Health Care Needs Assessment. First Series. Second. Oxford: Radcliffe Publishing Ltd; 2004. pp451–540.
6. Khunti, Kamlesh. Diabetes UK and South Asian Health Foundation recommendations on diabetes research priorities for British South Asians. Diss. University of Warwick, 2009.
7. https://www.ons.gov.uk/peoplepopulationandcommunity/birthsdeathsandmarriages/deaths/bulletins/suicidesintheunitedkingdom/2015registrations ONS, 2015.
8. Haines, Linda, et al. "Rising incidence of type 2 diabetes in children in the UK". Diabetes care 30.5 (2007): 1097-1101. 9. 2011 Census data.
10. Marmot, M. "Fair society, healthy lives : the Marmot Review : strategic review of health inequalities in England post-2010" (2010).

NHS Lewisham CCG                                                                                                                                                                  NHS RightCare                    9
Why Should Addressing Health
  Inequalities be a Priority for CCGs?
  The NHS is dedicated to delivering better care for individuals, lowering per-capita cost and
  improving population health. Health inequalities are an important component of population health
  and one that should be a central priority for CCGs.

  •   It is a moral imperative concerning social justice. The issue should be of great importance to
      a caring and compassionate service.

  •   It is a legal requirement. The Health and Social Care Act (2012) placed responsibilities on
      CCGs (amongst others) to "demonstrably take account of inequalities in access to and
      outcomes of healthcare".

  •   It makes good business sense. The burden of ill health and disability, as well as premature
      mortality, is disproportionately focussed on the most deprived populations. These sections of
      society are least equipped and resourced to make best and most appropriate use of services. If
      the ‘unmet need’ for preventive services and those for early detection and management is not
      addressed in those at greatest risk, a large part of the growing burden and cost will persist.

NHS Lewisham CCG                                                                        NHS RightCare   10
What Contributes to the Development of
Health Inequalities? Figure 1: Pattern of risks affecting health and wellbeing
Figure 1 shows how social determinants of inequality (‘Risk
conditions’ and ‘Psycho-social risks’), resultant ‘Behavioural
risks’ and the subsequent ‘Physiological risks’ are all linked. Health and Physiological risks:
Strategies to impact on health inequalities as a whole need to well-being High blood pressure
include interventions addressing all levels. High cholesterol
High blood sugar
The CCG will have important partnership roles within the Health Chronic increase in stress
and Wellbeing Board and other place-based units of planning hormones
e.g. Integrated Care Systems and their contribution as Anxiety/depression
commissioner or provider will differ across the three levels.
How can CCGs identify priorities and Behavioural
risks:
opportunities for improvement? Smoking
Poor diet
Working as a statutory partner in the Health and Wellbeing Lack of activity
Board, the CCG will play their part, where possible, in
addressing social determinants (Risk conditions and Psycho- Risk conditions:
social risks) through the Health and Wellbeing Strategy. These Poverty
will include issues such as education and skills, joblessness, Low social status
Poor educational attainment Psycho-social risks:
income and debt and housing. Isolation
Unemployment
Vulnerable housing Lack of social support
To an extent, however, the NHSRightCare materials cluster Poor social networks
CCGs with similar social determinants together, and then Dangerous environments
Discrimination Low self-esteem
explore how effective similarly placed systems are being at High self-blame
addressing Behavioural risks and Physiological risks. Steep power hierarchy
Gaps/weaknesses in Low perceived power
services and support Loss of
meaning/purpose of life
NHS Lewisham CCG NHS RightCare 11Your Most Similar CCGs
Your CCG is compared to the 10 most demographically similar CCGs. This is used to identify
realistic opportunities to improve health and healthcare for your population. The analysis in this
pack is based on a comparison with your most similar CCGs which are:
● NHS Southwark CCG ● NHS Waltham Forest CCG
● NHS Haringey CCG ● NHS Lambeth CCG
● NHS City and Hackney CCG ● NHS Enfield CCG
● NHS Greenwich CCG ● NHS Barking and Dagenham CCG
● NHS Croydon CCG ● NHS Newham CCG
To help you understand more about how your most Similar 10 CCGs are calculated, the Similar 10
Explorer Tool on the NHS England website is available here:
https://www.england.nhs.uk/publication/similar-10-ccg-explorer-tool/
This tool allows you to view similarity across all the individual demographics used to calculate your
10 most similar CCGs. You can also customise your Similar 10 group by weighting towards a
desired demographic factor.
NHS Lewisham CCG NHS RightCare 12Measure of Deprivation
Ministry of Housing, Communities and Local Government's Index of Multiple Deprivation (IMD) for 2015
The IMD ranks each small area in England
IMD 2015 covers 7 domains of deprivation: income, employment, education, health, crime, barriers to
housing and services and living environment and can be used for the following:
• Comparing small areas across England
• Identifying the most deprived small areas
• Exploring the domains (or types) of deprivation
• Comparing larger areas e.g. local authorities
• Looking at changes in relative deprivation between versions (i.e. changes in ranks)
IMD 2015 is used to construct key deprivation based inequality measures within these packs.
See the link below for more on IMD 2015
https://www.gov.uk/government/statistics/english-indices-of-deprivation-2015
NHS Lewisham CCG NHS RightCare 13Your Data This pack presents a variety of indicators. For each indicator, inequality within your CCG is measured, and then compared to your Similar 10 CCGs. Indicators for England are often included. This analysis is beneficial for showing current progress for CCGs, and forms one stage of a process. The aim is to shine a spotlight on variations in practice within and between CCGs, to help identify and share best practice in addressing equality and tackling health inequalities. The indicators make the best use of available data. However, data and analysis have limitations. The 2 areas covered are: CCG Improvement and Assessment Framework (IAF) Health Inequalities Indicators These are from the CCG IAF, based on methods developed by Richard Cookson, Miqdad Asaria and Shehzad Ali from the University of York, in a project funded by the National Institute for Health Research*. These are secondary care indicators that reflect on how well CCGs do overall in addressing inequalities in healthcare access and outcome between the most and least deprived members of the population. CCG Indicators for Protected Characteristics for Increasing Access to Psychological Therapies (IAPT) Equity indicators by socioeconomic status, sex, age and ethnicity groups have been constructed for IAPT services using rates of referral finishing a course of treatment (an access measure) and rates of movement to recovery for referrals finishing a course of treatment (an outcome measure). Source * Health Equity Indicators for the English NHS: a longitudinal whole-population study at the small-area level. Cookson et. al. HEALTH SERVICES AND DELIVERY RESEARCH 2016 VOL. 4 NO. 26. currently available at https://www.journalslibrary.nihr.ac.uk/hsdr/hsdr04260#/abstract NHS Lewisham CCG NHS RightCare 14
Inequalities in Unplanned Hospitalisations
This section relates to the CCG Improvement and Assessment Framework (IAF) Health
Inequalities Indicator 106a: Inequality in Unplanned Hospitalisations for Chronic
Ambulatory Care Sensitive and Urgent Care Sensitive Conditions for 2016/17
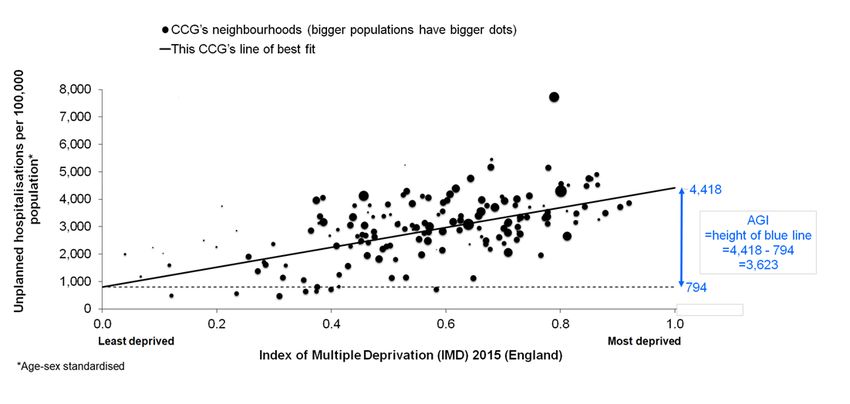
NHS Lewisham CCG NHS RightCare 15The Absolute Gradient of Inequality (AGI) for Unplanned Hospitalisations for Chronic Ambulatory Care
Sensitive Conditions and Urgent Care Sensitive Conditions for 2016/17
Explaining the AGI with an unspecified CCG
We will be using the Absolute Gradient of Inequality (AGI) as a measure of health inequalities within each CCG. Here,
and in the next slide, we explain this measure.
5. The line is the general trend.
Lower deprivation
neighbourhoods tend to have
lower rates of unplanned
hospitalisations, and higher
deprivation neighbourhoods have
4. This neighbourhood has high higher rates.
3. This neighbourhood has
low deprivation and low deprivation and high rates of
rates of unplanned unplanned hospitalisations.
hospitalisations.
6. This height is the Absolute Gradient of
Inequality (AGI). This height and the
gradient of the line both measure the AGI,
2. Each neighbourhood 1. The Index of Multiple Deprivation (IMD) is used to rank because the steeper the gradient, the greater
has a rate of unplanned neighbourhoods from least deprived to most deprived. the height. The greater the inequality, the
hospitalisations. greater the gradient/height, and so the
greater the AGI.
NHS Lewisham CCG NHS RightCare 16The Absolute Gradient of Inequality (AGI) for Unplanned Hospitalisations for Chronic Ambulatory Care Sensitive Conditions and Urgent Care Sensitive Conditions for 2016/17 Explaining the AGI with unspecified CCGs The charts below show how health inequalities, and therefore the AGI, can vary from CCG to CCG. The steeper the gradient of the line of best fit, the greater the height of the blue line, the greater the AGI and so the greater the inequality. NHS Lewisham CCG NHS RightCare 17
Unplanned Hospitalisations for Chronic Ambulatory Care Sensitive Conditions and Urgent Care Sensitive Conditions for 2016/17

The Absolute Gradient of Inequality (AGI) for your CCG
The chart below shows the AGI for your CCG. The steeper the gradient of the line of best fit, the greater the height of the blue line, the greater the AGI and so the
greater the inequality. The chart shows neighbourhoods, which are also known as Lower Super Output Areas (LSOAs).

                                                                                                                                                           Total

Sources: Unplanned hospitalisations: 2016-17 Secondary User Service (SUS), NHS Digital. Population data: CCG registered population for Oc tober 2016, NHS Digital.
Note: Numbers less than 6 have been suppressed when plotting neighbourhoods but have been included in overall calculations.

NHS Lewisham CCG                                                                                                                                                     NHS RightCare   18
Unplanned Hospitalisations for Chronic Ambulatory Care Sensitive Conditions and Urgent Care Sensitive Conditions 2016/17
Inequality in your CCG compared with your Similar 10 and other CCGs in England
Each ranked bar on the chart represents the level of inequality in a CCG*. The red bar is your CCG and the yellow bars are the Similar 10 CCGs. These
CCGs are also shown in the table below alongside their Absolute Gradient of Inequality (AGI) value, ranked from lowest (1) to highest (11) inequality.
The CCGs in the highest quintile have the highest levels of inequality. The heatmap shows the geographical variation in levels of inequality across the
country. The darkness of shades shows the CCGs' inequality with the darkest quintile having the highest inequality.
NHS Lewisham CCG
Similar 10 CCGs
Highest quintile of inequality
Lowest quintile of inequality
London
Rank CCG Name AGI
1 NHS City and Hackney CCG -587
2 NHS Newham CCG 550
3 NHS Haringey CCG 1,321
4 NHS Enfield CCG 1,322
5 NHS Waltham Forest CCG 1,336
6 NHS Lewisham CCG 1,491
7 NHS Greenwich CCG 1,510
8 NHS Lambeth CCG 1,539
9 NHS Barking and Dagenham CCG 1,830
10 NHS Croydon CCG 2,334
11 NHS Southwark CCG 2,425
Sources: Unplanned hospitalisations: SUS 2016/17, NHS Digital, population data - CCG registered population, October 2016, NHS Digital
Notes: * Difference in age sex standardised rates of unplanned hospitalisation per 100,000 population between the most and least deprived neighbourhoods in England if England had the same inequality as the CCG. See NHS
England CCG Improvement and Assessment Framework Technical Annex for more details.
NHS England CCG Improvement and Assessment Framework Technical Annex
NHS Lewisham CCG NHS RightCare 19Unplanned Hospitalisations for Chronic Ambulatory Care Sensitive Conditions and Urgent Care Sensitive Conditions 2016/17 Inequality in your CCG compared with your Similar 10 The current levels of inequality for your CCG and its Similar 10 CCGs are shown by the bars on the ranked chart. The 95% confidence interval error bars illustrate the uncertainty in the measure of inequality. Horizontal lines represent the mean of the Similar 10 as well as England. CCGs that are below the Similar 10 Mean have less inequality than its Similar 10 CCGs. Sources: Unplanned hospitalisations - Secondary User Service (SUS) 2016/17, NHS Digital, population data - CCG registered population, October 2016, NHS Digital. NHS Lewisham CCG NHS RightCare 20
Unplanned Hospitalisations for Chronic Ambulatory Care Sensitive Conditions and Urgent Care Sensitive Conditions
Time Series for your CCG's Inequality compared with your Similar 10 and England
The current and previous levels of inequality for your CCG are shown by the solid line on the line chart. The 95% confidence interval
error bars illustrate the uncertainty in the measure of inequality. The England average, and the average of the Similar 10 are also shown
as benchmarks.

Sources: Unplanned hospitalisations - Secondary User Service (SUS) 2016/17, 2015/16, and 2014/15 (where available), NHS Digital, population data - CCG registered population, October 2016, NHS Digital.
Note: * Difference in age sex standardised rates of unplanned hospitalisation per 100,000 population between the most and least deprived neighbourhoods in England if England had the same inequality as the CCG.

NHS Lewisham CCG                                                                                                                                                          NHS RightCare                 21
Unplanned Hospitalisations for Chronic Ambulatory Care Sensitive Conditions and Urgent Care Sensitive Conditions for 2016/17

Determining Priority Wards for Inequality for your CCG
This slide shows wards rather than neighbourhoods, because wards may be more familiar to CCGs and are around 4 times as large which helps to
address statistical uncertainty. The dots on the chart represent the wards in your CCG. Dot sizes vary depending on the ward population. The red
line shows the line of best fit for your CCG. The slope of the line shows the Absolute Gradient of Inequality (AGI). The steeper the line, the greater
the level of inequality. The red priority wards are those in the most deprived half of your CCG (based upon the Index of Multiple Deprivation), that
are above the red line. Priority wards are important because they are the wards associated with inequality .

Sources: Unplanned hospitalisations: 2016-17 Secondary User Service (SUS), NHS Digital. Population data: CCG registered population for October 2016, NHS Digital.
Note: Numbers less than 6 have been suppressed when plotting wards but have been included in determining the line of best fit.

NHS Lewisham CCG                                                                                                                                                    NHS RightCare   22
Unplanned Hospitalisations for Chronic Ambulatory Care Sensitive Conditions and Urgent Care Sensitive Conditions for 2016/17

Priority Wards for Inequality for your CCG
Up to 20 priority wards, with at least 50 hospitalisations, for your CCG are listed below. The final column shows the opportunity for saved hospitalisations if your
CCG had no inequality. This is the number of hospitalisations that would be saved if expected rates for priority wards moved to the expected rate at median
deprivation*.

                                                                                                                          Unplanned                                       Opportunity for saved
                                                                                                                     hospitalisations                   Unplanned        hospitalisations, if your
        Rank      2015 ward                                                                 Population       per 100,000 population**               hospitalisations      CCG had no inequality
           1      New Cross                                                                    19,777                           1,802                            241                            24
           2      Rushey Green                                                                 16,167                           1,816                            232                            17
           3      Bellingham                                                                   16,904                           1,745                            231                            19
           4      Downham                                                                      14,102                           1,891                            221                            23
           5      Whitefoot                                                                    15,703                           1,636                            210                            11
           6      Evelyn                                                                       16,910                           1,724                            188                            13
           7      .                                                                                   .                             .                              .                             .
           8      .                                                                                   .                             .                              .                             .
           9      .                                                                                   .                             .                              .                             .
          10      .                                                                                   .                             .                              .                             .
          11      .                                                                                   .                             .                              .                             .
          12      .                                                                                   .                             .                              .                             .
          13      .                                                                                   .                             .                              .                             .
          14      .                                                                                   .                             .                              .                             .
          15      .                                                                                   .                             .                              .                             .
          16      .                                                                                   .                             .                              .                             .
          17      .                                                                                   .                             .                              .                             .
          18      .                                                                                   .                             .                              .                             .
          19      .                                                                                   .                             .                              .                             .
          20      .                                                                                   .                             .                              .                             .
                  .                                                                                   .                             .                              .                             .
                  Total                                                                           99,563                                                         1,323                        108

Sources: Unplanned hospitalisations: 2016-17 Secondary User Service (SUS), NHS Digital. Population data: CCG registered population for Oc tober 2016, NHS Digital.

Notes:
Figures are taken from the Total (where 1 to 5 replaced with 3) column of the Top 10 conditions for priority wards table.
Numbers less than 6 have been suppressed.
*See Methodology Guide for further details
**Age-sex standardised

NHS Lewisham CCG                                                                                                                                     NHS RightCare                             23
Unplanned Hospitalisations for Chronic Ambulatory Care Sensitive Conditions and Urgent Care Sensitive Conditions for 2016/17 Priority Wards for Inequality and Uncertainty for your CCG The chart below shows up to 20 priority wards, with at least 50 hospitalisations, for your CCG. The blue bars (with 95% confidence intervals to show uncertainty) show the number of unplanned hospitalisations. The yellow bars show the opportunity for saved hospitalisations, if your CCG had no inequality. This is the number of hospitalisations that would be saved if expected rates for priority wards moved to the expected rate at median deprivation*. Sources: Unplanned hospitalisations: 2016-17 Secondary User Service (SUS), NHS Digital. Population data: CCG registered population for October 2016, NHS Digital. Notes: Figures are taken from the Total (where 1 to 5 replaced with 3) column of the Top 10 conditions for priority wards table. *See Methodology Guide for further details. NHS Lewisham CCG NHS RightCare 24
Unplanned Hospitalisations for Chronic Ambulatory Care Sensitive Conditions and Urgent Care Sensitive Conditions for 2016/17

Top 10 Conditions for Inequality in all Priority Wards for your CCG

The table below shows the number of unplanned hospitalisations for all your CCG's priority wards with at least 50 hospitalisations combined.
This is broken down by the top 10 conditions in your CCG. The opportunity for saved hospitalisations if your CCG had no inequality is also
shown*.

Unplanned hospitalisations by condition
Abdominal and pelvic pain                                                                                                                                             192
Other disorders of urinary system                                                                                                                                     163
Pain in throat and chest                                                                                                                                              150
Other chronic obstructive pulmonary disease                                                                                                                           105
Heart failure                                                                                                                                                          67
Cellulitis                                                                                                                                                             62
Asthma                                                                                                                                                                 61
Atrial fibrillation and flutter                                                                                                                                        42
Non-insulin-dependent diabetes mellitus                                                                                                                                49
Epilepsy                                                                                                                                                               39
Other                                                                                                                                                                 393
Total                                                                                                                                                               1,323
Opportunity for saved hospitalisations, if your CCG had no inequality                                                                                                108

                                                                                                                                                                                                     `

Sources: Unplanned hospitalisations: 2016-17 Secondary User Service (SUS), NHS Digital. Population data: CCG registered population for Oc tober 2016, NHS Digital.

Notes:
Figures are taken from the Total (where 1 to 5 replaced with 3) row of the Top 10 conditions for priority wards table.
*This is the number of hospitalisations that would be saved if expected rates for priority wards moved to the expected rate at median deprivation. See Methodology Guide for further details.

NHS Lewisham CCG                                                                                                                                                                     NHS RightCare       25
Unplanned Hospitalisations for Chronic Ambulatory Care Sensitive Conditions and Urgent Care Sensitive Conditions for 2016/17
Top 10 Conditions for Inequality for Priority Wards for your CCG
The table below shows up to 20 of your CCG's priority wards, with at least 50 hospitalisations, ranked by the total number of unplanned hospitalisations. This is broken down by
the top 10 conditions in your CCG. The opportunity for saved hospitalisations, if your CCG had no inequality is also shown*.
Unplanned hospitalisations by condition
Priority Wards
Abdominal and pelvic pain
Atrial fibrillation and flutter
Other disorders of urinary
Other chronic obstructive
Pain in throat and chest
hospitalisations, if your
Non-insulin-dependent
CCG had no inequality
Opportunity for saved
Total (where 1 to 5
Total (where 1 to 5
pulmonary disease
replaced with 3)
diabetes mellitus
suppressed)
Heart failure
Epilepsy
Cellulitis
Asthma
system
Other
New Cross 31 30 27 13 8 14 10 6 17 11 74 241 241 24
Rushey Green 24 35 15 26 10 10 14 . 9 8 78 229 232 17
Bellingham 26 31 33 17 15 16 13 10 7 8 55 231 231 19
Downham 36 25 32 22 12 11 . 10 6 . 61 215 221 23
Whitefoot 38 20 20 18 12 8 10 10 7 6 61 210 210 11
Evelyn 37 22 23 9 10 . 11 . . . 64 176 188 13
. . . . . . . . . . . . . . .
. . . . . . . . . . . . . . .
. . . . . . . . . . . . . . .
. . . . . . . . . . . . . . .
. . . . . . . . . . . . . . .
. . . . . . . . . . . . . . .
. . . . . . . . . . . . . . .
. . . . . . . . . . . . . . .
. . . . . . . . . . . . . . .
. . . . . . . . . . . . . . .
. . . . . . . . . . . . . . .
. . . . . . . . . . . . . . .
. . . . . . . . . . . . . . .
. . . . . . . . . . . . . . .
. . . . . . . . . . . . . . .
Total (where 1 to 5 suppressed) 192 163 150 105 67 59 58 36 46 33 393 1,302 108
Total (where 1 to 5 replaced with 3) 192 163 150 105 67 62 61 42 49 39 393 1,323
Sources: Unplanned hospitalisations: 2016-17 Secondary User Service (SUS), NHS Digital. Population data: CCG registered population for October 2016, NHS Digital.
Notes:
Numbers between 1 and 5 have been suppressed or replaced with 3.
*This is the number of hospitalisations that would have been saved if expected rates for the priority wards moved to the expected rate at median deprivation. See Methodology Guide for further details.
NHS Lewisham CCG NHS RightCare 26Unplanned Hospitalisations for Chronic Ambulatory Care Sensitive Conditions and Urgent Care Sensitive Conditions for 2016/17 Your CCG benchmarked by sex with the Best 5 of your Similar 10 CCGs and England The charts below compare the rate of unplanned hospitalisations for your CCG with the rate for the average of the best (lowest) 5 in its Similar 10 and the rate for England by sex. These comparisons may reflect scope for improvement for your CCG. All bars show 95% confidence intervals to reflect statistical uncertainty. Where your CCG rate is statistically significantly higher than for the best 5 in its Similar 10 or England your CCG bar is coloured red. Numbers to the left of the red bars represent hospitalisations which could be saved if the CCG rate moved to the best 5 of its Similar 10 or England rate. A range is given to reflect statistical uncertainty. Two charts are shown for the different benchmarks. The chart above compares your CCG with the average of the best (lowest) 5 of its Similar 10. The chart below compares your CCG with England. Sources: Unplanned hospitalisations - SUS 2016/17, population data - CCG registered population for October 2016, NHS Digital (2017). Notes: Numbers less than 6 have been suppressed. *Data has been standardised for deprivation using indirect standardisation, deprivation has been measured using the Index of Multiple Deprivation for 2015. In addition data has also been standarised for age. For more detail please see tables on pages 59 and 60. NHS Lewisham CCG NHS RightCare 27
Unplanned Hospitalisations for Chronic Ambulatory Care Sensitive Conditions and Urgent Care Sensitive Conditions for 2016/17

Your CCG benchmarked by age with the Best 5 of your Similar 10 CCGs
The charts below compare the rate of unplanned hospitalisations for your CCG with the average of the best (lowest) 5 in its Similar 10 for various age groups. It is anticipated that different
age groups within your CCG will have different rates because they reflect different life stages. However, for the same age group, differences between your CCG and the average of the best
5 in its Similar 10 CCGs may reflect scope for improvement. All bars show 95% confidence intervals to reflect uncertainty. Where your CCG rate is statistically significantly higher than for the
best 5 in its Similar 10 your CCG bar is coloured red. Numbers to the left of the red bars represent hospitalisations which could be saved if the CCG rate moved to the best 5 of its Similar
10 rate. A range is shown to reflect statistical uncertainty.

Sources: Unplanned hospitalisations - SUS 2016/17, population data - CCG registered population for October 2016, NHS Digital (2017).

Notes:
Numbers less than 6 have been suppressed.
*Data has been standardised for deprivation using indirect standardisation, deprivation has been measured using the Index of Multiple Deprivation for 2015. Data has also been standardised for sex.
For more detail please see tables on pages 59 and 60.

NHS Lewisham CCG                                                                                                                                                                                       NHS RightCare   28
Unplanned Hospitalisations for Chronic Ambulatory Care Sensitive Conditions and Urgent Care Sensitive Conditions for 2016/17

Your CCG benchmarked by age with England
The charts below compare the rate of unplanned hospitalisations for your CCG with the rate for England for various age groups. It is anticipated that different age groups within
your CCG will have different rates because they reflect different life stages. However, for the same age group, differences between your CCG and England may reflect scope for
improvement for your CCG. All bars show 95% confidence intervals to reflect statistical uncertainty. Where your CCG rate is statistically significantly higher than for England your
CCG bar is coloured red. Numbers to the left of the red bars represent hospitalisations which could be saved if the CCG rate moved to the England rate. A range is shown to
reflect statistical uncertainty.

Sources: Unplanned hospitalisations - SUS 2016/17, population data - CCG registered population for October 2016, NHS Digital (2017).

Notes:
Numbers less than 6 have been suppressed.
*Data has been standardised for deprivation using indirect standardisation, deprivation has been measured using the Index of Multiple Deprivation for 2015. Data has also been standardised for sex.
For more detail please see tables on pages 59 and 60.

NHS Lewisham CCG                                                                                                                                                                                  NHS RightCare   29
Unplanned Hospitalisations for Ambulatory Care Sensitive and Urgent Care Sensitive Conditions for 2016/17

Data limitations for constructing rates for ethnic groups for your CCG

The next two slides benchmark rates of unplanned hospitalisations by ethnic group for your CCG. This requires the ethnic group of
the patient for each hospitalisation to be recorded. For some hospitalisations the ethnicity of the patient is recorded as unknown.

For your CCG 10.6% of hospitalisation records have an unknown ethnic group, compared to 6.6% for England and 12.7% for the
best 5 of your Similar 10.

We do not know if hospitalisations where the ethnicity of the patient is unknown are split disproportionately across ethnic groups or
if one ethnic group has a higher share of the hospitalisations of unknown ethnicity than another.

For each ethnic group, the comparability between your CCG rate and its benchmark rate will depend upon the proportion of
hospitalisations of unknown ethnicity for your CCG and the proportion for its benchmark. For each ethnic group the more
comparable the proportion unknown for your CCG and the proportion unknown for its benchmark, the more comparable will be the
hospitalisations rates between your CCG and its benchmark.

A further limitation of hospitalisation rates by ethnic group is that they are constructed by dividing the number of unplanned
hospitalisations by the population for each group and the population of each ethnic group has been estimated. Population
estimates by ethnic group are derived by applying 2011 Census ethnic group splits at a detailed level to 2016/17 CCG registered
population numbers.

Further detail is provided in slide 61 of the Annex.

NHS Lewisham CCG                                                                                           NHS RightCare                30
Unplanned Hospitalisations for Chronic Ambulatory Care Sensitive Conditions and Urgent Care Sensitive Conditions for 2016/17

Your CCG benchmarked by ethnicity with the Best 5 of your Similar 10 CCGs
The charts below compare the rate of unplanned hospitalisations for your CCG with the average of the best (lowest) 5 in its Similar 10 for various ethnic groups. It is
important to note that rates have been standardised for deprivation as well as sex and age, so that benchmarking is more specifically for ethnicity. Differences
between your CCG and the average of the best 5 in its Similar 10 CCGs may reflect scope for improvement. All bars show 95% confidence intervals to reflect
uncertainty. Where your CCG rate is statistically significantly higher than for the best 5 in its Similar 10 your CCG bar is coloured red. Numbers to the left of the red
bars represent hospitalisations which could be saved if the CCG rate moved to the best 5 of Similar 10 rate. A range is given to reflect statistical uncertainty.

Sources: Unplanned hospitalisations SUS 2016/17, population data - CCG registered population for October 2016, NHS Digital (2017).

Notes:
Numbers less than 6 have been suppressed.
*Data has been standardised for sex, age and deprivation using indirect standardisation, deprivation has been measured using the Index of Multiple Deprivation for 2015.
For more detail please see table on page 62.

NHS Lewisham CCG                                                                                                                                                           NHS RightCare   31
Unplanned Hospitalisations for Chronic Ambulatory Care Sensitive Conditions and Urgent Care Sensitive Conditions for 2016/17
Your CCG benchmarked by ethnicity with England
The charts below compare the rate of unplanned hospitalisations for your CCG with England for various ethnic groups. It is important to note that rates have been
standardised for deprivation as well as sex and age, so that benchmarking is more specifically for ethnicity. Differences between your CCG and England may reflect
scope for improvement. All bars show 95% confidence intervals to reflect uncertainty. Where your CCG rate is statistically significantly higher than for England your
CCG bar is coloured red. Numbers to the left of the red bars represent hospitalisations which could be saved if the CCG rate moved to the England rate. A range is
given to reflect statistical uncertainty.

 Sources: Unplanned hospitalisations - SUS 2016/17, population data - CCG registered population for October 2016, NHS Digital (2017).

 Notes:
 Numbers less than 6 have been suppressed.
 *Data has been standardised for sex, age and deprivation using indirect standardisation, deprivation has been measured using the Index of Multiple Deprivation for 2015.
 For more detail please see table on page 62.

NHS Lewisham CCG                                                                                                                                                            NHS RightCare   32
Inequalities in Psychological Therapies

    This section relates to CCG Indicators of Equity for Improving Access to Psychological
    Therapies (IAPT) for 2016/17

NHS Lewisham CCG                                                                             NHS RightCare   33
Inequality in Access to Psychological Therapies
Improving access to psychological therapies (IAPT) is an NHS programme in England that provides treatment approved by
the National Institute for Health and Care Excellence (NICE) for anxiety disorders and depression. More than 900,000 people
in England are accessing IAPT services each year, however there is scope for at least 1.5 million adults to access these
services. CCGs should consider if those in the population with common mental health problems are not only able to access
the service, but to get good outcomes. Reporting on the IAPT programme in general is based around referrals, waiting times
and outcomes (see link below). In this pack the focus lies with outcomes - eligible referrals moving to recovery.
Outcomes
The Government target is that 50% of eligible referrals to IAPT services should move to recovery.
IAPT Report for 16-17
NHS Lewisham CCG NHS RightCare 34IAPT Referrals Finishing a Course of Treatment in 2016/17 Your CCG benchmarked by sex with the Best 5 of your Similar 10 CCGs and England The top chart compares the rate of referrals finishing a course of treatment in 2016/17 for your CCG with the best 5 of your Similar 10 average rate by sex. The bottom chart compares your CCG rate with the England rate. The grey bars represent the benchmark rate whilst non-grey bars represent your CCG rate. Red bars indicate that your CCG is significantly lower than the benchmark. Amber bars indicate that there is no significant difference between your CCG and the benchmark. Green bars indicate that your CCG is significantly higher than the benchmark. Error bars use a 95% confidence level to show uncertainty. Numbers to the left of the red bars represent the number of referrals that could be made if the CCG rate moved to the benchmark rate. A range is given to reflect uncertainty. Sources: Psychological Therapies: Annual report on the use of IAPT services, NHS Digital (2018). Note: Data points with values less than 5 have been suppressed, therefore, for these points, bars are not shown on the chart. See page 63 for table by sex. NHS Lewisham CCG NHS RightCare 35
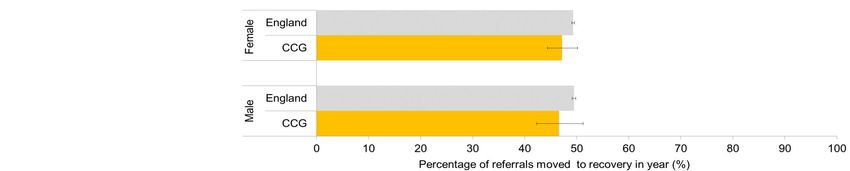
IAPT Referrals Moving to Recovery in 2016/17

Your CCG benchmarked by sex with the Best 5 of your Similar 10 CCGs and England

The top chart compares the rate of referrals moving to recovery in 2016/17 for your CCG with the best 5 of your Similar 10 average rate by sex. The bottom
chart compares your CCG rate with the England rate.

The grey bars represent the benchmark rate whilst non-grey bars represent your CCG rate. Red bars indicate that your CCG is performing significantly lower
than the benchmark. Amber bars indicate that there is no significant difference between your CCG and the benchmark. Green bars indicate that your CCG is
performing significantly higher than the benchmark. Error bars use a 95% confidence level to show uncertainty. Numbers to the left of the red bars represent
the number of recoveries that could be made if the CCG rate moved to the benchmark rate. A range is given to reflect uncertainty.

Sources: Psychological Therapies: Annual report on the use of IAPT services, NHS Digital (2018).
Note: Data points with values less than 5 have been suppressed, therefore, for these points, bars are not shown on the chart.       See page 63 for table by sex.

NHS Lewisham CCG                                                                                                                NHS RightCare                       36
IAPT Referrals Finishing a Course of Treatment in 2016/17
 Your CCG benchmarked by age with the Best 5 of your Similar 10 CCGs and England
 The top chart compares the rate of referrals finishing a course of treatment in 2016/17 for your CCG with the best 5 of your Similar 10 average rate by age. The bottom chart
 compares the CCG rate with the England rate.

 The grey bars represent the benchmark rate whilst non-grey bars represent the CCG rate. Red bars indicate that your CCG is significantly lower than the benchmark. Amber bars
 indicate that there is no significant difference between your CCG and the benchmark. Green bars indicate that your CCG is significantly higher than the benchmark. Error bars use a
 95% confidence level to show uncertainty. Numbers to the left of the red bars represent the number of referrals that could be made if the CCG rate moved to the benchmark rate . A
 range is given to reflect uncertainty.

Sources: Psychological Therapies: Annual report on the use of IAPT services, NHS Digital (2018).
Note: Data points with values less than 5 have been suppressed, therefore, for these points, bars are not shown on the chart.
                                                                                                                                                             See page 64 for table by age

NHS Lewisham CCG                                                                                                                                NHS RightCare                               37
IAPT Referrals Moving to Recovery in 2016/17 Your CCG benchmarked by age with the Best 5 of your Similar 10 CCGs and England The top chart compares the rate of referrals moving to recovery in 2016/17 for your CCG with the best 5 of your Similar 10 average rate by age. The bottom chart compares your CCG rate with the England rate. The grey bars represent the benchmark rate whilst non-grey bars represent your CCG rate. Red bars indicate that your CCG is significantly lower than the benchmark. Amber bars indicate that there is no significant difference between your CCG and the benchmark. Green bars indicate that your CCG is significantly higher than the benchmark. Error bars use a 95% confidence level to show uncertainty. Numbers to the left of the red bars represent the number of recoveries that could be made if the CCG rate moved to the benchmark rate. A range is given to reflect uncertainty. Sources: Psychological Therapies: Annual report on the use of IAPT services, NHS Digital (2016) Note: Data points with values less than 5 have been suppressed, therefore for these points, bars are not shown on the chart. See page 64 for table by age NHS Lewisham CCG NHS RightCare 38
Rates of IAPT referrals finishing a course of treatment and moving to recovery for Ethnic Groups 2016/17
Data limitations for constructing rates for ethnic groups for your CCG
The next two slides benchmark IAPT rates of referrals finishing a course of treatment and moving to recovery by ethnic group for your CCG. This
requires the ethnic group of the patient for each referral to be recorded. For some referrals the ethnicity of the patient is recorded as unknown.

For your CCG, 1.9% of referrals finishing a course of treatment have an unknown ethnic group, compared to 6.8% for England and 3.2% for the best 5
of your Similar 10.
Furthermore for your CCG , 1.0% of referrals moving to recovery have missing ethnicity, compared with 6.3% for England and 2.2% for the best 5 of
your Similar 10.

We do not know if referrals (or movements to recovery) where the ethnicity of the patient is unknown are split disproportionately across ethnic groups or
if one ethnic group has a higher share of the referrals (or movements to recovery) of unknown ethnicity than another.

For each ethnic group, the more comparable the proportion of referrals (or movements to recovery) of unknown ethicity for your CCG and the proportion
of referrals (or movements to recovery) of unknown ethnicity for its benchmark, the more comparable will be the referral (or movement to recovery) rates
between your CCG and its benchmark.

A further limitation of referral rates by ethnic group is that they are constructed by dividing the number of unplanned referrals by the population for each
group and the population of each ethnic group has been estimated. Population estimates by ethnic group are derived by applying 2011 Census ethnic
group splits at a detailed level to 2016/17 CCG registered population numbers.

Further detail is provided in slide 66 of the Annex.

Note: * means missing data

NHS Lewisham CCG                                                                                                       NHS RightCare                       39
IAPT Referrals Finishing a Course of Treatment in 2016/17
Your CCG benchmarked by ethnicity with the Best 5 of your Similar 10 CCGs and England
The top chart compares the rate of referrals finishing a course of treatment in 2016/17 for your CCG with the best 5 of your Similar 10 average rate by ethnicity. The bottom chart compares your CCG rate with
the England rate. It is important to note that rates have not been standardised for deprivation, sex or age, so the CCG will be more comparable with the best 5 of its Similar 10 than England.

The grey bars represent the benchmark rate whilst non-grey bars represent your CCG rate. Red bars indicate that your CCG is significantly lower than the benchmark. Amber bars indicate that there is no
significant difference between your CCG and the benchmark. Green bars indicate that your CCG is significantly higher than the benchmark. Error bars use a 95% confidence level to show uncertainty.
Numbers to the left of the red bars represent the number of referrals that could be made if the CCG rate moved to the benchmark rate. A range is given to reflect uncertainty.

Sources: Psychological Therapies: Annual report on the use of IAPT services, NHS Digital (2018).

Notes:                                                                                                                                                                                                         See page 67 for table by ethnicity.
Data points with values less than 5 have been suppressed, therefore for these points, bars are not shown on the chart.
A large rate for "Other" may reflect incorrect use of this category where ethnicity is unknown or unrecorded. This may result in con fidence intervals beyond the range shown on the chart.

NHS Lewisham CCG                                                                                                                                                                              NHS Right Care                                40
IAPT Referrals Moving to Recovery in 2016/17
Your CCG benchmarked by ethnicity with the Best 5 of your Similar 10 CCGs and England
 The top chart compares the rate of referrals moving to recovery in 2016/17 for your CCG with the best 5 of your Similar 10 average rate by ethnicity. The bottom chart
 compares your CCG rate with the England rate. It is important to note that rates have not been standardised for deprivation, sex or age, so the CCG will be more
 comparable with the best 5 of its Similar 10 than England.

 The grey bars represent the benchmark rate whilst non-grey bars represent your CCG rate. Red bars indicate that your CCG is significantly lower than the benchmark.
 Amber bars indicate that there is no significant difference between your CCG and the benchmark. Green bars indicate that your CCG is significantly higher than the
 benchmark. Error bars use a 95% confidence level to show uncertainty. Numbers to the left of the red bars represent the number of recoveries that could be made if the
 CCG rate moved to the benchmark rate. A range is given to reflect uncertainty.

Sources: Psychological Therapies: Annual report on the use of IAPT services, NHS Digital (2018).
Note: Data points with values less than 5 have been suppressed, therefore for these points, bars are not shown on the chart. Where a benchmark is not shown, data are unavailable.        See page 67 for table by ethnicity

NHS Lewisham CCG                                                                                                                                                         NHS Right Care                                   41
IAPT Referrals Finishing a Course of Treatment in 2016/17
Your CCG benchmarked by deprivation with the Best 5 of your Similar 10 CCGs and England
 The top chart compares the rate of referrals finishing a course of treatment in 2016/17 for the CCG with the best 5 of your Similar 10 average rate by deprivation. The bottom chart compares your CCG rate with the
 England rate.

 The grey bars represent the benchmark rate whilst non-grey bars represent the CCG rate. Red bars indicate that your CCG is significantly lower than the benchmark. Amber bars indicate that there is no significant
 difference between your CCG and the benchmark. Green bars indicate that your CCG is performing higher than the benchmark. Error bars use a 95% confidence level to show uncertainty. Numbers to the left of the red
 bars represent the number of referrals that could be made if the CCG rate moved to the benchmark rate. A range is given to r eflect uncertainty.

Sources: Psychological Therapies: Annual report on the use of IAPT services, NHS Digital (2018).
Note: Data points with values less than 5 have been suppressed, therefore for these points, bars are not shown on the chart.                                                                  See page 68 for table by deprivation.

NHS Lewisham CCG                                                                                                                                                  NHS Right Care                                              42
IAPT Referrals Moving to Recovery in 2016/17
Your CCG benchmarked by deprivation with the Best 5 of your Similar 10 CCGs and England
 The top chart compares the rate of referrals moving to recovery in 2016/17 for your CCG with the best 5 of your Similar 10 average rate by deprivation. The bottom chart compares your CCG rate with
 the England rate.

 The grey bars represent the benchmark rate whilst non-grey bars represent your CCG rate. Red bars indicate that your CCG is significantly lower than the benchmark. Amber bars indicate that there is
 no significant difference between your CCG and the benchmark. Green bars indicate that your CCG is significantly higher than the benchmark. Error bars use a 95% confidence level to show
 uncertainty. Numbers to the left of the red bars represent the number of recoveries that could be made if the CCG rate moved to the benchmark rate. A range is given to reflect uncertainty.

 Sources: Psychological Therapies: Annual report on the use of IAPT services, NHS Digital (2018).
 Note: Data points with values less than 5 have been suppressed, therefore for these points, bars are not shown on the chart.                                                    See page 68 for table by deprivation.

NHS Lewisham CCG                                                                                                                                    NHS Right Care                                                  43
Promoting Equality and Reducing Health Inequalities, from Data
   Analysis and Case Studies to Action Planning

     This section contains good practice examples of interventions used to promote equality and reduce
     health inequalities and some key links to further resources. It also contains slides suggesting how the
     data analysis and case studies contained in these packs might be used to support action planning.

NHS Lewisham CCG                                                                                          NHS RightCare   44
New Care Model Case Study
Community Outpatient Services (Sandwell and West Birmingham CCG)
This is an intervention in the Connected Care Partnership New Care Models vanguard in Sandwell and West Birmingham CCG for which
evaluation evidence has been provided by the University of Birmingham.
The aim of this intervention is to deliver specialist outpatient services within a primary care context to improve access, reduce hospital
waiting times and deliver more efficient outpatient care using one-stop clinics where patients receive their consultation and investigations
during a single appointment. The range of specialist services has increased and these now include cardiology, dermatology, rheumatology,
Ear, Nose and Throat (ENT), gynaecology, urology, x-ray, respiratory, pain management and anti-coagulation. Some of these services are
being delivered via telemedicine as an alternative to face-to-face consultations.
Key Impacts
Compared with more usual hospital care there is evidence of improved patient experience (87% of patients were likely to recommend the
services to friends and family), improved clinical quality, lower onward referral rates and shorter waiting times. Outpatient services were
audited by consultants who looked at the service received by 10 patients per speciality. All services were rated 'good' or 'excellent'.
Example Services
• Cardiology service: Patients recognised an improvement in skill and competence of staff in primary care. This has meant fewer patient
referrals to acute services for minor issues. The service is seeing an increased number of patients referred from local pract ices and
Sandwell & West Birmingham Hospitals NHS Trust. GP training to increase their confidence to manage patients with no need for referral
has been positively received. Some patients have received earlier interventions than they might otherwise have received and t his has led
to improved clinical outcomes.
• Urology service: The service started in July 2017. For urology in 2017/18, patients using community outpatient services sho w lower
rates of new referrals per 1,000 patients compared with Sandwell and West Birmingham average. They also appear to have lower costs
per 1,000 patients.
Inference
Compared with the treatment in a hospital, the shorter waiting times and improved quality community based care should result in fewer
unplanned hospitalisations for patients using the services due to earlier intervention within the community.
For more information on outpatient services in Sandwell and West Birmingham, please contact:
Sapna Shannon
Mobile: 07976 683 446
Email: sapna.shannon@nhs.net
Address: Orsborn House, 55 Terrace Road, Birmingham, B19 1BP
Website: www.modalitypartnership.nhs.uk
NHS Lewisham CCG NHS RightCare 45You can also read