Pesticides products commercialized in - and related
←
→
Page content transcription
If your browser does not render page correctly, please read the page content below
IBAMA
         M M A

Pesticides
   and related
products
commercialized in
 Brazil in 2009

  An environmental approach
Pesticides and related products
       commercialized in
         Brazil in 2009

    An environmental approach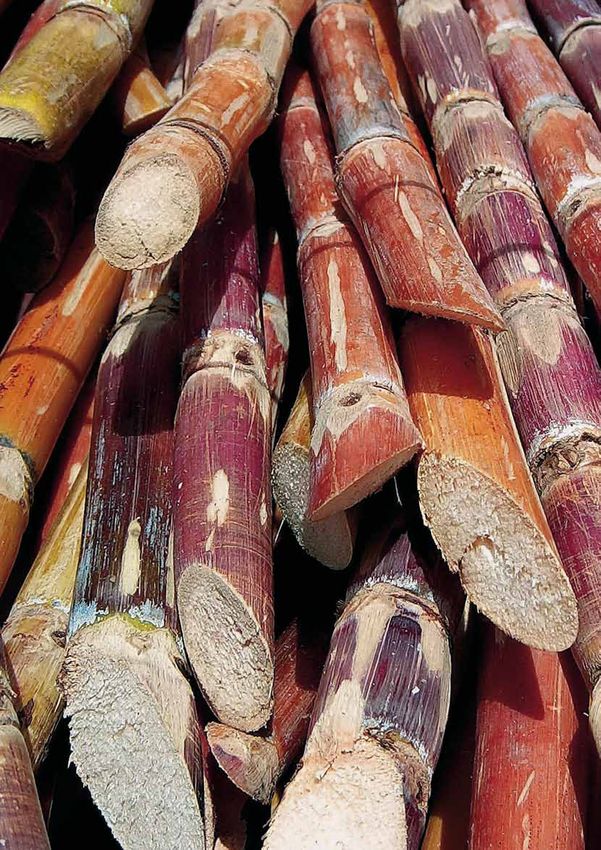
Ministry of Environment
Izabella Teixeira

Executive Secretary
José Machado

Brazilian Institute for the Environment and Renewable Natural Resources
Abelardo Bayma

Department of Environmental Quality
Fernando da Costa Marques

General Coordination of Environmental Control and Evaluation for Dangerous Substances
Marcio Rosa Rodrigues de Freitas

Coordination of Environmental Monitoring and Reevaluation of Chemical Substances and Dangerous Products
Rafaela Maciel Rebelo

Coordination of Environmental Control of Dangerous Products
Marisa Zerbetto

Coordination of Environmental Evaluation of Dangerous Products
Kênia Godoy

Authors
Rafaela Maciel Rebelo (technical coordination)
Reinaldo Aparecido Vasconcelos
Bruno Dorfman Mac Cormick Buys (English version)
Jaciara Aparecida Rezende
Karina de Oliveira Cham de Moraes
Régis de Paula Oliveira

Colaboration
Andries Jan Algera
Izabela Mascarenhas Matosinhos de Sousa
Lucas Paulo Alencar Queiroz
Renata Lara Santana
Roberta Marques Feijó
Tiara Carvalho Macedo
Vanessa Lucas Xavier

Technical Revision
Adriana de Araújo Maximiano
Marlos Moreira dos Santos
Pesticides and related products
       commercialized in
         Brazil in 2009

    An environmental approach
Publishing Team

                 Brazilian Institute for the Environment and Renewable Natural Resources
                 National Center for Information, Environmental Technologies and Printing
                                     SCEN, Trecho 2, Edifício-Sede do Ibama
                                           CEP: 70818-900 Brasília-DF
                                       Phone: (61) 3316-1225 /// 3316-1294
                                               Fax: (61) 3316-1123
                                            http://www.ibama.gov.br

                 National Center for Information, Environmental Technologies and Printing
                                          Jordetanea Souto Santos

                                                          Editing
                                                    Maria José Teixeira
                                                     Vitória Rodrigues

                                              Layout, Diagram and Cover
                                                Carlos José e Paulo Luna

                                            Bibliographic Standardization
                                                  Helionidia C. Oliveira

                                                          Photos
Page 7                                      Page 25                                            Page 68
Andrew Butko.                               Wolf Seeds do Brasil                               Wikimedia Commons
Page 8                                      Page 26                                            Page 72
Wikimedia Commons                           Wikimedia Commons                                  Júnior Miranda
Page 12                                     Page 32                                            Page 76
Scott Bauer                                 Wikimedia Commons                                  Derek Ramsey
Page 14                                     Page 32                                            Page 78
Bruno Buys                                  Felipe Stahlhoefer (Wikimedia Commons).            Bruno Buys
Page 16                                     Page 48
                                                                                               Page 80
Wikimedia Commons                           Michael E. Crocker
                                                                                               Wikimedia Commons
Page 21                                     Page 63
                                                                                               Page 84
Mihael Simonič                              Bruno Buys
                                                                                               José Reynaldo da Fonseca
Page 22                                     Page 64
Wikimedia Commons                           Wikimedia Commons

                                                  Cataloging-in-publication data
                         Brazilian Institute for the Environment and Renewable Natural Resources

159p      Brazilian Institute for the Environment and Renewable Natural Resources
             Pesticides and related products commercialized in Brazil in 2009: an environmental approach / Rafaela Maciel
          Rebelo…[et al.]. – Brasília: Ibama, 2010.
              84 p.: il. Color. : 29cm.

              ISBN 978-85-7300-309-3

              1. Pesticides – Brazil. 2. Danger product. 3. Pesticides (environemnt). I. Rebelo, Rafaela Maciel. II. Buys, Bruno
          Dorfman Mac Cormick. III. Rezende, Jaciara Aparecida. IV. Moraes, Karina de Oliveira Cham de. V. Oliveira, Régis
          de Paula. VI. Brazilian Institute for the Environment and Renewable Natural Resources. VII. Department of Environ-
          mental Quality – General Coordination of Environmental Control and Evaluation for Dangerous Substances. V. Title.

                                                                         CDU(2.ed.) 632.934.064

Impresso no Brasil
Printed in Brazil
General Index

Introduction.........................................................................................................................................15

Chapter I - Pesticides: Legislation, Current Context and Environmental Impacts...............................17

1.1 Definition.......................................................................................................................................17
1.2 Economical Importance.................................................................................................................17
1.3 The Agricultural Production in Brazil..............................................................................................19
1.4 Pesticides and Environment..........................................................................................................19

Chapter II - The Evaluation of the Potential to Environmental Harm...................................................23

2.1 The Environmental Classification..................................................................................................23

Chapter III - Methods And Data Calculation........................................................................................25

3.1 Methods and Limitations...............................................................................................................25
3.2 Reports in Ibama´s Pesticide System in the year of 2009.............................................................25
3.3 Data Consolidation........................................................................................................................27

Chapter IV - Main Active Ingredients Commercialized In Brazil..........................................................33

4.1 Active Ingredients.........................................................................................................................33
4.2 Glyphosate....................................................................................................................................34
4.3 Cypermethrin.................................................................................................................................36
4.4 Mineral Oil.....................................................................................................................................37
4.5 Vegetable Oil.................................................................................................................................38
4.6 Sulphur..........................................................................................................................................38
4.7 2,4-Dichlorophenoxyacetic Acid....................................................................................................40
4.8 Atrazine.........................................................................................................................................41
4.9 Metamidophos..............................................................................................................................43
4.10 Acephate.....................................................................................................................................44
4.11 Carbendazim................................................................................................................................46

Chapter V - Use Types.........................................................................................................................49

5.1 Distribution of Commercialization in the main use types..............................................................49
5.2 Herbicides.....................................................................................................................................53
5.3 Insecticides...................................................................................................................................56
5.4 Fungicides.....................................................................................................................................56
5.5 Adjuvants.......................................................................................................................................59
5.6 Acaricides......................................................................................................................................60

Chapter VI - Environmental Classes....................................................................................................65

6.1 Distribution of Commercialization in Environmental Classes........................................................65

Chapter VII - Commercialization in the States.....................................................................................69

Chapter VIII - Biological products and pheromones............................................................................73

Chapter IX - Non-Agricultural Pesticides..............................................................................................77

Chapter X - Perspectives.....................................................................................................................79

Bibliographic References.....................................................................................................................81
Figure Index

Figure 1 – Evolution of the Internal Gross Product (IGP) Agriculture
		 and Cattle Raising (1990 -2009).......................................................................................18
Figure 2 – Variation rates of the Total IGP and Sector IGP...............................................................18
Figure 3 – Average growth rate of agricultural exports from Brazil, EU and the US,
		 between 2000 and 2008..................................................................................................19
Figure 4 – Technical Grade Product x Formulated Product..............................................................24
Figure 5 – Map of registering, manufacturing, commercializing and formulating
		 companies in Brazil..........................................................................................................26
Figure 6 – Declarations available in the Electronic System for the year of 2009..............................27
Figure 7 – Data consolidation scheme.............................................................................................27
Figure 8 – The top ten active ingredients commercialized in Brazil in 2009.....................................33
Figure 9 – Structural Formula of glyphosate and 3D representation................................................34
Figure 10 – Environmental Classification of formulated products based on glyphosate....................35
Figure 11 – Spatialization of glyphosate sales per State....................................................................35
Figure 12 – Environmental classification of formulated products based on cypermethrin.................36
Figure 13 – Spatialization of cypermethrin sales by State..................................................................36
Figure 14 – Environmental classification of products based on mineral oil........................................37
Figure 15 – Spatialization of mineral oil sales by State – 2009...........................................................37
Figure 16 – Spatialization of vegetable oil sales by State – 2009.......................................................38
Figure 17 – Environmental classification of products based on sulphur.............................................39
Figure 18 – Spatialization of sulphur commercialization for each Brazilian State – 2009....................39
Figure 19 – Structural formula of 2,4-D and 3D representation..........................................................40
Figure 20 – Environmental classification of products based on 2,4-D................................................40
Figure 21 – Spatialization of 2,4-D sales by State...............................................................................41
Figure 22 – Atrazine´s structural formula and 3D representation.......................................................41
Figure 23 – Environmental classification of products based on atrazine............................................42
Figure 24 – Spatialization of atrazine sales for each brazilian state....................................................42
Figure 25 – Structural formula and 3D representation for metamidophos.........................................43
Figure 26 – Environmental classification of products based on the active
		 ingredient metamidophos................................................................................................43
Figure 27 – Spatialization of metamidophos in the Brazilian states....................................................44
Figure 28 – Structural formula and 3D representation of acephate....................................................44
Figure 29 – Environmental classification of products based on active ingredient acephate..............45
Figure 30 – Spatialization of acephate´s commercialization in the Brazilian states............................45
Figure 31 – Structural formula and 3D representation of carbendazim..............................................46
Figure 32 – Environmental classification of formulated products based on carbendazim..................46
Figure 33 – Spatialization of sales for carbendazim in the Brazilian states - 2009..............................46
Figure 34 – Data for sales of pesticides based on their main usage classes.....................................49
Figure 35 – Distribution of herbicide commercial brands among the environmental classes............50
Figure 36 – Distribution of herbicide among the environmental classes, by amount
		 sold (values in tonnes).....................................................................................................50
Figure 37 – The top ten herbicide active ingredients sold..................................................................51
Figure 38 – Number of commercial brands (formulated products) by herbicide
		 active ingredient..............................................................................................................51
Figure 39 – Herbicides: Comparison between the number of commercial brands
		 actually sold and the number of commercial brands reported as not sold,
		 by active ingredient.........................................................................................................52
Figure 40 – Proportion of active ingredient glyphosate and its salts in the herbicide market............52
Figure 41 – Distribution of commercial brands of insecticides by environmental class.....................53
Figure 42 – Distribution of insecticides by amount commercialized (values in tonnes)
		 among environmental classes.........................................................................................53
Figure 43 – The ten best sold insecticide active ingredients..............................................................54
Figure 44 – Number of commercial brands (formulated products) by insecticide
		 active ingredient..............................................................................................................54
Figure 45 – Insecticides: comparison between number of commercial brands sold
		 and number of commercial brands reported with zero sales, by active ingredient.........55
Figure 46 – Proportion of cypermethrin and its salts in the insecticide market.................................55
Figure 47 – Distribution of commercial brands of fungicides among environmental classes............56
Figure 48 – Distribution of commercial brands of fungicides among environmental classes
		 and amounts commercialized (values in tonnes).............................................................57
Figure 49 – The top ten largest sellers of fungicides.........................................................................57
Figure 50 – Number of commercial brands (formulated products) by fungicide active ingredient.....58
Figure 51 – Fungicides: comparison between number of brands sold and brands reported
		 without any commercialization, by active ingredient – 2009...........................................58
Figure 52 – Distribution of commercial brands of adjuvants by environmental class.........................59
Figure 53 – Distribution of commercial brands of adjuvants by environmental class and
		 totals sold (values in tonnes)...........................................................................................59
Figure 54 – Adjuvants: total amount sold (tonnes).............................................................................60
Figure 55 – Number of commercial brands by adjuvant.....................................................................60
Figure 56 – Distribution of commercial brands of acaricides by environmental class........................61
Figure 57 – Distribution of acaricide amounts commercialized by environmental class
		 (values in tonnes).............................................................................................................61
Figure 58 – The top ten most commercialized acaricide active ingredients.......................................62
Figure 59 – Number of commercial brands (formulated products) by Active Ingredient
		 with acaricide action........................................................................................................62
Figure 60 – Acaricides: comparison between the number of commercialized brands
		 and non-commercialized brands, by active ingredient.....................................................62
Figure 61 – Commercialization of Pesticides x Environmental Classes.............................................65
Figure 62 – Spatialization of pesticide commercialization in 2009, by state, considering
		 environmental classes of formulated products...............................................................66
Figure 63 – Spatialization of commercialization considering environmental classes I and IV
		 in the Brazilian states.......................................................................................................67
Figure 64 – Spatialization of the top ten consuming states................................................................69
Figure 65 – Commercialization in 2009 x Planted Area in 2008.........................................................71
Figure 66 – Spatialization of biological products sales per region......................................................74
Figure 67 – Spatialization of commercialization for biological products per state...............................75
Table Index

Table 1 – Main cultures in 2008........................................................................................................19
Table 2 – Relation Main Crops x 10 Active Ingredients.....................................................................34
Table 3 – Top five most consumed active ingredients, by state.......................................................71
Table 4 – Pheromone use (kg)...........................................................................................................73
Introduction

Pesticide usage is a fundamental part of the con-          research for registration of less dangerous alter-
temporary and highly productive agricultural mo-           natives to common products. In environmental
del. However, its social and environmental im-             science research, the Semiannual Reports infor-
pacts demand continued concern from society.               mation is also helpful in determining priorities for
Therefore, the Article 41 from Decree nº 4.074 of          environmental impact studies, for surface and
2002, states that companies owning pesticide re-           groundwater contamination studies and adverse
gistries in Brazil shall report their sales in a semian-   effects to fauna. In human health science, the in-
nual document to the Brazilian registry authority          formation reported here might be decisive in sor-
(BRAZIL, 2002). Such reports allow the govern-             ting substances to be scanned based on amounts
ment to monitor amounts of products commercia-             sold in the country.
lized in the country, as well as amounts imported          At last, only the effective use of this dataset
and exported. That information is strategic for va-        will allow a deeper insight on whether the tool
rious reasons, not only in the context of IBAMA´s          provided by law is adequate to the specific end
own work, but also for other instances of the pu-          it was originally thought. Eventually, when a re-
blic administration and for society as a whole.            vision of the law is to take place, we will be able
By publishing this information, we hope to contri-         to foster an informed debate about the Article
bute to a better knowledge of pesticide deploy-            41 of Decree nº 4.074, reducing its current limi-
ment both by agriculture and the industry sector.          tations.
The informations about the quantities of products          A detailed explanation about the current limita-
commercialized and their trends over time might            tions of the semiannual pesticide reports can be
help in regulatory decision-making, strengthening          found in Chapter III. This explanation allows an un-
of law enforcement on products whose sales are             derstanding of its reach and premises, that shall
booming and in the authorization of studies and            guide the conclusions to be drawn from it.
Chapter I - Pesticides: Legislation,
                             Current Context and Environmental
                             Impacts

1.1 Definition                                             1.2 Economical Importance

According to Law nº 7802, from July/11/89:                 Agriculture, since its inception, is one of the main
Pesticides and related products are defined as the pro-    Brazilian economies. According to Terra and Pe-
ducts and agents of physical, chemical and biological      laez (2009), the first pesticide productive units in
processes designed for use in production, storing and      Brazil date from the mid-1940. However, starting
beneficiation of agricultural goods, in pastures, in fo-   in the second half of the 1970´s, that industry grew
rest protection, both native and planted, and in other     significantly, and pesticide commercialization has
ecosystems, and also in urban, aquatic and industrial      grown steadily since then. During the whole pe-
environments, whose goal is to alter the fauna and flo-    riod from 1975 to 2009, Brazil has always been
ra composition to protect it from the action of living
                                                           between the six major pesticide world markets.
beings considered harmful. (BRASIL, 1989).
                                                           In 2008, Brazil reached the first rank in world pes-
Commonly called pesticides, these products con-            ticide consumption. According to a survey by the
trol undesired living species in order to protect          Sindicato Nacional da Indústria de Produtos para
other living beings, their products or the environ-        Defesa Agrícola (Sindag), pesticide sales amoun-
ment. Pesticides have toxic substances called ac-          ted to US$ 7,125 billion, against US$ 6.6 billion
tive ingredients in their composition that interfere       from the second ranked country, the USA (AN-
with normal biological activity of the target spe-         DEF, 2009).
cies. The active ingredient is the chemical, physi-        The agricultural sector has grown in the past few
cal or biological agent that provides effectiveness        years, outperforming itself. Data from IPEADATA
to pesticides. (BRASIL, 1989).                             (2010) shows that agriculture´s Internal Gross Pro-
Pesticide diversity of uses is due to their varying        duct (IGP) share is growing, as shown in the graph
modes of action, which can be against plants               below (Figure 1). It is noteworthy to point out that
(herbicides), insects (insecticides), fungi (fungici-      the Internal Gross Product from agriculture mea-
des), soil microorganisms (nematicides), mollusks          sures the revenue obtained only from agriculture
(molluscicide), among others.                              and livestock inside farms.
Pesticides and related products commercialized in Brazil in 2009 Source: Ipeadata. Figure 1 – Evolution of the Internal Gross Product (IGP) Agriculture and Cattle Raising (1990 -2009) 1. Source: Conab, 2009. Figure 2 – Variation rates of the Total IGP and Sector IGP . Besides, Brazil is also the third greatest agricul- agricultural exports have grown by 18.6%/year tural exporter in the world, behind only the US in average, while the US and EU have grown and European Union. In 2000, Brazil was ranked 8.4% and 11.4% respectively, as shown in Fi- in 6th. However, in the last few years, Brazilian gure 3 (O Estado de São Paulo, 2010). 1 IGP information for each year are shown in quarters. However, due to visual reasons, not all quarters are displayed in the legend. 18
Instituto Brasileiro do Meio Ambiente e dos Recursos Naturais Renováveis

Figure 3 – Average growth rate of agricultural exports from Brazil, EU and the US, between 2000 and 2008.

1.3 The Agricultural Production in Brazil                            1.4 Pesticides and Environment

Brazil is one of the few major world food produ-                     The increase in productivity due to pesticide use
cers that bear the competitiveness to provide for                    is undeniable (PERES et al., 2005).
the world demand of food, fibers and renewable
                                                                     The processes employed in crop growing tend
energy (ANDEF, 2009).
                                                                     to produce biological imbalances in nature. The-
According to results from a research by IBGE                         se processes include the removal of competitive
in 2008, despite the world financial crisis, Brazil                  plants, use of varieties obtained by artificial se-
had a record agricultural production, with growth                    lection, allocation of areas for growing only one
of 9.1%, compared to 2007 (IBGE, 2009). Such                         species, adubation, irrigation, pruning and pest
growth was due mainly to favourable climatic                         control. Man was unable to avoid imbalances and
conditions.                                                          yet obtain the desired amount and quality of crop
                                                                     yield. Therefore, use of chemical products might
One example concerns the grain production, re-
                                                                     be a tool to protect against reduced production or
aching 154,400,000 tonnes. It was the greatest
                                                                     crop destruction (JEPPSON et al., 1975).
harvest ever recorded, with an increase of 4.8%
of the planted area, compared to the previous                        However, this massive deployment of chemical
year, totaling 161,453,714.14 acres. The record                      substances represents a great challenge for the
harvest yielded R$ 148 billion (U$ 80 billion). Main                 preservation of environmental quality. Pesticides
crops were corn (13.1% growth) and soy (2.4%                         contain toxic substances in their composition (called
growth) (IBGE, 2009).                                                active ingredients) that interfere in the normal biolo-
                                                                     gical activity of the target living beings. Despite the
                                                                     designed specificity of these substances, they tend
      Ranking              Culture           2008 Harvest            to be harmful to every organism exposed.
          1º            SUGARCANE            648,970,000 t                   The term ecotoxicology was coined by the
          2º             SOY (grain)          59,916,000 t           French professor and researcher René Truhaut in
          3º            CORN (grain)          59,011,000 t           1969, by joining the word “eco” (greek oîkos, me-
          4º              CASSAVA             26,300,000 t           aning home, habitat, environment) and the word
          5º              ORANGE              18,300,000 t           toxicology (science of toxic agents, poisons and
          6º                RICE              12,100,00 t            intoxication). In that time there was a great con-
                                                                     cern from scientists and authorities in understan-
Source: IBGE/ Cepagro, 2010 Systematic Survey of Agricultural Pro-
duction – 2008.                                                      ding the deleterious effects caused by chemical

                                                                                                                         19
Pesticides and related products commercialized in Brazil in 2009 substances, specifically human-made ones, on in basic ecosystem processes, such as soil res- the ecosystem, their constituents and interrela- piration, nutrient cycling, death of fishes or birds, tionships (AZEVEDO; CHASIN, 2004). as well as the reduction of their populations. The term ecotoxicology is employed to relate the Given all these problems, pesticides are evalua- toxic effects of chemical substances and physical ted previous to its use, and it is mandatory for a agents with livings beings, specifically in the po- pesticide to be registered prior to its commercia- pulations and communities of a defined ecosys- lization, with the evaluation and approval of the tem, including the transfer paths of these agents federal health, agriculture and environment au- and their interaction with the environment. thorities. Such evaluations try to identify poten- Pesticide ecotoxicity is variable, and according to tial harms and establish limitations, restrictions the active ingredient´s properties, it can be broa- and use recommendations, thus preventing and der or narrower. Effects can be acute (immediate), limiting damage to the human health and envi- subchronic (near future) or chronic (long run). The- ronment. se effects may interfere in physiology, behaviour, Currently, the competences of the federal autho- lifespan and reproduction, among other factors. rities are defined in Law nº 7802 of July/11/1989 Depending on their toxicity and persistence in (BRASIL, 1989) and Decree nº 4074, of Janua- the environment, pesticides may also interfere ry/04/2002 (BRASIL, 2002). 20
CHAPTER II - The Evaluation of the
                           Potential to Environmental Harm

2.1 The Environmental Classification                   of a pesticide, its components and related pro-
                                                       ducts, classifications are given to 19 individual
                                                       parameters, among those quoted above, that will
Decree nº 4.074 establishes in its Article 7º,         result in the final classification, according to the
Item II, that it is the duty of the Ministry of En-    following ranking (IBAMA, 2009):
vironment to carry on the environmental evalua-
tion of pesticides, their components and related
                                                            Class I – Highly Dangerous Product
products, defining their classification concer-
                                                            Class II – Very Dangerous Product
ning the potential to environmental harm (BRA-
                                                            Class III – Dangerous Product
SIL, 2002). Such competence was given to IBA-
                                                            Class IV – Slightly Dangerous Product
MA since the first version of the law, in 1990,
and is currently part of the Decree nº 6.099, of
April/24/2007 (BRASIL, 2007), which delegates
                                                       Thus, every pesticide registered in Brazil bears
the activities of evaluation, registry and control
                                                       one of these ranks, designed to prevent and pro-
of chemical substances, pesticides, their com-
                                                       tect the environment from possible harms caused
ponents and related products, according to the
                                                       by chemical agents. The smaller the Class, the hi-
law currently in force.
                                                       gher the environmental harm due to its use. The
The environmental evaluation of pesticides com-        environmental Class is informed in the central co-
prehends a wide range of knowledge areas such          lumn of the product´s label and bula.
as chemistry, ecology, pedology, agricultural pro-
                                                       Besides the classification ranking, when a pro-
duction and toxicology, among others, as well as
                                                       duct happens to be highly dangerous to any of
intellectual property, risk communication (labels
                                                       the individual environmental parameters, like,
and bulas) and various other activities.
                                                       for example, highly persistent, or highly toxic for
Therefore, the Evaluation of the Potential do En-      aquatic microorganisms, their labels will carry
vironmental Harm that is performed by IBAMA is         statements communicating these specific harms
based on the inherent characteristics of the pro-      clearly and visibly. These informations are also
duct: its physico-chemical properties, its toxicity    printed to the product´s bula, in order to alert
for various groups of animals found in nature, its     consumers of the toxic properties for the envi-
potential to accumulate in living tissues, wether it   ronment.
can remain for a long time in the environment, if
                                                       IBAMA works with the classification of technical
it can be transported (through soil, air or water).
                                                       grade products, agricultural and non-agricultural
Also its potential to cause mutations, cancer, mal-
                                                       formulations. The technical grade product, accor-
formations in fetuses or embryos, and whether
                                                       ding to current law, is the product obtained directly
they can pose a threat to reproduction of birds
                                                       from raw materials through a chemical, physical or
and mammals.
                                                       biological process, in order to produce formulated
In order to perform the classification of the Poten-   products or pre-mixes, and whose composition
tial to Environmental Harm (PPA, in Portuguese)        contains a defined concentration of active ingre-
Pesticides and related products commercialized in Brazil in 2009
dients and impurities, still containing substances tal characteristics gathered during evaluation of
like stabilizers and related products like isomers. the technical grade products were taken into ac-
count.
Therefore, in this diagnostic, when drawing the
profile of the active ingredients, the environmen-
Figure 4 – Technical Grade Product x Formulated Product.
In order to calculate data, only formulated pro- and their physicochemical data, field dose, appli-
ducts were taken into account, excluding techni- cation mode and toxicity are used for evaluations
cal grade products (whose are also informed in the of exposure to non-target organisms and environ-
Semiannual Reports – see below). This is because mental risk. Technical products remain constrai-
only formulated products are actually sold for use ned in industrial plants, limited as raw materials
in agriculture. Formulated products are the ones in the production process.
that will actually be release in the environment,
24CHAPTER III - Methods and data
Calculation
3.1 Methods and Limitations reported values for sold, exported and imported
products by pesticide manufacturing companies
that hold pesticide registries. They do not imply
IBAMA´s annualized reports contained in this docu- that every amount of product sold was actually re-
ment present the total sums of active ingredients leased in the environment. Nevertheless, the data
commercialized in the country. It aggregates the does suggest an estimate of consumption in the
reports for the first period of 2009, delivered in various Brazilian regions. Several circumstances
july-2009, and the totals for the second period, de- may affect the demand for pesticides in a crop,
livered in January-2010. Despite the reports are and the purchased product may not come to be
delivered for each commercial brand, IBAMA has effectively used, may lose validity, or even be not
decided to aggregate data by active ingredient. In necessary, as an expected pest does not show
this way, commercial secrecy is preserved (law nº up. In a few cases, companies receive products
9279/1996) (BRASIL, 1996), without loss of rele- returned, which is why the reports bear negati-
vant environmental information. ve numbers of sales. The actual trading relations
To obtain the total amount of each active ingre- practiced between companies, suppliers, distribu-
dient sold, we calculated the amount reported tors and end consumers are more complex and
and divided by its known concentration of acti- diversified than the relations provided by the re-
ve ingredient. Also, for liquid form products, we port template available in Annex II of Article 41 of
considered the concentration informed while the Decree 4074/2002.
product was under evaluation. Then, each com-
mercial brand´s contribution was added, to obtain
3.2 Reports in Ibama´s Pesticide System in the
the totals for each Brazilian state.
year of 2009
The information supplied by industry is received in
good faith and assumed to be correct, according
to the stated law items in Article 69-A, from Law nº Over the year of 2009, 90 pesticide registering
9605, from 1998 (BRASIL, 1998), Article 82 from companies declared informations in IBAMA´s Elec-
Decree nº 6.514, from 2008 (BRASIL, 2008) and tronic System for Semiannual Reports. The image
Article 299 from the Brazilian Penal Code (BRA- below displays a map of registering, manufacturing
SIL, 1940). We stress that these values are the and formulating companies in Brazil (Figure 5).Pesticides and related products commercialized in Brazil in 2009 Figure 5 – Map of registering, manufacturing, commercializing and formulating companies in Brazil. 28
Instituto Brasileiro do Meio Ambiente e dos Recursos Naturais Renováveis

In the first half of 2009 there were reports                   383 brands lacking any report for the first
for 1,973 pesticide commercial brands. Of                      half of 2009.
these, 1,007 brands, among technical and
                                                               In the second half of 2009 there were declarations
formulated, were reported without any com-
                                                               of commercialization for 2,054 brands, in the Elec-
mercialization, either to industry or end user
(these are the two kinds of commercializa-                     tronic System. However, 346 brands were iden-
tion foreseen in Article 41). In this group, 22                tified as lacking reports. The brands reported as
zero sale brands showed positive values for                    non-commercialized (zero total sales) amounted
exportation. The Electronic System, up to                      to 1,014. 59 registering companies declared all
the writing of this document, showed also                      these brands. 16 brands were exported.

Figure 6 – Declarations available in the Electronic System for the year of 2009.

3.3 Data Consolidation                                         tinct evaluations. For this document, we opted to
                                                               sum up the total active ingredient consumption, re-
                                                               lated to information on usage classes, environmen-
The data presented in the commercialization reports            tal classification. The best resolution allowed by Ar-
might be consolidated in several ways, allowing dis-           ticle 41 are the states of the federation.

Figure 7 – Data consolidation scheme.

                                                                                                                  29
Pesticides and related products commercialized in Brazil in 2009
Below is a hypothetical example of data consoli- Company A, with brands Agro1 and Agro3. Com-
dation by active ingredient. pany B, with brands Agro5 and Agro7.
Suppose that IBAMA receives, in a given period, For simplicity, only the states SP (São Paulo) e
say first half of 2009, the following Semiannual MG (Minas Gerais) are included. In real life, each
Reports (solid products are given in tonnes and state represents one more amount to be included
liquid ones in liters): for each active ingredient.
Report for company A
Company A Active Ingredient IA Concentration Product Density SP MG
Agro1 Blue8 500 g/kg 100 t 130 t
Agro3 Green5 600 g/L 0.8 g/cm3 105 t 220 t
Report for company B
Company A Active Ingredient IA Concentration Product Density SP MG
Agro5 Blue8 200 g/kg 110 t 100 t
Agro7 Green5 500 g/L 0.8 g/cm3 105 t 120 t
In order to consolidate the data and generate a Green5 –
report, the calculation will be:
The brands based in Green5 are liquid, therefore
the reports have data in liters. Though the Electro-
nic System – following Article 41 – demands data
Blue8 –
in tonnes, we verified many companies reporting
Share from Cpn. A (brand Agro1), in SP: 100 x 0.5 data in thousands of liters – representing a ton.
(active ing. concentration) = 50 t Thus, it is necessary to perform some conver-
Share from Cpn. A (brand Agro1), in MG: 130 x 0.5 sions. In the case of brands where concentration
(active ing. concentration) = 65 t is given in “grams per Liter (g/L)”, the very unit
has a relation between mass and volume that allo-
Share from Cpn. B (brand Agro5), in SP: 110 x 0.2 ws for the calculation of mass, which is our goal.
(active ing. concentration) = 22 t Therefore, this unit is used directly. In a few pro-
Share from Cpn. B (brand Agro5), in MG: 100 x 0.2 ducts where the concentration unit is in milliliters
(active ing. concentration) = 20 t per Liter (ml/L), there is no mass involved. So it is
necessary to rely on the density of the technical
product to obtain a relation between the volume
Results: information received and the desired mass.
Blue8 sold in SP in the 1º half of 2009: 72 t Is it worth highlighting that in some cases com-
panies might have informed the liquid brands cor-
Blue8 sold in MG in the 1º half of 2009: 85 t
rectly. To identify a possible error margin on the
National Total in the 1º half of 2009 = 157 t results obtained, we calculated the average den-
30Instituto Brasileiro do Meio Ambiente e dos Recursos Naturais Renováveis
sity of every commercial brand reported in 2009. National Total in the 1º half of 2009 = 307.5 t
The result was 1.13g/cm3 with standard devia-
tion of 0.13. The possible error associated with
the results was not considered significant, in this An example of consolidation for a brand with
moment. concentration informed in ml/L, including den-
sity:
Brand Agro12, with Yellow1 active ingredient.
Share from Cpn. A (brand Agro3), in SP: 105 * 0.6
Density 0.9 g/cm3. Concentration: 400 ml/L.
(active ing. concentration) = 63 t
Sales in SP: 140 t.
Share from Cpn. A (brand Agro3), in MG: 220 *
0.6 (active ing. concentration) = 132 t
Share from Cpn. B (brand Agro7), in SP: 105* 0.5 Calculation:
(active ing. concentration) = 52,5 t 140 x 0.4 = 56
Share from Cpn. B (brand Agro7), in MG: 120 * 56 x 0.9 = 50.4t
0.5 (active ing. concentration) = 60 t
Results:
Results:
Total Yellow12 sold in SP: 50.4t.
Green5 sold in SP in the 1º half of 2009: 115.5 t
Results obtained by processing data will be pre-
Green5 sold in MG in the 1º half of 2009: 192 t sented in the next chapters.
31CHAPTER IV - Main Active
Ingredients Commercialized
in Brazil
4.1 Active Ingredients substances by taking only active ingredients in
account. Data processing identified the active
ingredients with the largest commercialization
Like said before, it is possible to estimate com- values, according to Figure 8. This figure takes
mercialization of pesticide and their related in account only reports for formulated products.
Figure 8 – The top ten active ingredients commercialized in Brazil in 2009. (tonnes)
These products´ sales are worth 76.45% the de Geografia e Estatística (IBGE), in relation
total amount for the whole country. These to the main crops in the year of 2008, it was
ingredients are authorized for various crops possible to identify these ingredients are au-
(specification for each crop will follow). Consi- thorized for use in at least one of these crops,
dering data supplied by the Instituto Brasileiro see Table 2.Pesticides and related products commercialized in Brazil in 2009
Table 2 – Relation Main Crops x 10 Active Ingredients.
CROPS
ACTIVE
Orange
INGREDIENT (IA) Sugarcane Soy Corn Cassava Rice
(citrus)
TOTAL Registered IA’s 63 131 106 8 110 89
1 Glyphosate and their salts Y Y Y N Y Y
2 Cypermethrin N Y Y N N Y
3 Mineral Oil N N N N Y N
4 Vegetable Oil N N N N Y N
5 Sulphur N Y Y N N N
6 2,4-D Y Y Y N N Y
7 Atrazin Y N Y N N N
8 Methamidophos N Y N N N N
9 Acephate N Y N N Y N
10 Carbendazim N Y N N Y N
Y = Yes/ N = No
SOURCE: Sistema de Agrotóxicos Fitossanitários - AGROFIT/ IA/CROPS, 2010
Therefore, what follows is a specific environmen- nana, cocoa, coffee, sugarcane, citrus, coconut,
tal analysis for each active ingredient. Information bean, eucalyptus and pinus forests, tobacco, ap-
presented below was based in technical reports ple, papaya, corn, nectarine, pastures, pear, pea-
for each substance, provided by IBAMA. ch, rubber tree, soy, wheat and grape) (MAPA,
2010). It belongs to the chemical group of the
phosphonoglycines and it is toxic for aquatic orga-
4.2 Glyphosate nisms, slightly toxic to soil organisms, birds and
bees and little bioaccumulative. The main environ-
mental concerns are high persistence and trans-
Glyphosate is a herbicide, registered for use in 26 portation. The technical grade products based on
crops (cotton, plum, rice, black oat, ryegrass, ba- glyphosate are classified in Class III.
Figure 9 – structural formula of glyphosate and 3D representation.
Considering data presented in the Semiannual In this universe, 1% is in Class IV, 6% is Class II
Reports for 2009, there was a total of 71 brands and 93% in Class III, according to distribution in
based on glyphosate, by 20 different companies. Graph , below.
34Instituto Brasileiro do Meio Ambiente e dos Recursos Naturais Renováveis
Figure 10 – Environmental Classification of formulated products based on glyphosate.
This active ingredient is the first ranked subs- herbicides. The map below displays glyphosate
tance in commercialization in Brazil, repre- commercialization in Brazil.
senting 76% of commercialization among the
Figure 11 – Spatialization of glyphosate sales per State.
35Pesticides and related products commercialized in Brazil in 2009
4.3 Cypermethrin the characteristics that may cause the greatest
environmental harm. Besides, this active ingre-
dient is highly persistent and highly bioaccu-
Cypermethrin is an insecticide registered for mulative. Cypermethrin is highly toxic to birds
use in 16 crops (cotton, peanuts, rice, potato, and highly transportable. Technical products ba-
coffee, onion, pea, beans, snap beans, tobac- sed on cypermethrin are classified as Class II.
co, watermelon, corn, cucumber, cabbage, soy- According to data for 2009, total 9 companies
bean and tomato) (MAPA, 2010), beside the reported sales from 13 commercial brands of
specific registry for ant control, is highly toxic formulated products, distributed among all the
for aquatic organisms and bees, and these are four classes, as follows.
Figure 12 – Environmental classification of formulated products based on cypermethrin.
Cypermethrin is ranked as the second pro- plays the commercialization of cyperme-
duct in sales in Brazil. The map below dis- thrin.
Figure 13 – Spatialization of cypermethrin sales by State.
36Instituto Brasileiro do Meio Ambiente e dos Recursos Naturais Renováveis
4.4 Mineral Oil oil is contained are adjuvant, insecticide, fungicide,
acaricide and spreader-sticker. It is considered hi-
ghly persistent and toxic to aquatic organisms. As
Mineral oil is considered the main substance in a rule, it is slightly toxic to non-target organisms,
the group of products related to pesticides. It is re- slightly transportable and slightly bioaccumulative.
gistered for use in 14 crops (avocado, banana, co-
coa, coffee, citrus, fig, jaboticaba fruit, apple, olive For the commercialization report of 2009, 12 com-
tree, pear, peach, roses, rubber tree and grapes) panies reported commercialization of 19 brands.
(MAPA, 2010), and is also registered as an adjuvant Products are distributed in the Classes II, III and
to other pesticides. The use types in which mineral IV as follows.
Figure 14 – Environmental classification of products based on mineral oil.
This active ingredient in ranked the third best sold in Brazil, according to the map below.
Figure 15 – Spatialization of mineral oil sales by State – 2009.
37Pesticides and related products commercialized in Brazil in 2009
4.5 Vegetable Oil active ingredient shows little toxicity to every
environmental parameter.
In 2009, 11 companies reported sales for 14
Vegetable oil is also one of the related substances
commercial brands. All products are Class IV.
to the pesticides, and it is registered for use in
citrus, besides the registry as an adjuvant to This active ingredient is ranked the fourth
other products. Vegetable oil can be an adjuvant, best sold in 2009. The map below shows the
insecticide, acaricide and spreader-sticker. This commercialization of vegetable oil in Brazil.
Figure 16 – Spatialization of vegetable oil sales by State – 2009.
4.6 Sulphur cucumber, pear, peach, pepper, okra, cabba-
ge, rose, soybean, tomato, wheat and grape)
(MAPA, 2010). It is highly persistent and affects
Sulphur, an inorganic substance active as an carbon and nitrogen cycling. However, for the
acaricide, insecticide and fungicide, is regis- remaining parameters, the active ingredient is
tered for use in 43 crops (avocado, pumpkin, generally little toxic.
squash, cotton, garlic, plum, potato, eggplant,
coffee, cashew, onion, citrus, coconut, cabba- In the semiannual report, 9 companies informed
ge, cauliflower, peas, beans, green beans, figs, the commercialization of 11 brands of formula-
guava, apple, papaya, castor bean, mango, quin- ted products. These products are distributed in
ce, melon, cantaloupe, corn, strawberry, radish, the environmental classes III and IV.
38Instituto Brasileiro do Meio Ambiente e dos Recursos Naturais Renováveis
Figure 17 – Environmental classification of products based on sulphur.
This active ingredient is ranked the fifth most consumed product in Brazil. The map below shows com-
mercialization of sulphur.
Figure 18 – Spatialization of sulphur commercialization for each Brazilian State – 2009.
39Pesticides and related products commercialized in Brazil in 2009
4.7 2,4-Dichlorophenoxyacetic acid sorghum and wheat) (MAPA, 2010). The technical
grade products based on this active ingredient are
normally classified as “Dangerous to the Environ-
The active ingredient 2,4-D belongs to the chemi- ment (Class III)”. This active ingredient is known
cal group of the Chlorophenoxy compounds and as highly transportable, highly persistent and very
is registered for use in 11 crops (rice, oat, coffee, toxic to aquatic organisms. It is slightly toxic to soil
sugarcane, rye, barley, corn, pastures, soybean, organisms, birds and bees.
Figure 19 – Structural formula of 2,4-D and 3D representation.
In the 2009 Semiannual Report, 9 companies in- mulated products, distributed in classes II and III,
formed the commercialization of 31 brands of for- according to the graph below.
Figure 20 – Environmental classification of products based on 2,4-D.
This herbicide active ingredient is ranked the sixth plays the distribution of 2,4-D commercialization
most consumed product in 2009. Figure 21 dis- in the Brazilian states.
40Instituto Brasileiro do Meio Ambiente e dos Recursos Naturais Renováveis
Figure 21 – Spatialization of 2,4-D sales by State.
4.8 Atrazine crops (pineapple, sugarcane, corn, pine, rubber tree,
sisal and sorghum) (MAPA, 2010). It is highly per-
sistent and highly toxic to birds and bees. It is also
Atrazine is an herbicide belonging to the chemical very toxic to aquatic organisms. The technical grade
group of the triazines, and is registered for use in 7 products based on atrazine are ranked Class II.
Figure 22 – Atrazine´s structural formula and 3D representation.
41Pesticides and related products commercialized in Brazil in 2009 In the 2009´s Semiannual Report, 10 registering 39 brands of formulated products, distributed in companies reported data for commercialization of the environmental classes I, II and II. Figure 23 – Environmental classification of products based on atrazine. This active ingredient with herbicide action shows the distribution of atrazine sales in the is ranked in the seventh position as the most Brazilian states. consumed product for 2009. The map below Figure 24 – Spatialization of atrazine sales for each Brazilian state. 42
Instituto Brasileiro do Meio Ambiente e dos Recursos Naturais Renováveis

4.9 Metamidophos                                              crops (cotton, peanuts, potato, beans, soybean, to-
                                                              mato and wheat) (MAPA, 2010). This active ingre-
                                                              dient is highly transportable, highly persistent, hi-
The active ingredient metamidophos is an insec-               ghly toxic to soil organisms and highly toxic to birds
ticide and acaricide, belonging to the group of the           and bees. The technical grade products based on
organophosphates, and is registered for use in 7              metamidophos are normally classified in Class II.

Figure 25 – Structural formula and 3D representation for metamidophos.

In the Semiannual Report for 2009, 5                          brands based on metamidophos, distributed
companies informed sales for 10 different                     in the environmental classes II and III.

Figure 26 – Environmental classification of products based on the active ingredient metamidophos.

This insecticide active ingredient is ranked in the           2009. The map below displays the commercializa-
eighth position as the most consumed product in               tion of metamidophos in the Brazilian states.

                                                                                                                 43
Pesticides and related products commercialized in Brazil in 2009
Figure 27 – Spatialization of metamidophos in the Brazilian states.
4.10 Acephate crops (cotton, peanuts, potato, broccoli, citrus, cabba-
ge and cauliflower, chrysanthemum, tobacco, melon,
pepper, red cabbage, roses, soy and tomato – and in
Acephate is an ogranophosphate used as an insec- the treatment of cotton and bean seeds intended for
ticide and acaricide, and is registered for use in 15 planting) (MAPA, 2010).
Figure 28 – Structural formula and 3D representation of acephate.
44Instituto Brasileiro do Meio Ambiente e dos Recursos Naturais Renováveis
This active ingredient is highly transportable and Seven companies reported the commercializa-
highly toxic to birds and bees. It is also little bio- tion of 9 brands based on acephate in the Se-
accumulative and toxic to aquatic organisms and miannual Report for 2009. These products are
little toxic to soil organisms. The technical grade distributed in the classes II and III, according to
products based on acephate are normally classi- Figure 29.
fied as class II.
Figure 29 – Environmental classification of products based on active ingredient acephate.
This active ingredient is ranked the ninth position the distribution of acephate´s commercialization
as the most consumed product. See Figure 30 for in the states.
Figure 30 – Spatialization of acephate´s commercialization in the Brazilian states.
45Pesticides and related products commercialized in Brazil in 2009
4.11 Carbendazim dazole carbamates, and is registered for use in
4 crops (citrus, beans, soy and wheat, besides
The active ingredient carbendazim is a fungi- application in seeds of cotton, beans and soy)
cide belonging to the chemical group benzimi- (MAPA, 2010).
Figure 31 – Structural formula and 3D representation of carbendazim.
This active ingredient is highly persistent, very toxic In the year 2009, 12 companies reported sales for
to aquatic organisms, toxic to birds and bees and little 24 products based on this active ingredient, distri-
bioaccumulative. The technical grade products based buted in the classes II and III (Figure 32)
on this active ingredient are classified in class III.
Figure 32 – Environmental classification of formulated products based on carbendazim.
Carbendazim is ranked in the tenth position, in 33 displays the sales for this active ingredient in
the top ten consumed products in 2009. Figure the Brazilian states.
46Instituto Brasileiro do Meio Ambiente e dos Recursos Naturais Renováveis
Figure 33 – Spatialization of sales for carbendazim in the Brazilian states - 2009.
47CHAPTER V - Use Types
5.1 Distribution Of Commercialization In The for nutrients and take advantage over, causing
Main Use Types agricultural losses.
Weed control is a very important practice to ob-
In the following pages, the data for use types tain high gains in every agricultural activity, and
will be presented, according to the Semiannual as old as agriculture itself (EMBRAPA, 2003).
Reports for 2009. In Brazil, the increase in pesticide use, specifi-
Figure 34 – Data for sales of pesticides based on their main usage classes.
5.2 Herbicides
cally herbicides, is due to the expansion of the
agricultural frontier and to the increase in land in
which direct planting is performed.
Herbicides are substances that avoid, reduce or
remove infesting plants (popularly known as “in- According to data declared by the registering
vasive weeds”). They are used for chemical con- companies in IBAMA´s Electronic System, the
trol of weeds that may compete with the crop active ingredients with herbicide action lead theYou can also read