Environmental drivers of body size evolution in crocodile-line archosaurs
←
→
Page content transcription
If your browser does not render page correctly, please read the page content below
ARTICLE
                  https://doi.org/10.1038/s42003-020-01561-5                OPEN

                  Environmental drivers of body size evolution in
                  crocodile-line archosaurs
                  Maximilian T. Stockdale1 ✉ & Michael J. Benton                        2
1234567890():,;

                  Ever since Darwin, biologists have debated the relative roles of external and internal drivers of
                  large-scale evolution. The distributions and ecology of living crocodilians are controlled
                  by environmental factors such as temperature. Crocodilians have a rich history, including
                  amphibious, marine and terrestrial forms spanning the past 247 Myr. It is uncertain whether
                  their evolution has been driven by extrinsic factors, such as climate change and mass
                  extinctions, or intrinsic factors like sexual selection and competition. Using a new phylogeny
                  of crocodilians and their relatives, we model evolutionary rates using phylogenetic com-
                  parative methods. We find that body size evolution follows a punctuated, variable rate model
                  of evolution, consistent with environmental drivers of evolution, with periods of stability
                  interrupted by periods of change. Regression analyses show warmer environmental tem-
                  peratures are associated with high evolutionary rates and large body sizes. We confirm that
                  environmental factors played a significant role in the evolution of crocodiles.

                  1 School of Geographical Sciences, University Road, Bristol BS8 1RL, United Kingdom. 2 School of Earth Sciences, Life Sciences Building, 24 Tyndall Avenue,

                  Bristol BS8 1TQ, United Kingdom. ✉email: max.stockdale@bristol.ac.uk

                  COMMUNICATIONS BIOLOGY | (2021)4:38 | https://doi.org/10.1038/s42003-020-01561-5 | www.nature.com/commsbio                                               1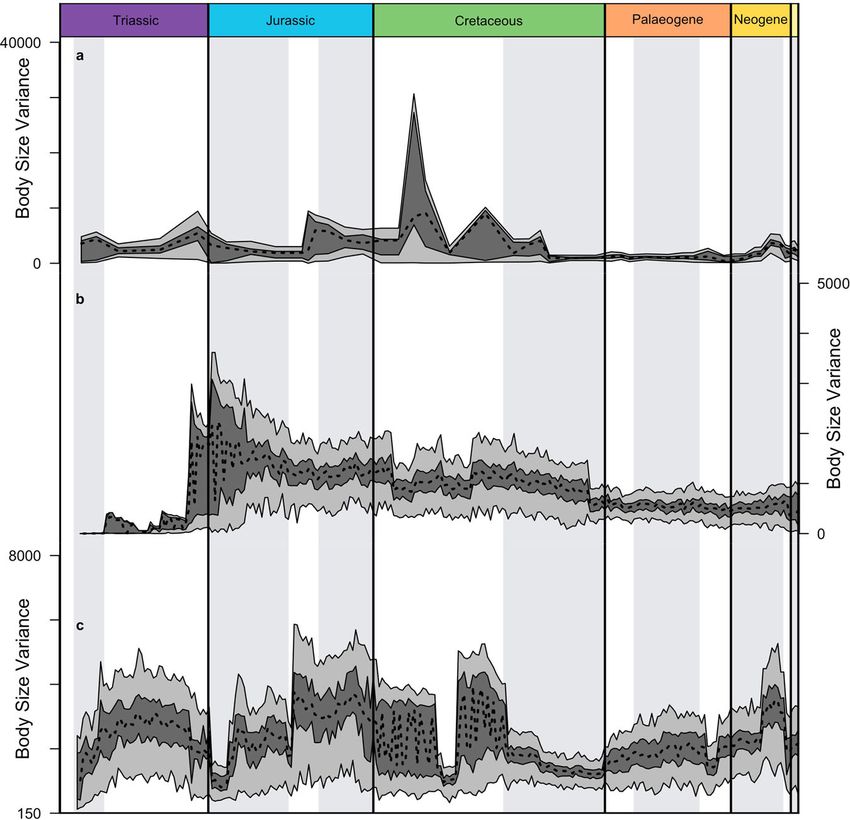
ARTICLE                                                              COMMUNICATIONS BIOLOGY | https://doi.org/10.1038/s42003-020-01561-5

C
        rocodiles might be interpreted as something of an ana-              cooling throughout the later Cenozoic. Recent work suggests that
        chronism. The modern crocodilian body plan has existed              crocodilian diversity depended on climate. The geographic range
        since the Early Jurassic, 200 Ma1, and yet their extant             of crocodilians is limited by environmental temperature because
diversity is only 24 species2. Other clades of similar antiquity,           of their ectothermic physiology25. One study identified a linear
such as dinosaurs (including birds)3 and lepidosaurs4, have each            relationship between diversity of crocodylomorphs and sea sur-
achieved a diversity of over 10,000 species in the same time                face temperature, but this relationship was not observed in the
interval5,6. The living Crocodylia are limited to amphibious                Thalattosuchia26. Another study27 identified a linear relationship
ambush predators, with an armoured, barrel-like body, sprawling             between loss of terrestrial crocodylomorph diversity and aridifi-
or semi-sprawling posture and a powerful tail2. However, they               cation of the climate. However, in this study amphibious taxa
have a rich fossil record that documents hundreds of species with           were placed among land-dwelling forms rather than comparable
diverse modes of life, and occupying a wide range of habitats and           aquatic forms, and a different classification might change the
geographical distribution7. Here, we explore crocodylian macro-             results.
evolution in the context of the wider clade to which they belong8,             Phylogenetic approaches to diversification identified dynamic
the Pseudosuchia, or Crurotarsi. This is the ‘crocodylian line’ of          evolution in pseudosuchian subtaxa28. The clade Pseudosuchia
archosaur evolution, which split from the ‘bird line’, including            includes major Triassic groups such as Phytosauria, Aetosauria,
dinosaurs, birds and pterosaurs, in the Early Triassic.                     Rauisuchidae and Poposauroidea, as well as the Crocodylomor-
   During the Mesozoic, the Pseudosuchia comprised a diverse                pha. Diversification rate shifts have been observed near the base
array of species, including derived marine and terrestrial forms,           of the Crocodyomorpha, Crocodyliformes and Neosuchia during
large armoured herbivores and cursorial hypercarnivores2. By                the Late Triassic and Early Jurassic28. Similar shifts are seen in the
contrast, extant crocodilians all share a similar body plan and an          Metriorhynchidae and Goniopholididae in the Early Cretaceous
amphibious mode of life. This loss of diversity and morphological           and in the Alligatoridae in the Paleocene. A recent analysis29 used
and functional disparity has suggested to some that the living              PCM to identify different regimes of body size evolution localised
crocodilians are ‘living fossils’9, a relict clade that has faded away      to subgroups within Crocodylomorpha. Differences from our
through geological time through declining evolutionary rates or a           results are discussed below in terms of methods and base phy-
failure to adapt. The term ‘living fossil’ has multiple definitions.         logenies, especially that the phylogenetic position of Tomistoma
One is that their lineage includes many Lazarus taxa representing           based on molecular phylogenetics30 was not incorporated into
gaps in the fossil record10. An alternative definition is bradytely11,       these previous studies.
namely a decline in rates of evolution; this may be an explanation             In this study we use a new species-level phylogeny and PCM to
for why crocodylians have faded from great biodiversity to rela-            investigate drivers of body size macroevolution in pseudosuchian
tively low species richness today. Herrera-Flores and colleagues12          archosaurs. We reconstruct evolutionary rates and derive a phy-
define a living fossil as a taxon that shows below-average evolu-            logenetic model of body size evolution in pseudosuchians. This
tionary rates and morphological conservatism, variables, together           phylogenetic model gives insights into the tempo and mode of
with bradytely, that can be tested using phylogenetic comparative           crocodile-line archosaur evolution through time, which is con-
methods (PCM).                                                              sidered in the context of the Red Queen and Court
   Simpson10 introduced the idea of a deep-time evolutionary                Jester hypotheses. Phylogenetic models are corroborated with
rate, which can be considered as phenotypic change per unit time.           time-series representations and linear models of body size against
PCM enable these rates to be modelled through the reconstruc-               an environmental variable. Together, these approaches identify
tion of ancestral states using a phylogenetic tree. PCM require             the respective roles that intrinsic biological and extrinsic envir-
character (trait) data in order to sample evolutionary change.              onmental factors had in driving the evolution of the
Body size is commonly used as a trait in these analyses13–16                Pseudosuchia.
because it determines aspects of physiology, population size,
resource consumption, geographic range, growth rates, life his-
tory, and reproductive success17–20, and can be measured in                 Results and discussion
fossils. There is a tendency in many clades for body size to                Evolutionary rates through phylogeny and through time. The
become larger through time, sometimes termed Cope’s Rule21,22.              phylogenetic tree (Fig. 1) shows reasonably uniform rates
Larger animals may be more vulnerable to extinction than smaller            throughout, except for seven species whose evolutionary rates are
ones, requiring more food and taking longer to reach sexual                 high, namely the phytosaur Angistorhinus, the basal crocodylo-
maturity21. However, the ubiquity of Cope’s Rule has been                   morph Carnufex, the notosuchian Razanandrongobe, the elo-
questioned21. Such an increase in body size may be a statistical            suchids Sarcosuchus and Terminonaris, the teleosaurid
artefact arising from increasing diversity, or it may represent a           Machimosaurus and the eusuchian Purussaurus. All of these are
passive change, rather than an active trend.                                large animals, and they mostly occur in the Mesozoic, except for
   The extent to which evolution is driven by intrinsic ecological          Purussaurus. The Bayesian analysis of body size shows that no
interactions or extrinsic environmental changes is a matter of              larger clades showed bursts of either small or large body size.
debate. The Red Queen hypothesis23 suggests that evolution is               Evolutionary rate shifts do not appear to be associated with
driven by intrinsic factors, such as competition, sexual selection,         specific phylogenetic groups. This contrasts with the findings of
parasitism and the arms race between predators and prey. The                previous studies, which showed that certain monophyletic clades
Court Jester hypothesis proposes that evolution is driven by                follow a distinct model of body size evolution29. This difference
environmental changes, such as long-term fluctuations in tem-                may be attributable to the choice of body size proxy. The previous
perature, atmospheric composition or sea level, or episodic shock           analysis made use of skull length as a body size proxy29, but this is
changes caused by massive volcanism, bolide impacts and plate               dependent on overall skull shape; there are short-snouted and
tectonics24.                                                                long-snouted crocodilians, and so a single skull length might
   Environmental change is of particular relevance to the Pseu-             correspond to animals whose body lengths differ by a factor of
dosuchia. Since the Late Triassic, the Pseudosuchia have survived           two and whose body masses differ by as much as an order of
multiple dramatic environmental shifts coinciding with the end-             magnitude. Therefore the results of this previous analysis29 might
Triassic and end-Cretaceous mass extinctions2,8, the Paleocene-             be driven by the phylogenetic signal of skull shape, rather than a
Eocene Thermal Maximum, the end-Eocene extinction event, and                change in the tempo and mode of body size evolution.

2                         COMMUNICATIONS BIOLOGY | (2021)4:38 | https://doi.org/10.1038/s42003-020-01561-5 | www.nature.com/commsbio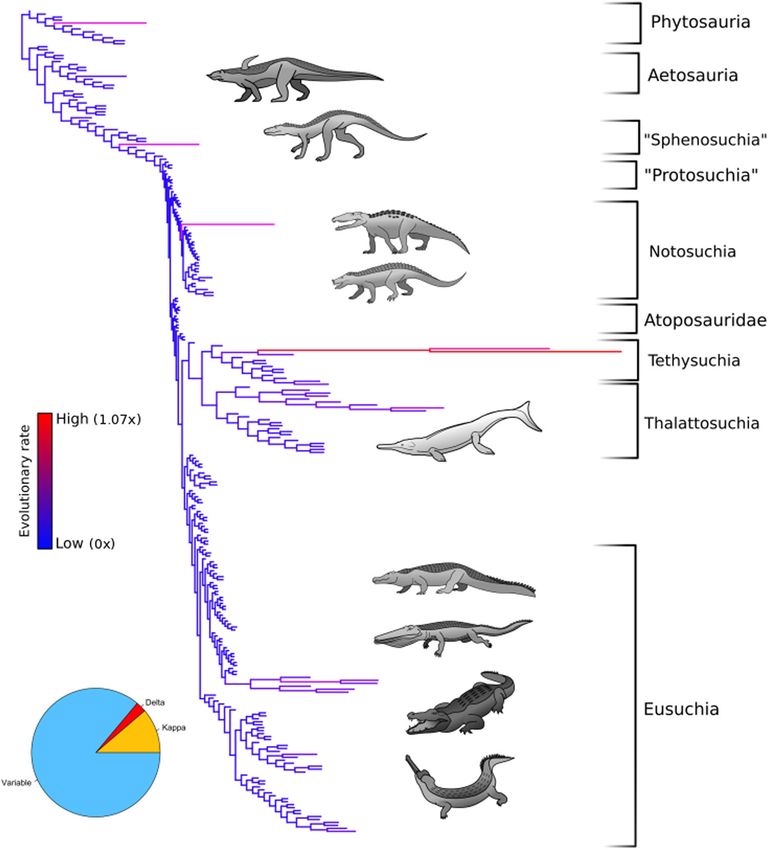
COMMUNICATIONS BIOLOGY | https://doi.org/10.1038/s42003-020-01561-5                                                                        ARTICLE

Fig. 1 Rates of body size evolution in the Pseudosuchia. Phylogeny of the Pseudosuchia with branch lengths set to indicate evolutionary rate. Long
branches, shown in red, indicate high evolutionary rate. Short branches in blue indicate lower evolutionary rates. The rate scalars were output by a variable
rate phylogenetic model implemented using BayesTraits.

   When plotted against geological time, the time series of mean                fossils are described as taxa that have shown a decline, and
evolutionary rates (Fig. 2) shows a stepped pattern, with long                  eventual stagnation, of their evolutionary rates. The study of
episodes of unchanging rates broken periodically by very rapid                  evolutionary rates provides no justification to describe extant
changes. Rates are high throughout the Triassic, but they decline               crocodilians as bradytelic, since evolutionary rates of extant
through this period, levelling out through the Early Jurassic, and              species are shown to be neither low nor decreasing (Figs. 1, 2). A
stepping down to lower rates in the Middle and Late Jurassic, and               further definition of living fossils is that they show low evolu-
reaching their lowest value in the Early Cretaceous. These low                  tionary rates combined with morphological conservatism12. It is
values continue into the Paleogene, but with increased spikiness                true that the body size disparity of extant crocodilians is relatively
of the upper error limit through Late Cretaceous and Paleogene.                 low (Fig. 3), irrespective of which method is used to reconstruct
Across the Cretaceous–Paleogene boundary, the instability of                    the time-series. However, as noted above, the evolutionary rate of
rates increases, but the mean rate remains constant. Rates step up              the crocodilians is surprisingly high, particularly in the Neogene
sharply during the Eocene, and retain steady higher values,                     (Fig. 2).
similar to those of the Middle Triassic, through the Oligocene and
Neogene.                                                                        Relative body size through time. The fossil record is assumed to
                                                                                be highly incomplete, and subject to significant preservation bias.
Crocodiles are not ‘living fossils’. Contrary to previous pub-                  In order to take these biases into account, our analysis employed
lications9, we do not find any evidence that living crocodilians are             three different approaches to reconstructing time series of body
living fossils. One definition of a living fossil is as a ‘Lazarus               size and disparity. This included an empirical approach, which
taxon’, meaning that extant examples exist despite a prolonged                  assumes the fossil record is representative of the true pattern, and
absence from the fossil record, for example the coelacanth Lati-                two derived methods using the phylogenetic tree to infer missing
meria. The crocodilians cannot be described as Lazarus taxa, since              taxa (see “Methods” section). These three methods give differing
fossil members are known throughout the Mesozoic and Cen-                       results (Figs. 3, 4). The empirical time series (Fig. 4a) shows
ozoic eras. Bradytely is an alternative definition11, in which living            constant change in relative body size, with rapid switches from

COMMUNICATIONS BIOLOGY | (2021)4:38 | https://doi.org/10.1038/s42003-020-01561-5 | www.nature.com/commsbio                                                 3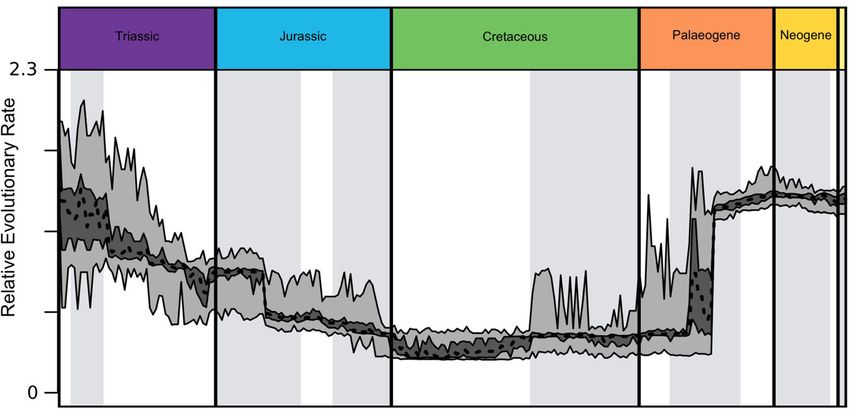
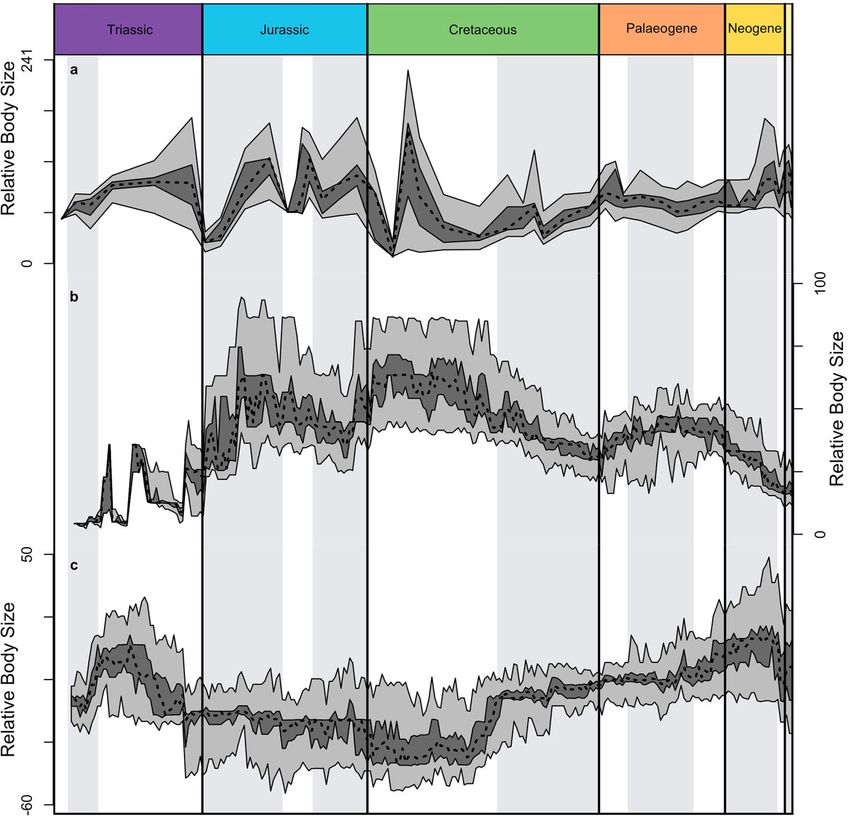
ARTICLE                                                                  COMMUNICATIONS BIOLOGY | https://doi.org/10.1038/s42003-020-01561-5

Fig. 2 Time-series representation of evolutionary rates. Rate values were output by a variable rate phylogenetic model implemented using BayesTraits.
The taxa included in each 1-million-year interval are denoted using a phylogenetic tree, dated using using first and last appearance dates. The taxa sampled
in each 1-million-year interval were bootstrapped. Each bootstrap corresponded to a random 50% sample of the data in each bin, repeated 100 times. The
interquartile range is shown in dark grey, the total range in light grey.

Fig. 3 Time-series representations of relative body size variance. Three approaches are shown, as in Fig. 4: (a) actual taxa binned at the resolution of
stratigraphic stages; (b) actual taxa plus ghost ranges inferred using branch lengths; (c) actual taxa plus ghost ranges plus phylogenetically reconstructed
body size values of inferred common ancestors. The taxa sampled across all methods were subjected to bootstrapping; the interquartile range is shown in
dark grey, the total range in light grey.

positive to negative and back again, but a seemingly similar base              variance (Fig. 3b) shows low values in most of the Triassic, with
level throughout. Empirical body size variance (Fig. 3a) is rela-              the maximum value rising sharply in the Late Triassic, and then
tively steady, but with a sharp high value in the Early Cretaceous.            the range of variance narrowing from a widest range in the Early
   The time series with ghost ranges (Fig. 4b) has a generally                 Jurassic through to the present day, while mean values fall
smoother profile and follows sweeping curves, with rising values                gradually through the same time interval.
through Triassic and Jurassic, constant in the Early Cretaceous,                 The time series with ghost ranges and ancestral taxa (Fig. 4c)
and falling through the Late Cretaceous, rising slightly in the                shows the opposite pattern, with body size values falling from
Paleogene, and falling again in the Neogene. The distribution of               Triassic highs to steady low values through the Jurassic and Early

4                            COMMUNICATIONS BIOLOGY | (2021)4:38 | https://doi.org/10.1038/s42003-020-01561-5 | www.nature.com/commsbio
COMMUNICATIONS BIOLOGY | https://doi.org/10.1038/s42003-020-01561-5                                                                    ARTICLE

Fig. 4 Time-series representations of mean relative body size. Three approaches are shown: (a) actual taxa binned at the resolution of stratigraphic
stages; (b) actual taxa plus ghost ranges inferred using branch lengths; (c) actual taxa plus ghost ranges plus phylogenetically reconstructed body size
values of inferred common ancestors. Random 50% bootstrap samples were drawn over 100 iterations. The interquartile range of these iterations is shown
in dark grey, the total range in light grey.

Cretaceous, and then stepping up at the beginning of the Late                  including ghost ranges and common ancestors (Figs. 3c, 4c) show
Cretaceous, and then rising slowly through the Palaeogene and                  some smoothing of the curves, which might reflect the plugging
early Neogene, before falling in the Pliocene and Pleistocene.                 of some gaps in the fossil record by inferred data.
   The substantial difference between the three time-series can be
attributed to the amount of missing taxa. The patterns of change
in body size seen in the empirical time-series are evidently driven            Evolutionary model fitting. All the fitted phylogenetic models
in large part by the quality of the fossil record. This may arise              achieve a uniform likelihood distribution (Supplementary
from the relative preservation potential of small and large                    Data 1), indicating that they reached convergence. The variable
specimens, periods of erosion and the occurrence of fossil                     rate model, the kappa model and the delta model all significantly
lagerstätten. Inferring taxa in a given time-bin using phylogeny               outperformed the random walk according to their Bayes factors,
may adjust for taxa missing from the fossil record. The difference             but the directional trend, lambda and Ornstein–Uhlenbeck
between the two phylogenetically adjusted time-series indicates                models did not (Table 1).
that the absence of common ancestors from the fossil record is a                  Phylogenetically adjusted mean body size α differs between
further driver of the empirical pattern, in addition to known taxa             each of the models fitted (Table 1). A weighted mean of the α-
that are missing from parts of their temporal range.                           values returned by the kappa, delta and variable rates models
   The distribution of variance (Fig. 3c) shows reasonably steady              finds a PC-1 value of −14.108. This corresponds to an estimated
mean values throughout, but with some steps in the Middle                      skull width of approximately 15 cm. The arithmetic mean of PC-1
Jurassic, Palaeogene and Neogene, and considerable instability                 gives a PC-1 value of 0.782, corresponding to a skull width of
through the Cretaceous. Maximum values fluctuate substantially,                 approximately 18 cm.
with highs through much of the Mesozoic, except for lows after                    We note that skull width alone would not be suitable as a body
the end-Triassic mass extinction and in the Early Cretaceous, and              size metric, because there is considerable diversity of relative head
with lows generally through most of the Late Cretaceous,                       sizes among the Pseudosuchia. However, the skull widths
Palaeogene and Neogene.                                                        predicted by the arithmetic mean of PC-1 scores and the
   A key question concerning plots of this kind is whether they                phylogenetically adjusted α-values returned by the phylogenetic
document reality or heterogeneity of sampling. We can address                  models do provide interesting insights. As noted, the arithmetic
this conundrum to some extent by comparing the three plots in                  mean of PC-1 values corresponds to a skull width 3 cm wider
Figs. 3, 4. For example, the time series without ghost ranges or               than the phylogenetically adjusted estimate. This suggests that the
common ancestors (Figs. 3a, 4a) are in a state of constant change,             distribution of trait data is skewed towards larger specimens. Bias
with the direction of that change shifting frequently. On the other            towards greater size is not surprising in fossil data, since larger
hand, the time series including ghost ranges (Figs. 3b, 4b) and                specimens tend to be more resistant to decay and erosion.

COMMUNICATIONS BIOLOGY | (2021)4:38 | https://doi.org/10.1038/s42003-020-01561-5 | www.nature.com/commsbio                                            5
ARTICLE                                                              COMMUNICATIONS BIOLOGY | https://doi.org/10.1038/s42003-020-01561-5

 Table 1 Output parameters from each of the phylogenetic models implemented in BayesTraits.

 Model                        Log Bayes factor compared with random walk                  σ2                  α                    Statistic
 Random walk                  N/A                                                         43.095              −11.705              N/A
 Lambda                       −3.337                                                      43.184              −11.561              λ = 0.978
 Delta                        5.183                                                       41.803              −11.823              δ = 0.735
 Kappa                        22.200                                                      33.156              −14.337              κ = 0.395
 Variable rates               169.658                                                     41.285              −14.148              No. of rates = 30.5
 Ornstein–Uhlenbeck           −3.996                                                      44.002              −11.869              OU = 0.000173
 Directional trend            −1.009                                                      43.252              −12.064              β = 0.0151

Including phylogenetically reconstructed common ancestors may               regime that was distinct from that of most other Pseudosuchia,
help to mitigate this issue in the context of time-series                   which occupied terrestrial or freshwater habitats. Evolutionary
reconstructions of trait values.                                            rates of internal branches within these clades are relatively high,
   We find that pseudosuchian body size is not constrained near              more so than the majority of other neosuchian clades. This may
an optimum value, because the Ornstein–Uhlenbeck (OU) model                 support the idea of the radiation of Thalattosuchia into vacant
of body size evolution does not perform significantly better than a          marine niches39. Other aspects of thalattosuchian biology have
random walk (Table 1). Concerns have been raised about the                  also attracted controversy; Young and colleagues40 speculated
susceptibly of the OU model to false positive results, being                that the metriorhynchid Thalattosuchia might have been
difficult to distinguish from the random walk model31,32. The                viviparous, based on the width of the pelvic girdle. Adopting
recommendation31,32 is that OU models should only be fitted to               viviparity could have freed the metriorhynchids from the
samples of 200 or more observations, and only using Bayesian                limitations of laying eggs on land, enabling them to develop a
methods. Here, we satisfy both of these criteria, and the OU                more hydrodynamic body plan. Martin and colleagues26 found
model is not selected as a likely explanation. We cannot say that           the diversity of thalattosuchians to be incongruent with sea
stabilising selection has not taken place at any point during the           surface temperature, unlike other crocodylomorph groups. These
course of pseudosuchian body size evolution, but it is not the best         authors proposed that the Thalattosuchia maintained a higher
explanation for the whole trajectory. These findings conflict with            rate of metabolism than other clades. While viviparity and
a recent study29, in which an OU model was the best supported,              endothermy among thalattosuchians remains speculative, the
but was particularly applicable to certain groups. Further, this            interaction between physiology, reproductive strategies and
previous analysis29 implemented the SURFACE model, which                    evolutionary rates would be an interesting line of future research.
appears to suffer from high rates of false positives33.
   In our study, the lambda model fails to perform significantly
                                                                            Cope’s rule and the Pseudosuchia. These plots show little evi-
better than a random walk (Table 1). The lambda model
                                                                            dence for Cope’s rule. The time series of body size through time
attributes trait variation to phylogeny, and cursory observation
                                                                            do not show an overall increase regardless of which reconstruc-
shows that most clades comprise a mixture of large and small
                                                                            tion method is used (Fig. 4). The empirical time series (Fig. 4a)
species. For example, the Crocodylidae includes the relatively
                                                                            shows no net size change through the entire span of crocodilian
small Osteolaemus tetraspis and the giant Crocodylus thorbjar-
                                                                            evolution, that with ghost ranges (Fig. 4b) suggests a continual
narsoni. Similarly, the phylogenetically distant Notosuchia
                                                                            decrease in body size since the Early Cretaceous, and that with
includes small genera such as Araripesuchus and much larger
                                                                            ghost ranges and common ancestors (Fig. 4c) shows a long
animals like Razanandrongobe. Therefore, changes in body size
                                                                            decline in mean body size for 100 Myr, and then a step up to a
take place independently of phylogeny.
                                                                            slightly increasing trend through the Late Cretaceous and Cen-
   Earlier work34,35 has shown that the Pseudosuchia diversified
                                                                            ozoic. This is clearly a limited episode of body size change, rather
rapidly during the Triassic. We corroborate these findings,
                                                                            than an on-going trend. Among the fitted phylogenetic models,
especially by identifying that the delta model fits significantly
                                                                            there is no support for the directional trend model compared to a
better than a random walk (Table 1). A delta value of less than 1,
                                                                            random walk (Table 1). Therefore, a directional shift in pseu-
as found here (0.74), indicates that phenotypic change is
                                                                            dosuchian body size cannot be justified, either from small-bodied
concentrated at the start of a phylogenetic tree branch36. We
                                                                            to large-bodied forms, as proposed by Cope’s rule, or vice versa.
find an increase in pseudosuchian mean body size during the
                                                                            We identify equal numbers of shorter-term episodes of increasing
Triassic, but differing according to the input data, either rising
                                                                            and decreasing mean body size, and there is no evidence for
irregularly through the Triassic (Fig. 4b), or rising in the Early
                                                                            Cope’s Rule through pseudosuchian history.
and early Middle Triassic before levelling (Fig. 4a) or falling
                                                                               There are some conceptual issues around Cope’s rule, since the
(Fig. 4b) in the Late Triassic. Similar to body size, the time series
                                                                            definition of any clade is arbitrary. Increases in body size may be
including ghost ranges and common ancestors shows the greatest
                                                                            attributable to other mechanisms, for example selection by external
agreement with the delta model (Fig. 4c).
                                                                            drivers. Alternatively, maximum body size may increase passively
   The evolutionary rate increase associated with the Middle
                                                                            through an increase in diversity over time;13 in such cases,
Jurassic notosuchian Razanandrongobe is exceptional, especially
                                                                            minimum and average body size need not increase if there is a
when compared to the relatively low evolutionary rates observed
                                                                            corresponding rise in numbers of small-bodied taxa. Therefore, the
among other notosuchians. Razanandrongobe has been described
                                                                            periods of increasing average body size shown in the time-series
as an island-dweller, with a fossil range coinciding with the
                                                                            suggest an episodic external driver of body size, rather than a
separation of Madagascar from mainland Africa37. Increased
                                                                            passive increase. Maximum body size may have increased passively
evolutionary rate among island species is well documented38.
                                                                            during periods when average body size was stable.
Perhaps Razanandrongobe is an example of island gigantism, and
its size not representative of Jurassic notosuchians in general.
   It is apparent from the variable rate model that the marine              Punctuated model of evolution. We have found multiple lines of
Thalattosuchia and Tethysuchia experienced an evolutionary                  evidence that pseudosuchians followed a punctuated mode of

6                         COMMUNICATIONS BIOLOGY | (2021)4:38 | https://doi.org/10.1038/s42003-020-01561-5 | www.nature.com/commsbio
COMMUNICATIONS BIOLOGY | https://doi.org/10.1038/s42003-020-01561-5 ARTICLE
body size evolution rather than a gradual one. By far the best Table 2 Outputs of linear regression models comparing
supported of the phylogenetic models fitted is the variable rate isotope temperature proxies with three body size variables.
model. The evolutionary rate scalars returned by this model
indicate that the Pseudosuchia have a stable background rate of
Dependent variable Slope R2 p-Value
body size evolution which is interrupted by short periods of
Cenozoic Mean body size −1.76 0.553 2.076 × 10⁻¹¹
higher evolutionary rates (Figs. 1, 2), and the highest rates are Body size variance −70.76 0.258 3.293 × 10⁻⁵
observed in individual species rather than larger branches. The Mean evolutionary rate −0.105 0.686 1.19 × 10⁻¹⁵
kappa model does not perform, as well as the variable rate model, Mesozoic Mean body size −0.0416 0.206 5.77 × 10⁻⁹
Body size variance 0.000238 0.0302 0.0205
but it performs significantly better than a random walk (Table 1). Mean evolutionary rate −2.018 0.156 5.44 × 10⁻⁷
This corroborates a punctuated rather than gradual mode of body
size evolution. The kappa model fitted in this analysis returned a
kappa statistic of 0.4. Kappa values of less than 0.5 indicate a
punctuated model of evolution36, with changes in trait values shifts not visible from mean body size (Fig. 4c). A sharp drop in
being associated with cladogenesis. Higher kappa values indicate disparity is observed in the Carnian, at the Jurassic-Cretaceous
gradual evolution, or anagenesis. However, a kappa value of more boundary, at the Early-Late Cretaceous boundary, and after the
than zero does not exclude a gradual component entirely. While end-Eocene extinction event. A second substantial drop in
this analysis suggests that the majority of variation has arisen disparity is seen at the Triassic-Jurassic boundary, matching
through a punctuated model, it is possible that gradual change one of the most severe of all mass extinction events. There is also
might have driven body size variation to a limited extent. a modest increase in body size disparity following the
The time-series representations of body size vary in how Cretaceous–Palaeogene extinction event. These patterns in
closely they concur with a punctuated model (Fig. 4). The disparity further indicate that mass extinctions were a major
empirical time series seems to be in a state of permanent influence on body size evolution. Changes in disparity also
transition, with successive, rapid shifts between body sizes coincide with other significant events. There is an increase in
(Fig. 4a), while the time series curve with ghost ranges shows a disparity at the start of Miocene climate optimum, and a steep
smoother topology (Fig. 4c). Body size shifts in the empirical time drop in disparity at the end of the Miocene climate optimum.
series may be attributable to variation in the fossil record. The The Neogene fossil record, from 23 Ma to the present, shows
time series including ghost ranges and inferred common evidence for interactions between temperature and body size. The size
ancestors concurs more closely with the phylogenetic models, transitions, whether up (Fig. 4a, c) or down (Fig. 4b), appear to be
with long periods of stability throughout the Jurassic, in the Early gradual and they are associated with the Miocene Climate optimum.
Cretaceous, and through the Late Cretaceous to the Linear regression analyses of both body size and evolutionary
Eocene–Oligocene boundary. These periods of stability are rate with paleotemperature proxy data find a significant negative
separated by discrete events where body size increases or correlation (Table 2). The oxygen isotope paleotemperature
decreases sharply (Fig. 4c). scheme scales inversely with temperature29, therefore larger body
The time series of body size disparity show similar patterns to sizes and higher evolutionary rates are associated with warmer
that of mean body size (Fig. 3). Without ghost ranges or inferred temperatures. A direct relationship between temperature and
common ancestors, body size disparity changes constantly body size would suggest that during warm periods crocodiles
between high and low values (Fig. 3a), but is fairly constant would be able to invest more resources into growth. Perhaps high
from the Late Cretaceous to mid-Miocene. The disparity time temperatures enabled individuals to remain active for longer, and
series with ghost ranges (Fig. 3b) is relatively smooth but therefore able to spend a greater fraction of their time feeding.
punctuated by some small shifts during the Cretaceous. Disparity Warmer temperatures would be expected to increase the ecospace
with both ghost ranges and common ancestors (Fig. 3c) also has a available to crocodiles and their relatives. Therefore, increased
stepwise topology, but periods of stability are shorter and shifts in evolutionary rates during warm periods may reflect the radiation
disparity are larger. of taxa into new ecological niches.
Linear regression analyses of body size, disparity, evolutionary
rate and temperature in the Cenozoic recover a significant
Environmental drivers of crocodilian evolution. A punctuated negative correlation (Table 2). The regression is weakest between
model of body size evolution suggests that extrinsic environ- temperature and variance, with an R-squared of just 0.25. The
mental factors were the principal drivers, as predicted by the regression with body size is somewhat stronger, with an R-
Court Jester hypothesis. Such changes might include mass squared of 0.55. The best performing regression model is
extinctions, climate shifts or sea level changes. Some of the jumps temperature with evolutionary rate, which achieves an r-
in mean body size correspond to identified events in Earth his- squared of 0.69. Similar analyses of Mesozoic temperature also
tory. For example, the downshift in relative body size in the Late recover significant negative correlations for body size and
Triassic at about 232 Ma (Fig. 4b, c) could correspond to the evolutionary rate. However, the strength of the correlation is
Carnian Pluvial Episode, but the empirical curve (Fig. 4a) shows a markedly lower, with R-squared values of 0.21 and 0.16,
later drop in mean size. Two of the plots (Fig. 4a, b) show sharp respectively (Table 2). Body size disparity and Mesozoic
shifts in mean body size across the Jurassic-Cretaceous boundary, temperature show a positive correlation, but the strength of the
a putative extinction event39, but this is not shown in the plot correlation is negligible, and the p-value is only barely significant
with ghost ranges and common ancestors (Fig. 4c), so some of the at 0.02. A low or modest R-squared value indicates that while
evidence for the event might be artificial. Surprisingly the there is a clear relationship between temperature and evolu-
Cretaceous-Palaeogene boundary does not appear to be asso- tionary rate, temperature alone is not a comprehensive predictor
ciated with any changes in mean body size. In all cases, even with of evolutionary rate, body size or disparity. Therefore there is
ghost ranges reconstructed, we may miss earlier unpreserved plenty of scope for other environmental variables, as well as
portions of the records of lineages40. intrinsic biological factors, to influence evolutionary rates.
The time series of disparity including ghost ranges and However, there is an apparent association between temperature
estimated common ancestors shows disparity changes at many and the majority of variation in evolutionary rates. The strength
of the same points (Fig. 3c). This time series identifies additional of correlation may also be influenced by biogeography. The
COMMUNICATIONS BIOLOGY | (2021)4:38 | https://doi.org/10.1038/s42003-020-01561-5 | www.nature.com/commsbio 7ARTICLE COMMUNICATIONS BIOLOGY | https://doi.org/10.1038/s42003-020-01561-5
time-series used in this analysis represents global averages, and
does not account for regional variation in body size or
temperature. Perhaps body size regimes varied between pseudo-
suchians in equatorial regions and cooler regions at higher
latitudes.
The correlation of body size and evolutionary rate with
temperature is considerably weaker in the Mesozoic than in the
Cenozoic, perhaps because global temperatures were warmer and
more stable in the Mesozoic41. Nevertheless, the correlation for
both time intervals is negative, supporting a common mechanism
throughout pseudosuchian history. This is in line with other
published analyses that have indicated a relationship between the
evolution of Mesozoic crocodile-line archosaurs and climate25–27.
The analyses presented in this study suggest extrinsic environ-
mental factors played a significant role in driving the body size
evolution of pseudosuchians. The phylogenetic models indicate that
evolutionary rates have an uneven tempo, characterised by overall
relative stasis punctuated by short periods of change. This is the
model predicted by the Court Jester hypothesis, where evolution is
driven by environmental changes24. Linear models of both body
size and evolutionary rate corroborate this conclusion, showing a
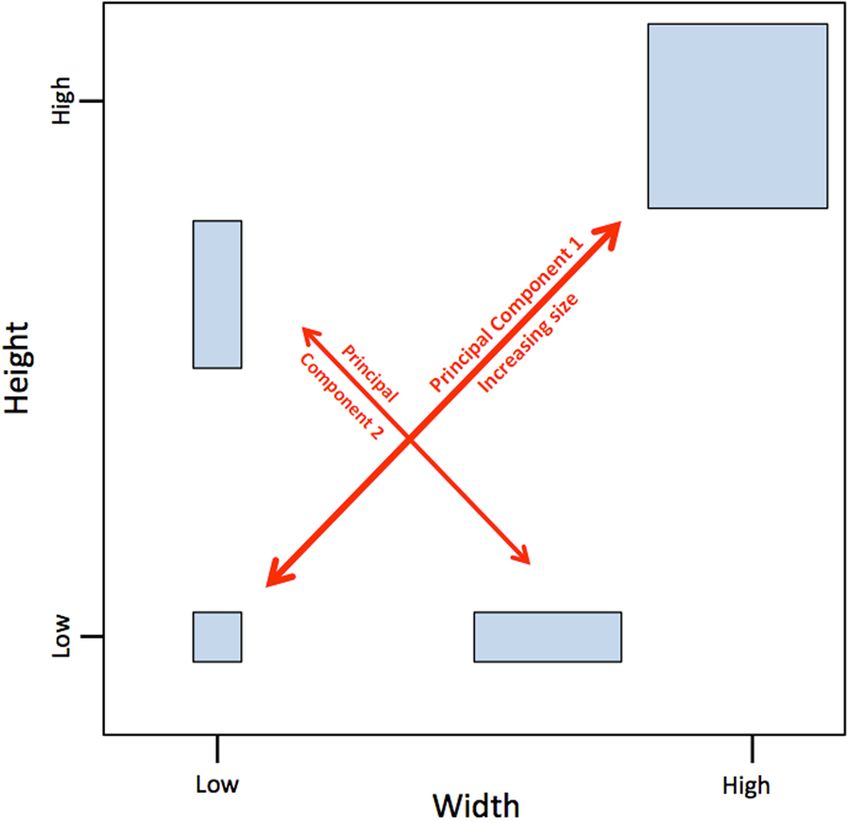
significant relationship with global temperature. Global temperature Fig. 5 A simplified demonstration of how size can drive covariance
may not be the only driving factor, and there is plenty of scope for between two characters. In this two-dimensional example, relative size is
other factors to also play a role, including other environmental indicated by the position of points along the trend line, which corresponds
variables. Body size and disparity in crocodile-line archosaurs show to the first axis returned by principal components analysis. Variations in
changes associated with major events in Earth’s history, notably shape are indicated by position on the orthogonal second component. A
mass extinctions. Therefore, other major environmental shifts are positive correlation between traits may be driven by factors other than size,
likely to have played a significant role in pseudosuchian evolution. therefore this study uses 21 characters, rather than just two.
Methods accounting for a decreasing fraction of variance. These axes are derived through
Body size metrics. The masses of fragmentary fossilised remains are clearly not correlation tests of each variable with each other variable. Strong correlations
representative of the body mass of the animal in life. Body mass of fossil taxa is contribute more substantially to a principal component axis than a weak
often represented in analyses by a linear metric that is considered to correlate with correlation. The positions of the first two principal components in a bivariate
overall body size13,14. We could not determine full body length or snout-vent context are shown on Fig. 5. Principal components analysis commonly uses
length in many fossil pseudosuchians because most lack complete skeletons. Skull log-transformed data47 to standardise measurements and limit the effects of body
length has been shown to be an indicator of body size in dinosaurs41. Skull length size on interpretations of allometry. However, it has been observed that log
has been used in a recent study of crocodilian macroevolution29. These authors29 transformations are not universally appropriate48, and in this study it is isometry,
provided a linear regression of total skull length with total body length, but of the not allometry, that is of interest. Therefore standardising the data through log-
six taxa in their plot, the large-bodied examples are long-snouted, and the small- transformation would be detrimental in this case. The approach of using principal
bodied examples are short-snouted. This is not a representative sample, since long- components analysis to estimate relative body size has been applied in previous
snouted and short-snouted forms are known across a range of body sizes; for examples including birds49, bats50, rodents51, and insects52.
example, a highly elongated snout is observed in both the modest-sized Isisfordia The dataset was assembled from the literature. Peer-reviewed articles featuring
duncani42 and the giant Sarcosuchus imperator43. Likewise a short-snouted mor- images of fossil specimens were sampled and measured using ImageJ53. Up to 21
phology occurs in the small-bodied Shamosuchus djadochtaensis44 and the characters were measured from each specimen, depending on their completeness
exceptionally large Razanandrongobe sakalavae37. Therefore, this regression does (Supplementary Data 1). These included cranial, mandibular, humeral and femoral
not address the possibility that skull length may over-estimate body size in long- characters, selected to encompass the greatest diversity of body shape possible,
snouted taxa, and under-estimate it in short-snouted taxa. It is difficult to deter- without introducing an excessive amount of missing data. All the measurements
mine whether the patterns observed29 truly reflect the evolution of body size, or were collected in centimetres. A non-parametric Spearman-rank correlation test
whether this pattern has been driven by the evolution of skull aspect ratios. An was performed between all variables, and confirmed many positive correlations
alternative measure, skull width, avoids contrasts of long-snouted and short- indicating positive covariance within the data (Supplementary Data 1). This
snouted forms, but would underestimate body size in small-headed forms such as covariance is likely to be driven by body size, because the variation within the data
aetosaurs. is extremely large. For example, skull width in the smallest and largest taxa differs
The diameters of long bones have been used in body size studies in by an order of magnitude. Therefore these data are suitable for body size estimation
dinosaurs14,15. However, limb elements of pseudosuchians are not so abundant in using principal components analysis.
the fossil record as skulls (Supplementary Data 1). Further, although the The raw data were, necessarily, highly incomplete. The PCA was implemented
dimensions of a load-bearing skeletal element such as the femur or humerus are with iterative imputation using PAST version 3.1 for Mac OS54. An advantage of
proportional to that load, non-avian dinosaurs were entirely terrestrial, with an this approach is that it is not limited by variable preservation of any single
exclusively erect gait. This is not true of the Pseudosuchia, in which some forms character. A dataset limited to only complete specimens would be vanishingly
showed a sprawling or semi-erect gait2, and several clades of crocodylomorphs small, and unrepresentative of the clade as a whole. Likewise, using a single
were partly or entirely aquatic2. These issues mean that femur length or diameter, character as a body size proxy would limit the dataset to those specimens with that
for example, would not provide a reliable estimate of body mass or length across character preserved. This may introduce preservation bias, since the probability of
all taxa. preservation may vary between skeletal elements. Using iterative PCA enables
The body size proxy used in this analysis is the score of each taxon on the first relative body size to be estimated from multiple characters. If a given character is
component axis of a principal components analysis of 21 traits (Supplementary missing, its value is inferred from other characters that are preserved. Therefore,
Data 1). This is based on the methodology of Smith45, which posits that variation the analysis does not require any one character to be complete in every specimen,
in body size drives covariance across multiple traits. The analysis of Smith enabling relative body size to be estimated for a much larger number of taxa than
demonstrates that difference in size, or isometry, is indicated by the relative would otherwise be possible. The final dataset included scores for a total of 280
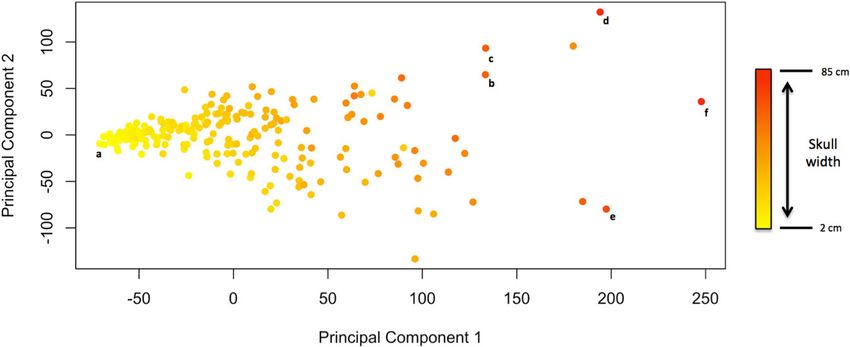
position of taxa on a trend line drawn through a bivariate space of two characters. taxa. The distribution of these 280 taxa along principal component 1 is shown on
Variation in body shape, or allometry, is indicated by the residual error of points Fig. 6, including the position of some notable examples.
above or below that trend line, and therefore this method is applicable to taxa of
varying body proportions. A simplified demonstration of this rationale is shown on
Fig. 5. Jolicoeur46 expands upon this concept into a multivariate model using
principal components analysis. Principal components analysis re-orientates a Phylogenetic modelling. PCM studies of evolution require a phylogenetic tree.
multivariate dataset into a corresponding array of orthogonal axes, with each axis There is no published phylogenetic hypothesis that encompasses all Pseudosuchia,
8 COMMUNICATIONS BIOLOGY | (2021)4:38 | https://doi.org/10.1038/s42003-020-01561-5 | www.nature.com/commsbioCOMMUNICATIONS BIOLOGY | https://doi.org/10.1038/s42003-020-01561-5 ARTICLE
Fig. 6 Ordination morphospace of the first two axes returned by the principal components analysis. Points are coloured according to relative skull width.
This demonstrates the relationship between PC1 and body size, with larger taxa having higher PC1 scores. Note the colour gradient is not fully continuous
along the x-axis, indicating taxa with disproportionately wide or narrow skulls. Notable taxa are indicated: (a) is the smallest taxon in the dataset,
Knoetsuchkesuchus guimarotae; (b) Razandrongobe sakalavae, the largest notosuchian; (c) Crocodylus thorbjarrsoni, the largest crown crocodylid; (d)
Purussaurus brasiliensis, the largest crown alligatorid; (e) Machimosaurus, the largest thalattosuchian and (f) Sarcosuchus imperator, the largest
pseudosuchian.
as well as molecular data from living taxa. Therefore, we estimated a new phylo- Brownian motion. This average was weighted using the log Bayes factor of the
genetic hypothesis for this study. respective model. For comparison, a simple arithmetic mean was also calculated
Previous studies of trait evolution in fossil taxa have been dominated by from the raw data. These mean values are dimensionless, occupying the scale of the
informal supertrees29,55–61. While informal supertrees have practical advantages, first principal component. For the purposes of illustration, the mean values were
they have no underlying systematic basis and are therefore subjective. A matrix- transformed back into an estimate of skull width in centimetres.
based approach was also ruled out, because collecting character data for such a
large matrix from the literature and vetting characters for redundancy would have
Time-series analyses. Trees were dated using first and last appearance dates from
been impractical. In addition, such a large matrix would have introduced a
the Paleobiology Database (pbdb.org). Mean body size and body size variance were
significant fraction of missing data, which could undermine the quality of a
represented as time series using the scores of each taxon on principal component 1
finished tree. The phylogenetic hypothesis used in this study is based on a formal
as a body size proxy. This is not a straightforward exercise because of fossil pre-
supertree analysis (Supplementary Information). Formal supertrees use a
servation heterogeneity and uncertainty about the temporal ranges of taxa, many of
systematic approach to assimilating multiple smaller topologies into a single tree.
which are known from very few specimens. Therefore, we implement three
Such methods have been used previously in macroevolutionary analyses of fossil
approaches to reconstructing time series of mean body size and body size disparity:
taxa28,62. Liberal formal supertree methods enable a well-resolved consensus
topology to be estimated from source trees that are incongruent. (a) Empirical fossil ranges. The simplest time-series approach is to bin taxa by
Here, the supertree (Fig. S4) was assembled using the matrix representation the stratigraphic stage in which fossils have been found, a commonly used
with parsimony method, an approach that has been validated in methodological method34,35. This assumes the known stratigraphic range was the true
comparisons63. The supertree was estimated from a sample of 175 source trees stratigraphic range and does not estimate originations and extinctions
published since 2010, each re-analysed from their original source matrices using before and after the known range.
Bayesian inference and the MK model64. Only matrices containing morphological (b) Phylogenetic adjustment of missing data. Using the same tip-dated formal
data were used; the source trees relating to the crown-group were constrained to a supertree used for fitting phylogenetic models, we added ghost ranges in
published topology of extant taxa derived from molecular data. Supertrees million-year increments (difference in first appearances of sister taxa) to the
generated by the analysis were evaluated using stratigraphic congruence, with the empirical data in method (a). This approach can only reconstruct ghost
best example being retained for use in analyses. The supertree was dated using the ranges and does not estimate beyond known fossil ranges of sister taxa.
equal method; the dated supertree contained a total of 579 archosauromorph taxa, Further, the method assumes that the topology of the phylogenetic tree is
including 24 extant species. This tree was then trimmed to match the 280 correct; an incorrect topology could significantly change the durations of
pseudosuchian taxa included in the body size data. This phylogenetic approach was fossil ghost ranges.
implemented to eliminate as many sources of error as possible. Every effort was (c) Addition of ancestral taxa. This method uses stratigraphy and the
taken to incorporate the most recent and comprehensive data from a diversity of phylogenetic tree as in method (b), but also estimates traits of hypothetical
morphological, stratigraphic and molecular sources. The best-performing ancestral taxa, following established methods66,67. Ancestral states at each
phylogenies are retained at each step. However, like any phylogenetic comparative node were estimated using the ACE function in the APE package in R68, and
analysis, the results of the analyses presented here do depend on a correct their geological age was inferred from the length of the corresponding
phylogenetic topology. Therefore if a significant number of the source trees are internal branch of the phylogenetic tree.
incorrect, the resulting supertree may not be an accurate framework for
A time series may also be biased by outlier taxa, or by inaccuracies in the dating
phylogenetic comparative methods. This is a limitation that can only be
of the phylogenetic tree. To mitigate this, all three versions of each time series were
conclusively overcome through further description of pseudosuchian fossils, and
subjected to bootstrapping, in which multiple mean values were calculated from
continued development of phylogenetic methods. Full details of the supertree
random 50% samples of taxa in each time-bin and repeated over 100 iterations in
analysis are presented in the Supplementary Information.
each case.
Phylogenetic models of body size were fitted using BayesTraits version 265. A
The time series of body size, body size variance and evolutionary rate were
random walk model was fitted as a null hypothesis and was compared with other
analysed for correlation with temperature using linear regressions, partitioned into
models (Ornstein-Uhlenbeck, Kappa, Lambda, Delta, directional trend, variable
Mesozoic and Cenozoic spans. This temporal split corresponds to the end-
rates) using Bayes Factors. All analyses were run for two million iterations, and the
Cretaceous mass extinction and an apparent shift in the stability of body sizes.
first 10,000 iterations were deleted as burn-in. The likelihood profiles of each run
Mesozoic paleotemperatures come from a consensus curve of oxygen isotope data
were plotted to check for a uniform distribution, indicating convergence. Rate
from a range of sources69, selected for its comprehensive temporal coverage.
scalars returned by the variable rates model were computed using the BayesTraits
Cenozoic paleotemperatures come from a curve estimated from oxygen isotope
online post-processing tool, and these were plotted on the phylogenetic tree to
data derived from benthic foraminifera70, which correlates with the less complete
illustrate the relative evolutionary rate on each branch. Branch lengths were set to
terrestrial temperature record71 and has been used in previous macroevolutionary
the scalar values returned by the variable rate model, and coloured according to a
analyses of body size72. This paleotemperature record is limited to a global average.
gradient from blue to red, denoting low and high rates, respectively. The rate
Similarly, body size data is also limited to a global average, since many species are
scalars were also plotted as a time-series, calculated as averages per 1-million-year
known from too few specimens for their geographic range to be determined.
time bin, for which the taxa included in each increment were determined using the
Therefore the data is not sufficient to incorporate geographic variations in
dated supertree. Bootstrapping was implemented as insurance against the effects of
temperature and body size.
outliers and potential errors introduced by tip dating.
The phylogenetic models return a phylogenetically adjusted mean and root trait
estimation, known as alpha (Table 1). An average alpha value was calculated using Statistics and reproducibility. Phylogenetic models were fitted using Bayes-
the values returned by the phylogenetic models that significantly outperformed Traits65. Statistical analyses were implemented using the R programming language
COMMUNICATIONS BIOLOGY | (2021)4:38 | https://doi.org/10.1038/s42003-020-01561-5 | www.nature.com/commsbio 9ARTICLE COMMUNICATIONS BIOLOGY | https://doi.org/10.1038/s42003-020-01561-5
and the APE library68. The dataset assembled as part of this study included 280 25. Markwick, P. J. Fossil crocodilians as indicators of Late Cretaceous and
taxa. Time-series representations were subjected to a sensitivity analysis using 100 Cenozoic climates: implications for using palaeontological data in
randomly sampled bootstrap replicates73–75. reconstructing palaeoclimate. Palaeogeogr. Palaeoclimatol. Palaeoecol. 137,
205–271 (1998).
Reporting summary. Further information on research design is available in the Nature 26. Martin, J. E., Amiot, R., Cuyer, C. L. & Benton, M. J. Sea surface temperature
Research Reporting Summary linked to this article. contributes to marine crocodylomorph evolution. Nat. Commun. 5, 4658
(2014).
27. Mannion, P. D. et al. Climate constrains the evolutionary history and
Data availability biodiversity of crocodylians. Nat. Commun. 6, 8438 (2015).
All data analysed in this study are taken from published sources, including all images of 28. Bronzati, M. & Montefeltro, F. C. & Langer, M. C. Diversification events and
skeletal elements and NEXUS files containing phylogenetic matrices. These published the effects of mass extinctions on Crocodyliformes evolutionary history. R.
sources are referenced in the Supplementary Information and Supplementary Data 1. All Soc. Open Sci. 2, 140385 (2015).
data generated in this study are included in Supplementary Data 1. First-appearance and 29. Godoy, P. L., Benson, R. B. J., Bronzati, M. & Butler, R. The multi–peak
last-appearance data was accessed from the Paleobiology Database (paleodb.org), and all adaptive landscape of crocodylomorph body size evolution. BMC Evol. Biol.
these data are reproduced in the Supplementary Data 1. 19, 167 (2019).
30. Oaks, J. R. A time-calibrated species tree of the Crocodylia reveals a recent
radiation of the true crocodiles. Evolution 65, 3285–3297 (2011).
Received: 9 November 2019; Accepted: 2 December 2020;
31. Thomas, G. H., Cooper, N., Venditti, C., Meade, A. & Freckleton, R. P. Bias
and measurement error in comparative analyses: a case study with the
Ornstein Uhlenbeck model. bioRxiv 4036 (2014).
32. Cooper, N., Thomas, G. H., Venditti, C., Meade, A. & Freckleton, R. P. A
cautionary note on the use of Ornstein Uhlenbeck models in
References macroevolutionary studies. Biol. J. Linn. Soc. 118, 64–77 (2016).
1. Tykoski, R. S., Rowe, T. B., Ketcham, R. A. & Colbert, M. W. Calsoyasuchus 33. Adams, D. C. & Collyer, M. L. Multivariate phylogenetic comparative
valliceps, a new crocodyliform from the Early Jurassic Kayenta Formation of methods: evaluations, comparisons and recommendations. Syst. Biol. 67,
Arizona. J. Vert. Paleontol. 22, 593–611 (2002). 14–31 (2018).
2. Grigg G., Kirshner D. & Shine R. Biology and Evolution of Crocodylians, 34. Brusatte, S. L., Benton, M. J., Lloyd, G. T., Ruta, M. & Wang, S. C. 2010.
(Cornell University Press 2015). Macroevolutionary patterns in the evolutionary radiation of archosaurs
3. Nesbitt, S. J., Barrett, P. M., Werning, S., Sidor, C. A. & Charig, A. J. The oldest (Tetrapoda: Diapsida). Earth Env. Sci. Trans. R. Soc. Edinb. 101, 367–382
dinosaur? A Middle Triassic dinosauriform from Tanzania. Biol. Lett. 9, (2017).
20120949 (2013). 35. Stubbs, T. L., Pierce, S. E., Rayfield, E. J. & Anderson, P. S. Morphological and
4. Jones, M. E., Anderson, C. L., Hipsley, C. A., Müller, J. & Evans, S. E. biomechanical disparity of crocodile-line archosaurs following the end-
Integration of molecules and new fossils supports a Triassic origin for Triassic extinction. Proc. R. Soc. B 280, 20131940 (2013).
Lepidosauria (lizards, snakes, and tuatara). BMC Evolut. Biol. 13, 208 (2013). 36. Pagel, M. The maximum likelihood approach to reconstructing ancestral
5. Jetz, W., Thomas, G. H., Joy, J. B., Hartmann, K. & Mooers, A. O. The global character states of discrete characters of phylogenies. Syst. Biol. 48, 612–622
diversity of birds in space and time. Nature 491, 444–448 (2012). (1999).
6. Pyron, R. A., Burbrink, F. T. & Wiens, J. J. A phylogeny and revised 37. Dal Sasso, C., Pasini, G., Fleury, G. & Maganuco, S. Razanandrongobe
classification of Squamata, including 4161 species of lizards and snakes. BMC sakalavae, a gigantic mesoeucrocodylian from the Middle Jurassic of
Evol. Biol. 13, 93 (2013). Madagascar, is the oldest known notosuchian. PeerJ 5, e3481 (2017).
7. Mannion, P. D., Chiarenza, A. A., Godoy, P. & Cheah, Y. N. Spatiotemporal 38. Millien, V. Morphological evolution is accelerated among island mammals.
sampling patterns in the 230 million year fossil record of terrestrial PLoS Biol. 10, e321 (2006).
crocodylomorphs and their impact on diversity. Paleontol 62, 615–637 (2019). 39. Stubbs, T. L. & Benton, M. J. Ecomorphological diversifications of Mesozoic
8. Benton, M. J. Scleromochlus taylori and the origin of dinosaurs and pterosaurs. marine reptiles: the roles of ecological opportunity and extinction.
Proc. R. Soc. B. 354, 1423–1446 (1999). Paleobiology 42, 547–573 (2016).
9. Meyer, E. R. Crocodilians as living fossils. In Living Fossils (eds. Eldredge, N. & 40. Young, M. T., Desojo, J. B. & Brusatte, S. L. The evolution of extreme
Stanley, S. M.) 105–131 (Springer, New York, 1984). hypercarnivory in the Metriorhynchidae (Mesoeucrocodylia: Thalattosuchia):
10. Wignall, P. B. & Benton, M. J. Lazarus taxa and fossil abundance at times of evidence from microscopic denticle morphology and a new tri-faceted
biotic crisis. J. Geol. Soc. 156, 453–456 (1999). Kimmeridgian tooth from Germany. J. Vert. Paleontol. 30, 1451–1465 (2010).
11. Simpson, G. G. Tempo and Mode in Evolution. (Columbia University Press, 41. Therrien, F. & Henderson, D. M. My theropod is bigger than yours—or not:
New York, 1944). estimating body size from skull length in theropods. J. Vert. Paleontol. 27,
12. Herrera–Flores, J. A., Stubbs, T. L. & Benton, M. J. Macroevolutionary 108–115 (2007).
patterns in Rhynchocephalia: is the tuatara (Sphenodon punctatus) a living 42. Salisbury, S. W., Molnar, R. E., Frey, E. & Willis, P. M. The origin of modern
fossil? Palaeontology 60, 319–328 (2017). crocodyliforms: new evidence from the Cretaceous of Australia. Proc. R. Soc. B
13. Sookias, R. B., Butler, R. J. & Benson, R. B. Rise of dinosaurs reveal major 273, 2439–2448 (2006).
body–size transitions are driven by passive processes of trait evolution. Proc. 43. Sereno, P. C., Larsson, H. C., Sidor, C. A. & Gado, B. The giant crocodyliform
R. Soc. B 279, 2180–2187 (2012). Sarcosuchus from the Cretaceous of Africa. Science 294, 1516–1519 (2001).
14. Benson, R. B. J. et al. Rates of dinosaur body mass evolution indicate 170 44. Pol, D., Turner, A. H. & Norell, M. A. Morphology of the Late Cretaceous
million years of sustained ecological innovation on the avian stem lineage. crocodylomorph Shamosuchus djadochtaensis and a discussion of neosuchian
PLoS Biol. 12, e1001853 (2014). phylogeny as related to the origin of Eusuchia. Bull. Am. Mus. Nat. 2009,
15. Benson, R. B., Hunt, G., Carrano, M. T. & Campione, N. Cope’s rule and the 1–104 (2009).
adaptive landscape of dinosaur body size evolution. Palaeontology 61, 13–48 45. Smith, R. J. Rethinking allometry. J. Theor. Biol. 87, 97–111 (1980).
(2018). 46. Jolicoeur, P. The multivariate generalization of the allometry equation. Biomet
16. Puttick, M. N., Thomas, G. H. & Benton, M. J. High rates of evolution 19, 497–499 (1963).
preceded the origin of birds. Evolution 68, 1497–1510 (2014). 47. Jungers, W. L., Falsetti, A. B. & Wall, C. E. Shape, relative size, and size-
17. Brown, J. H. & Maurer, B. A. Body size, ecological dominance and Cope’s rule. adjustments in morphometrics. Yearb. Phys. Anthropol. 38, 137–161 (1995).
Nature 324, 248–250 (1986). 48. Bryant, E. H. On use of logarithms to accommodate scale. Syst. Biol. 35,
18. LaBarbera, M. Analyzing body size as a factor in ecology and evolution. Annu. 552–559 (1986).
Rev. Ecol. Evol. Syst. 20, 97–117 (1989). 49. Lougheed, S. C., Arnold, T. W. & Bailey, R. C. Measurement error of external
19. Roy, K. Dynamics of body size evolution. Science 321, 1451–1452 (2008). and skeletal variables in birds and its effect on principal components. Auk
20. Cooper, N. & Purvis, A. Body size evolution in mammals: complexity in 108, 432–436 (1991).
tempo and mode. Am. Nat. 175, 727–738 (2010). 50. Adams, R. A. Evolutionary implications of developmental and functional
21. Hone, D. W. & Benton, M. J. The evolution of large size: how does Cope’s integration in bat wings. J. Zool. 246, 165–174 (1998).
Rule work? Trends Ecol. Evol. 1, 4–6 (2005). 51. Goodwin, H. T. Odontometric patterns in the radiation of extant ground-
22. Cope, E. D. The Primary Factors of Organic Evolution (Open Court dwelling squirrels within Marmotini (Sciuridae: Xerini). J. Mammal. 90,
Publishing, Chicago, 1896). 1009–1019 (2009).
23. Van Valen, L. A new evolutionary law. Evol. Theory 1, 1–30 (1973). 52. Cueva del Castillo, R., Sanabria-Urbán, S. & Serrano-Meneses, M. A. Trade-
24. Barnosky, A. D. Does evolution dance to the Red Queen or the Court Jester? J. offs in the evolution of bumblebee colony and body size: a comparative
Vertebr. Paleontol. 19, 31 (1999). analysis. Ecol. Evol. 5, 1–13 (2015).
10 COMMUNICATIONS BIOLOGY | (2021)4:38 | https://doi.org/10.1038/s42003-020-01561-5 | www.nature.com/commsbioYou can also read