Morphological innovation and the evolution of hadrosaurid dinosaurs
←
→
Page content transcription
If your browser does not render page correctly, please read the page content below
Paleobiology, 45(2), 2019, pp. 347–362
DOI: 10.1017/pab.2019.9

Morphological innovation and the evolution of
hadrosaurid dinosaurs

Thomas L. Stubbs         , Michael J. Benton, Armin Elsler             , and Albert Prieto-Márquez

Abstract.—The hadrosaurids were a successful group of herbivorous dinosaurs. During the Late Cret-
aceous, 100 to 66 million years ago, hadrosaurids had high diversity, rapid speciation rates, and wide geo-
graphic distribution. Most hadrosaurids were large bodied and had similar postcranial skeletons.
However, they show important innovations in the skull, including disparate crests that functioned as
socio-sexual display structures, and a complex feeding apparatus, with specialized jaws bearing dental
batteries. Little is known about the macroevolutionary processes that produced these evolutionary novel-
ties. Here we provide novel perspectives using evolutionary rate and disparity analyses. Our results show
that hadrosaurid cranial evolution was complex and dynamic, but their postcranial skeleton and body size
were conservative. High cranial disparity was achieved through multiple bursts of phenotypic innovation.
We highlight contrasting evolutionary trends within hadrosaurids between the disparate facial skeleton
and crests, which both showed multiple high-rate shifts, and the feeding apparatus, which had low vari-
ance and high rates on a single phylogenetic branch leading to the diverse Saurolophidae. We reveal that
rapid evolutionary rates were important for producing the high disparity of exaggerated crests and present
novel evidence that the hadrosaurid diversification was linked to both a key adaptive innovation in the
feeding apparatus and multiple bursts of innovation in socio-sexual displays.

Thomas L. Stubbs, Michael J. Benton, and Armin Elsler. School of Earth Sciences, University of Bristol, 24 Tyndall
  Avenue, Bristol BS8 1TQ, U.K. E-mail: tom.stubbs@bristol.ac.uk, mike.benton@bristol.ac.uk, armin.elsler@
  bristol.ac.uk
Albert Prieto-Márquez.* Field Museum of Natural History, 1400 S. Lake Shore Drive, Chicago, Illinois 60605,
   U.S.A. *Present address: Institut Català de Paleontologia Miquel Crusafont, Universitat Autònoma de
   Barcelona, Carrer de l’Escola Industrial 23, 08201 Sabadell, Spain. E-mail: albert.prieto@icp.cat

Accepted: 3 February 2019
Data available from the Dryad Digital Repository: https://doi.org/10.5061/dryad.0dt2h6c

                       Introduction
                                                                   successful groups (e.g., Brusatte et al. 2014;
   Evolutionary diversifications are commonly                       Hopkins and Smith 2015; Close et al. 2015; Ben-
associated with adaptive radiations, when                          son et al. 2018).
“key innovations” open new adaptive zones                             Hadrosauroids were a hugely diverse and
linked to ecological opportunities (Simpson                        abundant clade of herbivorous ornithopod
1953; Schluter 2000; Yoder et al. 2010; Simões                     dinosaurs (Horner et al. 2004; Prieto-Márquez
et al. 2016). However, not all evolutionary                        2010a). These megaherbivores were important
diversifications are directly linked to new eco-                    components in the Late Cretaceous (100–66
logical adaptations (Rabosky 2017). For                            million years ago) ecosystems of Eurasia, Ant-
example, speciation, high diversity, and mor-                      arctica, and the Americas (Prieto-Márquez
phological variation may be driven by socio-                       2010b). Within hadrosauroids, the clade
sexual selective factors (Wagner et al. 2012;                      Hadrosauridae (hadrosaurids) radiated signifi-
Rabosky 2017). The fossil record provides                          cantly during the latest Cretaceous (Santonian–
insights into evolutionary diversifications                         Maastrichtian) (Fig. 1). Quantitative studies
across large spatiotemporal scales in geological                   show that hadrosaurids had high taxic diver-
time (Benton 2015). Methodological advance-                        sity (Lloyd et al. 2008; Butler et al. 2009) and
ments and the availability of large phylogenies                    notably high speciation rates when compared
and morphological data sets allow researchers                      with other contemporaneous dinosaurian
to test patterns and processes of morphological                    clades (Sakamoto et al. 2016). The postcranial
evolution quantitatively, including evolution-                     skeleton of hadrosaurids was apparently mor-
ary rate and disparity dynamics in highly                          phologically conservative, with a consistent

© 2019 The Paleontological Society. All rights reserved. This is an Open Access article, distributed under the terms of the Creative
Commons Attribution licence (http://creativecommons.org/licenses/by/4.0/), which permits unrestricted re-use, distribution, and
reproduction in any medium, provided the original work is properly cited.                                            0094-8373/19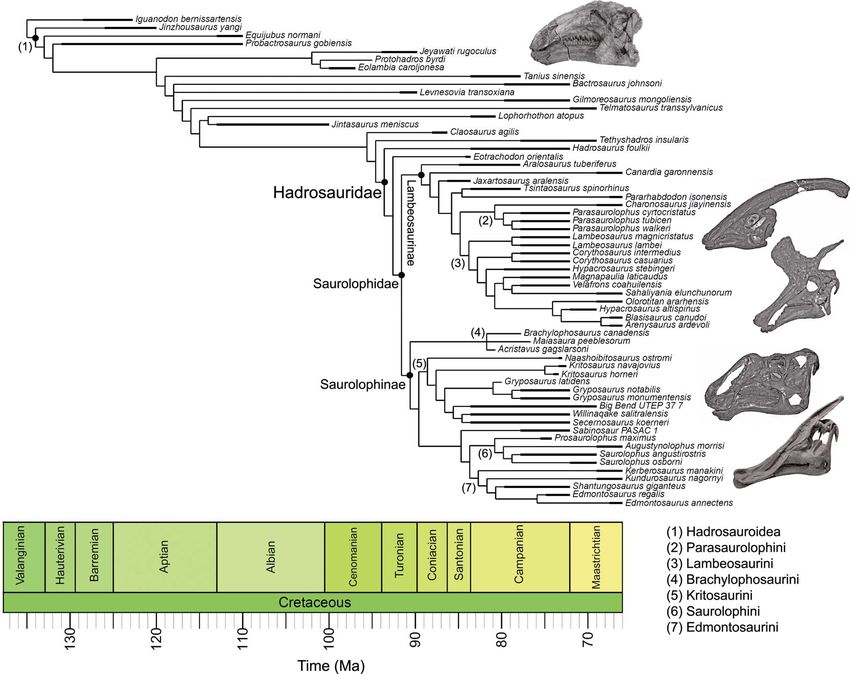
348
                                                                                                                                                                                 THOMAS L. STUBBS ET AL.

FIGURE 1. Time-scaled phylogeny of hadrosauroids. The cladogram is a strict consensus tree generated using the four most parsimonious trees from Prieto-Márquez et al.
(2016). The thicker lines illustrate the upper and lower bounds of stratigraphic ranges. Major clades are highlighted. The figured skulls are from Equijubus normani, Parasaur-
olophus walkeri, Lambeosaurus lambei, Gryposaurus notabilis, and Saurolophus angustirostris (from top to bottom).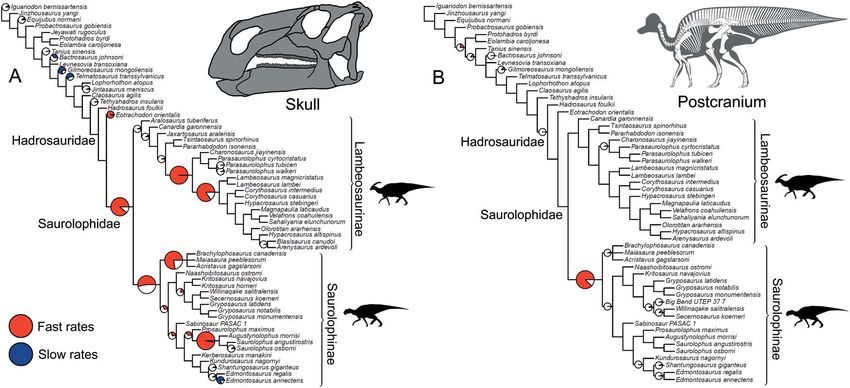
MORPHOLOGICAL INNOVATION IN HADROSAURID DINOSAURS                                349

body plan, and most species were large-bodied            2009; Cuthbertson et al. 2012). The success of
(7–14 m in length) (Horner et al. 2004). How-            hadrosaurids has been attributed to this unique
ever, their cranial and mandibular anatomy               feeding apparatus, and previous macroevolu-
shows unique and specialized innovations,                tionary work on ornithopod dental disparity
potentially linked to their success.                     proposed that, once this complex dental battery
   Hadrosaurids are famed for their elaborate            emerged rapidly in hadrosaurids, there was
solid (most species of the subclade Saurolophi-          limited further innovation (Strickson et al.
nae) and hollow (subclade Lambeosaurinae) cra-           2016). Hadrosaurids therefore present an inter-
nial crests (Evans 2010; Prieto-Márquez et al.           esting test case for comparing agencies of nat-
2015) (Fig. 1). These exaggerated ornamental             ural and socio-sexual selection, namely their
structures were formed by extensive modifica-             conservative, but highly successful, feeding
tions to the nasal and frontal bones in saurolo-         apparatus, a classic key innovation, and their
phines and the premaxilla and nasal bones in             highly variable “nonadaptive” cranial crests.
lambeosaurines, and they manifested as an                   In this study, we present a series of evolu-
impressive array of shapes, including tubes,             tionary rate and disparity analyses that uncover
lobes, fans, and rounded plates. Crests could            the patterns and processes of morphological
also be formed by soft tissues (Bell et al. 2014).       evolution during the diversification of hadro-
Hadrosaurid crests functioned primarily as vis-          sauroids. We address several key questions
ual displays (Hopson 1975; Bell et al. 2014;             based on our current understanding of hadro-
Prieto-Márquez et al. 2015), and in lambeosaur-          sauroid morphological evolution. First, how
ines the hypertrophied nasal passages inside             do evolutionary rate and disparity dynamics
the crests may have been used for sound produc-          vary between their disparate skulls and seem-
tion (Weishampel 1997). The visual and potential         ingly conservative postcranial skeletons? Was
auditory signals of hadrosaurid crests were likely       hadrosaurid cranial disparity achieved through
important factors in socio-sexual selection,             a single evolutionary burst at one position in
potentially being used for mate competition              the tree, or through multiple bursts of innov-
(Evans 2010; Knell and Sampson 2011; Hone                ation? Did the two major hadrosaurid evolu-
et al. 2011; Bell et al. 2014). Socio-sexual selection   tionary novelties, the disparate cranial crests
can lead to a great variety of specialized adapta-       and the successful feeding apparatus, evolve
tions, with important macroevolutionary conse-           in the same way—were both associated with a
quences, including higher speciation rates               single or multiple evolutionary bursts? Finally,
(Panhuis et al. 2001; Knell et al. 2013). Crests,        as body-size disparity was a key aspect of dino-
such as those in hadrosaurids, represent an              saurian evolution and a potential factor in
important innovation and a source of morpho-             niche partitioning (Barrett 2014; Benson et al.
logical disparity that is disconnected from trad-        2018), we test whether rates of hadrosauroid
itional macroevolutionary “adaptive zones”               body-size evolution were homogeneous or a
(Simpson 1953), as they have no role in the acqui-       potentially important morphological variable.
sition of food resources or escape from predators.       Our results confirm that hadrosauroid skull
   Important adaptive innovations are seen               evolution was dynamic, while their postcranial
in the hadrosaurid feeding apparatus. They               skeleton was morphologically conservative.
evolved histologically and biomechanically               Body-size change is ruled out as an important
complex grinding structures made from multi-             source of innovation. Importantly, we show
toothed dental batteries with complex struc-             that the unique hadrosaurid jaw apparatus
tures (Erickson et al. 2012). This dentition             evolved fast and then stabilized at the root of
facilitated crushing and shearing, allowing              the clade, whereas the cranial crests kept diver-
hadrosaurids to master a broad range of herbiv-          sifying in several bursts of rapid evolution
orous diets, while not precluding omnivory               throughout hadrosaurid evolution. This high-
(Chin et al. 2017). Complex dentition was asso-          lights contrasting evolutionary dynamics
ciated with specialized jaw mechanisms, poten-           between adaptive and nonadaptive morpho-
tially giving hadrosaurids the ability to “chew”         logical innovations during the diversification
(Norman and Weishampel 1985; Williams et al.             of hadrosauroid dinosaurs.
350                                   THOMAS L. STUBBS ET AL.

              Material and Methods                  which is a composite topology derived from
Hadrosauroid Phylogeny                              six phylogenetic studies (Butler et al. 2011;
   The hadrosauroid phylogenies used in this        Makovicky et al. 2011; McDonald 2012; Ősi
study are from Prieto-Márquez et al. (2016).        et al. 2012; Norman 2015; Prieto-Márquez
Their study included 60 hadrosauroid species        et al. 2016), we used the occurrence dates of
and the out-group Iguanodon, and four most          the following out-group taxa: Kukufeldia, Uteo-
parsimonious trees (MPTs) were generated            don, Camptosaurus, Callovosaurus, Agilisaurus,
using maximum parsimony analysis. Overall,          Lesothosaurus, Pisanosaurus, Marasuchus, and
hadrosauroid interrelationships were well           Euparkeria (ages are listed in the Supplementary
resolved, with uncertainty only in the positions    Material S1). The MBL dating method uses the
of Levnesovia and Bactrosaurus and the interrela-   age of the oldest descendant to determine
tionships of brachylophosaurin saurolophines        internal node ages. When branches are recov-
(Fig. 1). In this study we perform rate analyses    ered with durations less than an arbitrarily set
on all four MPTs to gauge the influence of phylo-    threshold, they are substituted with a fixed
genetic uncertainty. Results are summarized         MBL (here we use 1 Myr) (Laurin 2004). The
using consensus trees, and individual MPTs are      Hedman dating method is considered to be
presented in the Supplementary Material.            superior to the MBL approach (Lloyd et al.
                                                    2016), so here we use the MBL method only in
Phylogenetic Time-scaling                           ancillary analyses to check that our results are
   Our evolutionary rate analyses required phy-     consistent.
logenies with estimated branch durations. Geo-         Dating uncertainty for terminal taxa was
logical ages for terminal taxa were needed first.    incorporated when time-scaling the phyloge-
Precise temporal occurrence data are rarely         nies. We randomly selected a point age for
known for hadrosauroids, and in most cases,         each taxon from a uniform distribution
taxon durations represent the bounds of the         between its FAD and LAD (dates reflecting
geological formation(s), stage(s) or substage(s)    bounds of precise temporal occurrence or
in which referred fossils are known. Therefore,     range) and performed 100 dating replicates
hadrosauroid ages were recorded as first             for each MPT. In total, 800 time-scaled hadro-
appearance dates (FADs) and last appearance         sauroid phylogenetic trees were used in the
dates (LADs), using data collected from the pri-    evolutionary rate analyses: 100 replicates for
mary literature and the geological time scale of    each of the four MPTs, for both the Hedman
Walker et al. (2013) (data in the Supplementary     and MBL dating approaches.
Material S1).
   There are multiple methods available for pro-    Morphological Data
ducing time-calibrated phylogenies, and the            To test rates of skeletal character evolution,
choice of method can impact results (Bapst          we used the discrete morphological character
2014; Soul and Friedman 2017). To account           data set from Prieto-Márquez et al. (2016). In
for this, we implement two popular time-            total, 273 morphological characters are
scaling approaches, the “Hedman” method             included, describing variation from the entire
and the “minimum branch length” (MBL)               skeleton (see the Supplementary Material S1).
approach. The Hedman method uses Bayesian           The data set has good coverage of the non-
statistics to date nodes, incorporating probabil-   hadrosaurid hadrosauroid grade and both
ity distribution constraints derived from           major hadrosaurid subclades; the Lambeosaur-
successive out-group taxa ages (Hedman              inae and Saurolophinae. The data set was parti-
2010). We utilized a whole-tree extension of        tioned to examine evolutionary rates in specific
the Hedman algorithm using the R functions          anatomical subregions. The most basic division
from Lloyd et al. (2016). Successive out-group      was to examine rates in the skull, including the
taxa that predate the hadrosauroid plus Iguano-     cranium, mandible, and teeth (189 characters),
don in-group were required to date the nodes        versus the postcranial skeleton (84 characters).
close to, and including, the root. Guided by        Additionally, we divided the skull into separ-
the supertree from Strickson et al. (2016),         ate components: the facial skeleton, the crest-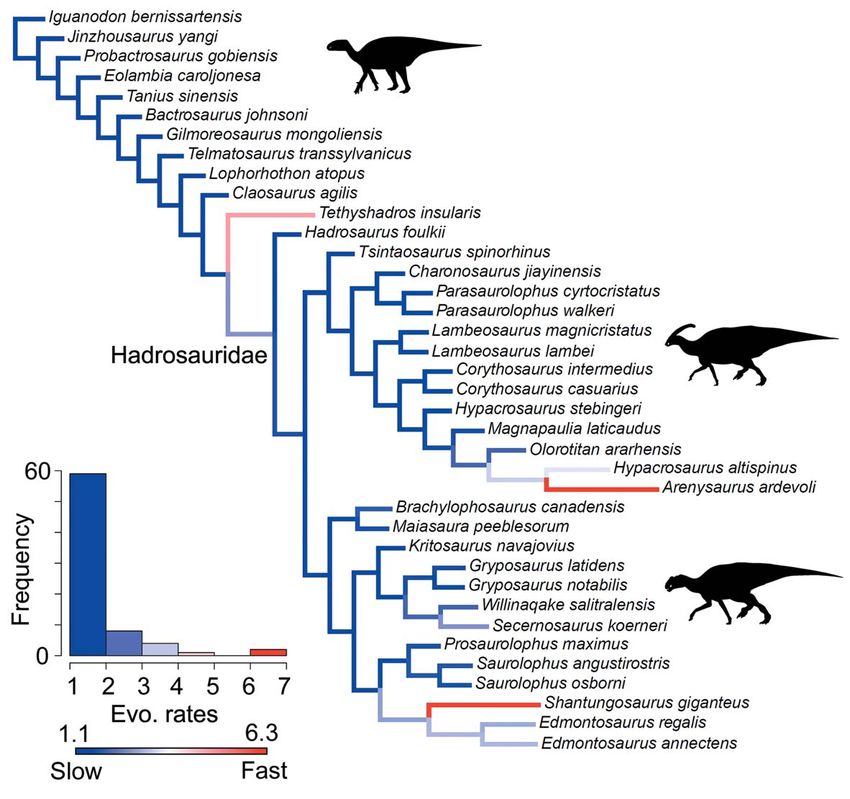
MORPHOLOGICAL INNOVATION IN HADROSAURID DINOSAURS                                351

forming elements, and feeding characters. The          and character inapplicability will introduce
facial skeleton includes cranial characters, but       varying degrees of missing data (both for ter-
excludes the braincase, the mandible, and              minal taxa and reconstructed ancestral nodes).
dentition (107 characters). Crest morphology           This could influence chances of observing char-
includes characters primarily from the premax-         acter changes. Therefore, per-branch rates were
illa and nasal bones and characters relevant to        based on changes per character per lineage
the formation and shape of crests (63 charac-          million years.
ters). Feeding-related characters are derived             Significance tests were used to examine het-
from the mandible and dentition (48 charac-            erogeneous evolutionary rates and to identify
ters). Rate analyses were performed separately         branches with notable rate deviations. Rather
on these five partitions.                               than focusing on absolute rate values, we fol-
   For body-size evolutionary rate analyses, we        lowed previous studies and tested whether all
used maximum femur length as a proxy for               individual branches in a tree exhibit higher or
hadrosauroid body mass. Femur length is a              lower rates of morphological evolution than
popular proxy for overall body mass in tetra-          the pooled rate for the rest of the tree (Lloyd
pods (Carrano 2006), whereas some studies              et al. 2012; Brusatte et al. 2014; Hopkins and
also use stylopodial shaft circumference (e.g.,        Smith 2015; Wang and Lloyd 2016; Herrera‐
Benson et al. 2018). We selected femur lengths,        Flores et al. 2017). To determine statistical sig-
because more data are available for hadrosaur-         nificance, we used branch likelihood ratio
oids (37 out of 60 hadrosauroids in our phyl-          tests, comparing a single rate model (homoge-
ogeny, but the other 23 taxa lacked adequate           neous rates across the tree) and a two-rate
femora). Femur length data are from Benson             model (individual branch rates different from
et al. (2018), and this data set could not be          the rest of the tree). Each branch test gives a
expanded further through additional museum             p-value, and, following published protocols,
visits. Data were log10 transformed before rate        we use an alpha threshold of 0.01 to assess
analyses (see the Supplementary Material S1).          significance, with Benjamini-Hochberg false
                                                       discovery rate correction for multiple compari-
Discrete Character Evolutionary Rates                  sons (Benjamini and Hochberg 1995; Lloyd
   Rates of character evolution were examined          et al. 2012; Brusatte et al. 2014; Hopkins and
using maximum-likelihood methods. All char-            Smith 2015; Wang and Lloyd 2016; Herrera‐
acter rate calculations were performed in R            Flores et al. 2017). In the main text, results
(R Core Team 2018), using the DiscreteCharac-          from the branch likelihood tests are summar-
terRate function from the package ‘Claddis’            ized on a strict consensus tree derived from
(Lloyd 2016), and ancestral states were calcu-         the four separately analyzed MPTs, incorporat-
lated using the rerootingMethod function in            ing a total of 400 Hedman-dated phylogenies.
the R package ‘phytools’ (Revell 2012). We             We use pie charts to illustrate the proportion
used protocols established by previous studies         of dating replicates that showed significantly
(e.g., Lloyd et al. 2012; Brusatte et al. 2014; Hop-   high or low rates for each branch (Figs. 2, 3).
kins and Smith 2015; Wang and Lloyd 2016;
Herrera‐Flores et al. 2017). The separate ana-         Body-Size Evolutionary Rates
lyses required the time-scaled phylogenies                Body-size evolutionary rates were analyzed
and the five partitioned character data sets as         in a Bayesian framework using a univariate
input. Rate calculations were based on the             variable-rates model in BayesTraits v. 2.0.2
number of character changes observed along a           and R (Pagel et al. 2004; Venditti et al. 2011;
branch relative to the duration of that branch.        Baker et al. 2016). We examined rate heterogen-
Importantly, the calculations also factored in         eity with a Bayesian Markov chain Monte Carlo
branch completeness as a denominator (Wang             reversible-jump algorithm. Analyses were run
and Lloyd 2016). This is important, because            for 10 million (10,000,000) iterations, with para-
the calculations were based on multiple coded          meters sampled every 1000 iterations. The first
morphological characters (here ranging from            10% (1,000,000) of samples were discarded as
189 to 48 characters), and fossil incompleteness       burn-in, and convergence was assessed based
352 THOMAS L. STUBBS ET AL.
on effective sample size values >200. This pairwise dissimilarity (MPD) and using gener-
method accounts for phenotypic change along alized Euclidean distances.
branches assuming a homogeneous Brownian To further examine morphological diversifi-
process and also introduces a variable-rates cation in Hadrosauroidea, we generated mor-
model where branch-specific scalars are incor- phospaces for each anatomical region. The
porated that accommodate branches with separate MORD matrices were subjected to
greater (or less) phenotypic variance than principal coordinates analysis (PCoA) incorp-
expected from a homogeneous model (Baker orating Calliez negative eigenvalue correction
et al. 2016). We assessed the fit of a Brownian (Cailliez 1983). Before each PCoA, the function
(homogeneous) versus variable-rates (hetero- TrimMorphDistMatrix from the R package
geneous) model using Bayes factors (BFs). The ‘Claddis’ (Lloyd 2016) was used to iteratively
marginal likelihood of each model was calcu- remove selected taxa from the distance matrices
lated using stepping-stone sampling, with 100 that had no shared coded characters (meaning
stones each run for 1000 iterations (Xie et al. morphological distances were not calculable).
2011). Across hadrosauroid phylogeny, branch- Morphospaces were constructed based on
specific rates were reported using the mean sca- PCoA axes 1 and 2, showing the major axes of
lar parameter. In the main text we present the morphological variation. It is important to
results using a consensus tree from variable- note that applying the Cailliez correction not-
rates analyses using 400 Hedman-dated phylo- ably reduced the proportion of variance
genies (four MPTs, each with 100 dating expressed by the major PCoA axes when com-
replicates). pared with “uncorrected” PCoA (Supplemen-
tary Fig. S7). However, in both analyses, the
Morphological Disparity distribution of taxa within morphospace was
Disparity analyses were performed to nearly identical for the major axes, as previ-
explore the distribution of skeletal morpho- ously discussed by Hopkins (2016) and Nordén
logical variation in Hadrosauroidea. First, the et al. (2018). We used a phylomorphospace
five partitioned character–taxon morphological approach to visualize the phylogenetic branch-
data sets were used to calculate a pairwise dis- ing pattern. We use a single Hedman-dated
similarity matrix, based on maximum observ- phylogeny with the topology of MPT 1 in all
able rescaled distances (MORD), using the R phylomorphospace plots. The locations of
package ‘Claddis’ (Lloyd 2016). From this dis- internal nodes in the phylomorphospaces (the
similarity matrix, disparity was then quantified inferred ancestral morphospace positions) were
in four taxonomic bins: the non-hadrosaurid estimated using maximum-likelihood approaches
hadrosauroid grade (paraphyletic), Hadro- in the R package ‘phytools’ (Revell 2012).
sauridae, Lambeosaurinae, and Saurolophinae.
These comparisons were made to test whether
Results
the hadrosaurid diversification gave rise to sig-
nificantly greater morphological disparity than Rates of Skeletal Character Evolution
was present in the hadrosauroid grade for each Rates of skeletal character evolution were
morphological partition and to examine how heterogeneous in hadrosauroids. In all 800
disparity varied between the two major hadro- trees examined for each of the five morpho-
saurid subclades. We calculated the variance- logical partitions, a null test for homogeneous
based disparity metric within-bin weighted rates across the whole tree was confidently
mean pairwise dissimilarity (WMPD). WMPD rejected at an alpha threshold of 0.01. This
places greater weighting on pairwise dissimi- applied to trees time-scaled using both the
larities derived from more comparable charac- Hedman and MBL methods. As a result, indi-
ters and is robust to sample-size variation vidual per-branch tests were required to
(Close et al. 2015). The 95% confidence intervals explore the distribution of rate deviations
were generated using a bootstrapping proced- throughout the phylogenies. The frequencies
ure. Supplementary disparity calculations and positions of evolutionary bursts vary for
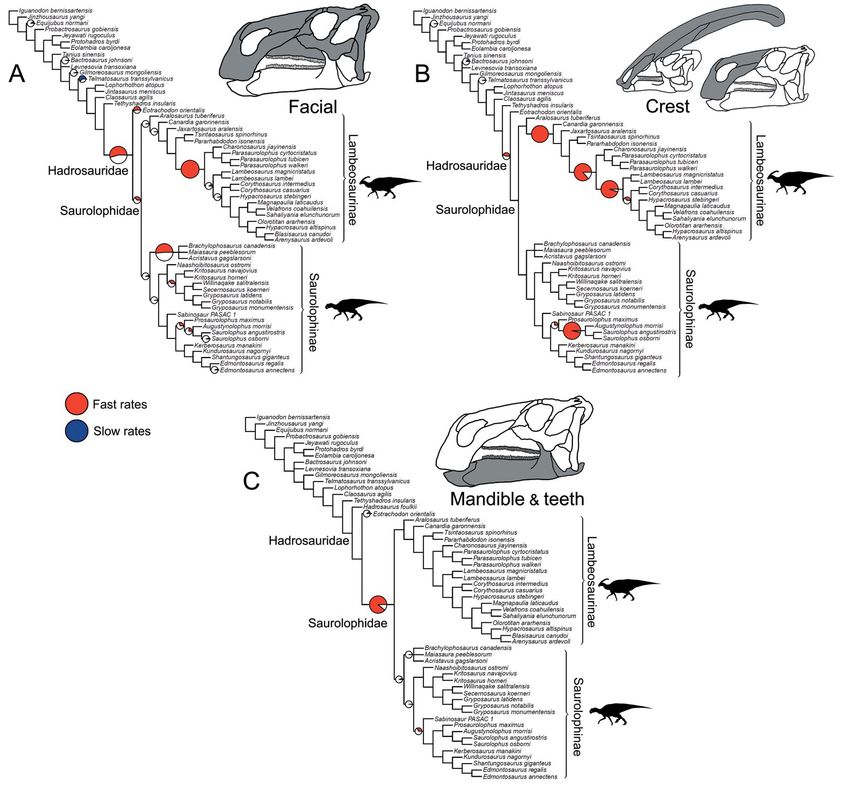
were performed based on unweighted mean each morphological partition considered, andMORPHOLOGICAL INNOVATION IN HADROSAURID DINOSAURS 353 FIGURE 2. Rates of skeletal character evolution in the skull and postcranial skeleton of hadrosauroids. Cladograms illus- trate the results from branch likelihood tests for two morphological partitions: skull (cranium and mandible) (A) and post- cranial skeleton (B). In both cladograms, results from the branch likelihood tests are summarized on a strict consensus tree derived from four separately analyzed MPTs, each with 100 dating replicates (a total of 400 Hedman-dated phylogenies). Pie charts on branches illustrate the proportion of dating replicates that showed significantly high rates (red), slow rates (blue), or nonsignificant average rates (white). No pie charts are plotted on branches that showed nonsignificant rates in 100% of dating replicates. Branches that showed high rates (red) in more than 50% of dating replicates are doubled in length. See the Supplementary Material for Hedman-based results plotted separately for each MPT (Supplementary Fig. S2) and for results using the MBL dating method (Supplementary Fig. S3). Silhouettes were created by Scott Hartman and were downloaded from http://phylopic.org (Creative Commons license CC BY 3.0). these are illustrated using consensus trees from rate branches are seen at the base of saurolo- the 400 Hedman-dated phylogenies (Figs. 2, 3; phines and brachylophosaurin saurolophines, MBL results in Supplementary Fig. S3). There and on the branch leading to Saurolophus and is no evidence that the contrasting numbers of Augustynolophus. These trends are essentially significant high- or low-rate branches in the the same when using the MBL dating method five morphological partitions is a result of vari- (Supplementary Fig. S3). Evolutionary rates able character-coding completeness (Supple- in the postcranial skeleton show contrasting mentary Fig. S4). By examining character results (Fig. 2B): only one branch, at the origin changes on branches throughout the phyloge- of saurolophines, shows significantly acceler- nies, we confirm that, in all anatomical parti- ated rates, and no other significant rate shifts tions, significantly high-rate branches reflect are recovered among hadrosaurids. There is large numbers of novel character changes and very tentative evidence for high postcranial do not reflect the rapid recycling of already rates more basally in hadrosauroids, but this acquired states (Supplementary Fig. S5). is not consistently recovered across dating In the skull, likelihood tests show that signifi- replicates and is recovered in less than 25% of cantly high evolutionary rates are concentrated iterations (Fig. 2B). in hadrosaurids, while the hadrosauroid grade Subdividing the skull into constituent parts shows either nonsignificant rates (neither reveals more nuanced trends (Fig. 3). When high nor low) or significantly low rates at the considering just the facial complex (skull tips (e.g., Gilmoreosaurus and Telmatosaurus) minus the mandible, teeth, and braincase), sig- (Fig. 2A). Significantly high rates are seen on nificantly accelerated rates are recovered at the the basal hadrosaurid branch giving rise to base of Hadrosauridae and brachylophosaurin Saurolophidae. Two branches within Lambeo- saurolophines, and for one branch within more saurinae also consistently show significantly derived lambeosaurines (Fig. 3A). There is high rates across dating replicates. Other high- some evidence for further facial high-rate
354                                            THOMAS L. STUBBS ET AL.

FIGURE 3. Rates of skeletal character evolution in the skulls of hadrosauroids. Cladograms illustrate the results from branch
likelihood tests for three morphological partitions: facial bones (A), crest-forming elements (B), and mandible and teeth (C).
In all cladograms, results from the branch likelihood tests are summarized on a strict consensus tree derived from four sep-
arately analyzed MPTs, each with 100 dating replicates (a total of 400 Hedman-dated phylogenies). Pie charts on branches
illustrate the proportion of dating replicates that showed significantly high rates (red), slow rates (blue), or nonsignificant
average rates (white). No pie charts are plotted on branches that showed nonsignificant rates in 100% of dating replicates.
Branches that showed high rates (red) in more than 50% of dating replicates are doubled in length. See the Supplementary
Material for Hedman-based results plotted separately for each MPT (Supplementary Fig. S2) and for results using the MBL
dating method (Supplementary Fig. S3). Silhouettes were created by Scott Hartman and were downloaded from http://
phylopic.org (Creative Commons license CC BY 3.0).

excursions at the base of Saurolophidae and                     bones, significantly high rates are seen basally
within Kritosaurini and Saurolophini, but                       in lambeosaurine hadrosaurids, on the branch
these are not consistently recovered in dating                  leading to all members of the clade except
replicates (Fig. 3A). When the phylogenies are                  Aralosaurus (Fig. 3B). Two further high-rate
dated using the MBL approach, high rates in                     branches are also consistently recovered in
facial characters are consistently seen at the                  more derived lambeosaurines, at the base of
base of Saurolophidae, but not Hadrosauridae.                   the clade including all members of Parasauro-
For the crest-related premaxilla and nasal                      lophini and Lambeosaurini, and again at the
MORPHOLOGICAL INNOVATION IN HADROSAURID DINOSAURS                                               355

FIGURE 4. Hadrosauroid morphological disparity. Disparity is weighted mean pairwise dissimilarity (WMPD) calculated
from maximum observable rescaled distances (MORD). Results are plotted for the entire skull, the facial skeleton, the crest-
forming elements, the mandible and teeth, and the postcranial skeleton. Disparity was calculated for four taxonomic bins:
the non-hadrosaurid hadrosauroid grade, Hadrosauridae, Lambeosaurinae, and Saurolophinae. Error bars represent 95%
confidence intervals generated using a bootstrapping procedure. Disparity results from unweighted MPD and using gen-
eralized Euclidean distances are in the Supplementary Material (Supplementary Fig. S6).

branch just for Lambeosaurini. Accelerated                     facial bones are considered. For crest bones,
rates in crest-related bones are also seen in the              disparity is subequal in lambeosaurines and
Saurolophini within saurolophines (Fig. 3B).                   saurolophines. The hadrosauroid grade has sig-
There is some support for high crest rates on                  nificantly greater disparity in feeding-related
the basal branch for Hadrosauridae, but this                   characters from the mandible and dentition
is only recovered in 45% of Hedman-dated                       when compared with hadrosaurids. The same
trees. Feeding-related characters from the man-                is true when examining the postcranial skeleton
dible and dentition have significantly acceler-                 (Fig. 4). Disparity results are consistent for
ated rates on only a single branch, the basal                  unweighted MPD and in calculations using
hadrosaurid branch leading to Saurolophidae                    generalized Euclidean distances (Supplemen-
(Fig. 3C). Nonsignificant rates dominate, and                   tary Fig. S6).
there are no further instances of significant rate                 Morphospace trends generally support the
shifts in feeding characters within the clade.                 conclusions derived from WMPD disparity
This result is identical in trees dated using the              summary statistics. Morphospaces for the
MBL method (Supplementary Fig. S3).                            whole skull and just facial bones show that
                                                               the non-hadrosaurid hadrosauroids occupy a
Hadrosauroid Morphological Disparity                           small area of morphospace on both PCoA
   Morphological disparity was unevenly dis-                   axes 1 and 2. In contrast, the hadrosaurids
tributed in hadrosauroids (Fig. 4). In the skull,              have expansive morphospace occupation, and
hadrosaurids exhibit significantly greater dis-                 the lambeosaurines and saurolophines radiate
parity (WMPD) than the non-hadrosaurid                         on both major axes (Fig. 5A,B). Massive mor-
hadrosauroid grade. Within hadrosaurids,                       phospace expansion in hadrosaurids is even
saurolophines have greater skull disparity                     more distinct for the crest-related premaxilla
than lambeosaurines. This result is identical                  and nasal bones (Fig. 5C). Saurolophines are
when considering only the bones from the                       positioned close to the non-hadrosaurid hadro-
facial complex (skull minus the braincase, man-                sauroid grade, but they do diverge along PCoA
dible, and teeth). For the crest-related premax-               axis 2. The lambeosaurines markedly radiate
illa and nasal bones, hadrosaurids once again                  along PCoA axis 1 and also expand greatly on
exhibit significantly greater disparity than the                PCoA axis 2, reflecting the disparate crest
hadrosauroid grade, with the magnitude of dif-                 morphologies of Parasaurolophini and Lam-
ference being even more than when all skull or                 beosaurini (Fig. 5C). In morphospace for
356
THOMAS L. STUBBS ET AL.
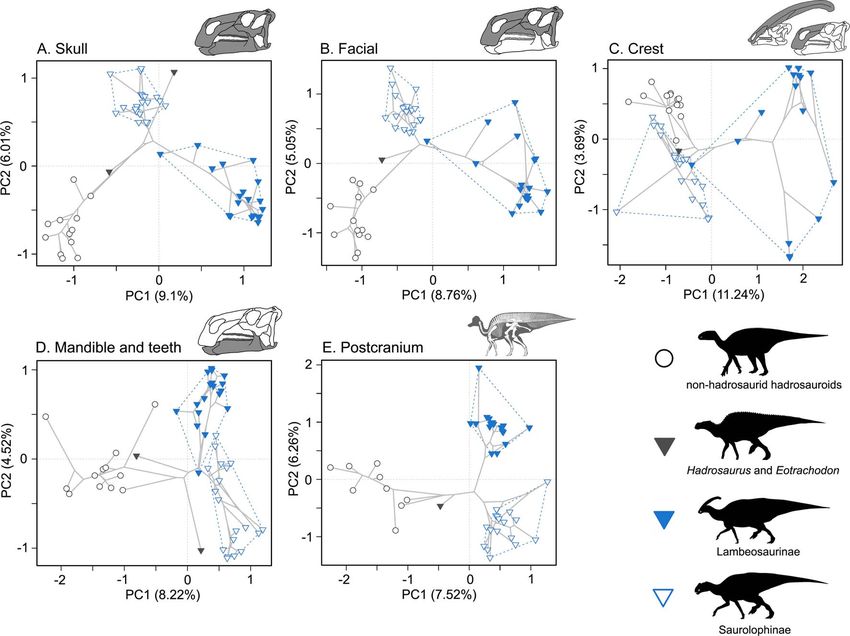
FIGURE 5. Morphospace trends in Hadrosauroidea. Phylomorphospace plots are based on PCoA axes 1 and 2 for five morphological character partitions: skull (55 taxa) (A),
facial bones (55 taxa) (B), crest-forming elements (51 taxa) (C), mandible and teeth (52 taxa) (D), and the postcranial skeleton (44 taxa) (E). The major comparative groupings are
denoted by different symbols and convex hulls: the non-hadrosaurid hadrosauroid grade (white circles), Hadrosauridae (triangles), Lambeosaurinae (blue filled triangle
online) and Saurolophinae (white filled triangles). The percentage proportional contributions to variance for the plotted axes with/without Calliez correction are: skull
(PC 1 9.1%/32.71%, PC 2 6.01%/16.82%) (A), facial bones (PC 1 8.76%/37.63%, PC 2 5.05%/15.5%) (B), crest-forming elements (PC 1 11.24%/50.7%, PC 2 3.69%/10.22%)
(C), mandible and teeth (PC 1 8.22%/39.05%, PC 2 4.52%/13.8%) (D), and the postcranial skeleton (PC 1 7.52%/28.55%, PC 2 6.26%/18.01%) (E). Plots illustrating the pro-
portional contribution to variance for all PCoA axes for each character partition are presented in the Supplementary Material (Supplementary Fig. S7). Silhouettes were created
by Pete Buchholz, Scott Hartman, and Iain Reid and were downloaded from http://phylopic.org (Creative Commons license CC BY 3.0).MORPHOLOGICAL INNOVATION IN HADROSAURID DINOSAURS 357
feeding-related characters from the jaws and complex and dynamic, but their postcranial
dentition, the non-hadrosaurid hadrosauroids skeleton became morphologically conserva-
show a more pronounced expansion along tive. Overall skull disparity was significantly
PCoA axis 1 compared with other anatomical greater in hadrosaurids than the paraphyletic
regions (Fig. 5D). In comparison, hadrosaurids grade of non-hadrosaurid hadrosauroids, but
are densely concentrated in a relatively limited the opposite was seen in the postcranial skel-
expanse of PCoA axis 1. This may explain the eton (Fig. 4).
reduced WMPD value for hadrosaurids in The role of morphological innovations dur-
this character subset (Fig. 4). Saurolophines ing evolutionary diversifications is a key topic
and lambeosaurines do differ in characters of in evolutionary biology (Simpson 1953; Briggs
the jaws and dentition, but this divergence is et al. 1992; Foote 1997; Benton 2015; Simões
seen on PCoA axis 2 (Fig. 5D). Similar morpho- et al. 2016; Rabosky 2017; Cooney et al. 2017).
space trends are seen in the postcranial skel- Our study suggests the hadrosaurid radiation
eton, where hadrosaurids do not show such was linked to both multiple bursts of innov-
expansive occupation along PCoA axis 1 and ation, which generated variety, and to a key
are densely concentrated (Fig. 5E). innovation, associated with low disparity.
This was revealed by dividing the skull into
Rates of Body-Size Evolution subunits, which highlighted contrasting evolu-
A heterogeneous rate (variable-rates) model tionary dynamics between the facial complex
for body-size evolution in hadrosauroids and crests and characters associated with the
received mixed support. Across the 400 ana- feeding apparatus (Figs. 3, 4, 5). We show that
lyzed Hedman-dated phylogenies, 37.5% high skull disparity was driven by the facial
showed very strong evidence for heterogeneity complex and crest-related characters. Both
(BFs > 10), 79.25% showed strong evidence (BFs these subunits have significantly greater dis-
> 5), and 92.75% showed positive evidence (BFs parity in hadrosaurids than in the paraphyletic
> 2). High-rate branches are rare, and they are grade of non-hadrosaurid hadrosauroids, and
concentrated at the terminal branches for Are- rate analyses pinpoint multiple phylogenetic
nysaurus, Shantungosaurus, and Tethyshadros branches where evolutionary innovation is
(Fig. 6). High-rate internal branches are seen accelerated. In contrast, mandibular and dental
in the clades containing Shantungosaurus, disparity is significantly reduced in hadrosaur-
Edmontosaurus regalis, and Edmontosaurus ids, when compared with their hadrosauroid
annectens, and Hypacrosaurus and Arenysaurus out-groups, and branch likelihood tests reveal
(Fig. 6). Body-size rate trends are consistent in just one high-rate branch at the base of Saurolo-
trees dated using the MBL scaling method phidae, the inclusive clade including all sauro-
(Supplementary Fig. S9). The support for het- lophines and lambeosaurines (Figs. 3, 4, 5).
erogeneous rates is comparable (36.25% BFs > Together, these analyses suggest that a signifi-
10, 76.75% BFs > 5, 90.75% BFs > 2). High rates cant burst of phenotypic evolution took place
are seen at the same terminal branches, and rela- on a single phylogenetic branch, leading to
tively slow evolutionary rates dominate. the development of the hadrosaurid feeding
apparatus, and was followed by limited subse-
quent changes or a slower pace of evolution,
Discussion
resulting in low variance.
Morphological Innovation and Hadrosaurid
Evolution The Hadrosaurid Feeding Apparatus
We show that hadrosaurid skull disparity Directly linking putative key innovations to
was achieved through a series of evolutionary successful clades is problematic (Rabosky
bursts driven by high evolutionary rates, both 2017). However, the trends reported here are
at the base of Hadrosauridae and at more consistent with those expected when a key
derived positions within lambeosaurines and innovation facilitates the invasion of a new
saurolophines (Figs. 2, 3). Our results also con- adaptive zone, leading to increased diversifica-
firm that hadrosauroid skull evolution was tion. Morphological changes that occurred358 THOMAS L. STUBBS ET AL. FIGURE 6. Rates of body-size evolution in hadrosauroids estimated using the variable-rates model in BayesTraits. Femur length was used as a proxy for hadrosauroid body mass. The cladogram is a consensus phylogeny showing the results from four separately analyzed MPTs, each with 100 dating replicates (a total of 400 Hedman-dated phylogenies). Phylogenetic branches are colored and scaled by estimates of the mean relative rate of body-size evolution (mean scalar parameter). Branch lengths represent the rate scale parameter, so longer branches equal faster rates. The histogram shows the distribu- tion of mean rates across all edges in the tree. See the Supplementary Material for Hedman-based results plotted separately for each MPT (Supplementary Fig. S8) and for results using the MBL dating method (Supplementary Fig. S9). Silhouettes were created by Scott Hartman and Iain Reid and were downloaded from http://phylopic.org (Creative Commons license CC BY 3.0). during the evolution of the hadrosaurid dental the different taxonomic scope of the studies battery and derived jaw mechanism would and the inclusion of mandibular characters in have resulted in more sophisticated oral food our data. processing, improving efficiency when process- Our result, that a key innovation is asso- ing tough vegetation, decayed wood, and even ciated with low variance-based disparity in crustaceans (Erickson et al. 2012; Leblanc et al. hadrosaurids, is perhaps counterintuitive, but 2016; Chin et al. 2017). This advantageous it may suggest that innovation could not sub- adaptation could have served as a catalyst for stantially diverge from the successful func- diversification. We show that rapid evolution- tional ideal, or the trend may result from ary rates occur on just one branch at the base high hadrosaurid diversity and morphospace of Saurolophidae (Fig. 3C). Saurolophids/ saturation (Figs. 4, 5). The morphospace trends hadrosaurids were incredibly diverse and had documented here show that innovation in high speciation rates in the latest Cretaceous hadrosaurid jaws and dentition was expressed when compared with the grade of non- on PCoA axis 2, but the group was densely hadrosaurid hadrosauroids and other ornitho- concentrated in a reduced area of morpho- pods (Prieto-Márquez 2010a; Strickson et al. space on the primary axis (PCoA axis 1) 2016; Sakamoto et al. 2016). Unlike Strickson (Fig. 5D). This apparent saturation pattern mir- et al. (2016), we did not identify a rate shift at rors the “morphospace packing” trend the base of saurolophines, most likely due to reported by Nordén et al. (2018), based on an
MORPHOLOGICAL INNOVATION IN HADROSAURID DINOSAURS                             359

analysis of dental and jaw disparity in all Cret-   Bell et al. 2014; Prieto-Márquez et al. 2015).
aceous herbivorous dinosaurs. When coupled          Other potential functions, such as thermoregu-
with high diversity, such morphospace satur-        lation, respiration, defense, and feeding, have
ation or packing can reduce disparity values        generally been ruled out (Hone et al. 2011).
for distance-based metrics (Fig. 4) (Nordén         Therefore, these species-specific structures
et al. 2018).                                       could have been important in driving speci-
                                                    ation through socio-sexual selection (Isles
Crest Innovations                                   2009). In the ancestral hadrosauroid condition,
   An important question in the evolutionary        the crest-forming bones make up the preorbital
history of dinosaurs, particularly in the hadro-    dorsal surface of the rostrum. In lambeosaur-
saurids, is how and why the great disparity of      ines and convergently in Saurolophini, pheno-
exaggerated cranial structures evolved (Hop-        typic innovations, such as bone lengthening,
son 1975; Evans et al. 2009; Evans 2010; Prieto-    migration, and rotation, resulted in crests that
Márquez and Wagner 2013; Gates et al. 2016;         rise significantly over the skull table. These
Knapp et al. 2018). Comparative anatomy has         transformations were associated with fast evo-
revealed the anatomical transformations             lutionary rates (Fig. 3B) and high disparity
involved in producing these complex struc-          (Figs. 4, 5), and they highlight a potential com-
tures. In hadrosaurids, extreme morphological       mon selection pressure for increasing the area,
transformations occurred in the premaxilla          visibility, and elaboration of the displayed
and nasal bones, involving significant caudal        structure (Prieto-Márquez et al. 2015). Socio-
and dorsal migration of facial elements (Evans      sexual selection has been widely reported as
2010; Prieto-Márquez and Wagner 2013; Prieto-       an important evolutionary driver (Panhuis
Márquez et al. 2015). Our study augments this,      et al. 2001; Maan and Seehausen 2011; Wagner
and places hadrosaurid crest evolution in a         et al. 2012; Knell et al. 2013). In non-
phylogenetic comparative context (Fig. 3B).         maniraptoriform theropods, the evolution of
We reveal multiple pulses of rapid phenotypic       bony cranial ornamentation has been linked
evolution. One rate shift is seen basally in lam-   to elevated rates of body-size evolution and
beosaurines, moving them away from the              gigantism (Gates et al. 2016). Elaborated orna-
ancestral condition and resulting in morpho-        mental plumage has been posited as an import-
space expansion (Fig. 5C). Further high-rate        ant factor in the diversification of Cretaceous
branches are recovered in more derived lam-         birds (Maia et al. 2013; O’Connor et al 2013).
beosaurines, at the base of the clade including     In pterosaurs, the development of large display
all members of the Parasaurolophini and Lam-        crests represents the major component of cra-
beosaurini, and again on the branch leading to      nial and mandibular disparity (Knell et al.
just Lambeosaurini (Fig. 3B). It is interesting     2013; Navarro et al. 2018).
that high rates in crest-associated characters
are also recovered in the Saurolophini. Mem-        Body Size and Postcranial Evolution
bers of this clade, Augustynolophus and Saurolo-       Body-size innovations were not an important
phus, evolved caudally projecting crests on the     factor in the radiation of hadrosauroids. Hadro-
skull roof, similar in gross morphology to          sauroid body-size evolution was not character-
those seen in some lambeosaurines (Fig. 1)          ized by bursts of rapid evolutionary change
(Prieto-Márquez et al. 2015). This implies that     on internal branches. Instead, rate heterogeneity
rapid evolutionary rates are important for pro-     is driven by three exceptional terminal taxa
ducing these exaggerated structures, a hypoth-      showing higher-rate excursions: Tethyshadros,
esis that could be explored further in other        Arenysaurus, and Shantungosaurus (Fig. 6).
vertebrate groups.                                  Tethyshadros and Arenysaurus are smaller-
   What was the potential significance of crest      bodied species and have been identified as insu-
innovations in driving hadrosaurid diversity?       lar dwarfs (Dalla Vecchia 2009; Cruzado-
It is well supported that hadrosaurid crests        Caballero et al. 2015). Shantungosaurus is a
were display structures and most likely func-       gigantic saurolophine (body mass estimated at
tioned as intraspecific displays (Evans 2010;        17,400 kg), and one of the largest ornithischians
360 THOMAS L. STUBBS ET AL.
known (Benson et al. 2018). Previous quantita- postcranial skeleton in neoceratopsians is mor-
tive studies of dinosaurian body-size evolution phologically conservative (Dodson et al. 2004).
have documented high-rate shifts more basally Future studies incorporating evolutionary rate
in Ornithopoda. This occurred during the Mid- and disparity analyses for ceratopsians and
dle to Late Jurassic in iguanodontians, long pre- other archosaurs may uncover similar dynamics
ceding the radiation of hadrosaurids in the Late to those reported here and provide further
Cretaceous (Benson et al. 2014, 2018). insights into the evolution of adaptive and non-
Saurolophines differ from lambeosaurines in adaptive morphological innovations.
displaying accelerated rates of postcranial evo-
lution ancestrally on a single branch (Fig. 2B).
Acknowledgments
This is congruent with anatomical observations
that suggest further transformations occurred Many thanks to G. Lloyd, M. Puttick, and
in certain postcranial regions in saurolophines C. Venditti for methodological advice. We
that did not take place in lambeosaurines. For thank the reviewers for their constructive input
example, the lambeosaurine ischium is notable and guidance. This work was funded by NERC
for possessing a thumb-shaped process for grant NE/I027630/1 and ERC grant 788203
articulating with the ilium and a “boot-like” (INNOVATION) to M.J.B. and T.L.S., and
process at the end of the ischial shaft (Brett- NERC grant NE/L002434/1 to A.E. A.P.-M.
Surman and Wagner 2007). These features are was funded by a Marie Curie Intra-European
absent in saurolophines but present in the out- Fellowship for Career Development grant (Euro-
groups. Therefore, the absence of these charac- pean Commission, Research and Innovation),
ters in saurolophines is the derived condition, the Generalitat de Catalunya (CERCA Program),
while lambeosaurines exemplify a retention of and the Ramón y Cajal program from the Minis-
these features with little modification. terio de Economía, Industria y Competitividad
del Gobierno de España (RyC-2015-17388).
Future Directions
Hadrosaurid macroevolution shows many Literature Cited
interesting parallels to ceratopsians, particularly
Baker, J., A. Meade, M. Pagel, and C. Venditti. 2016. Positive
the derived larger-bodied quadrupedal ceratop- phenotypic selection inferred from phylogenies. Biological Jour-
sids (Ceratopsidae). Ceratopsids were also nal of the Linnean Society 118:95–115.
important components of Late Cretaceous ter- Bapst, D. W. 2014. Assessing the effect of time-scaling methods on
phylogeny-based analyses in the fossil record. Paleobiology
restrial ecosystems, particularly in western 40:331–351.
North America (Lyson and Longrich 2011). Cer- Barrett, P. M. 2014. Paleobiology of herbivorous dinosaurs. Annual
atopsids experienced a rapid radiation in the Review of Earth and Planetary Sciences 42:207–230.
Bell, P., F. Fanti, P. Currie, and V. Arbour. 2014. A mummified
Late Cretaceous, with fast speciation rates and duck-billed dinosaur with a soft-tissue cock’s comb. Current Biol-
high taxic diversity (Dodson et al. 2004; Saka- ogy 24:70–75.
moto et al. 2016). They share ecomorphological Bell, P. R., E. Snively, and L. Shychoski. 2009. A comparison of the
jaw mechanics in hadrosaurid and ceratopsid dinosaurs using
characteristics in the jaw (Bell et al. 2009), and finite element analysis. Anatomical Record 292:1338–1351.
ceratopsids evolved a distinctive slicing denti- Benjamini, Y., and Y. Hochberg. 1995. Controlling the false discov-
tion with complex tissues, aiding the processing ery rate: a practical and powerful approach to multiple testing.
Journal of the Royal Statistical Society B 57:289–300.
of tough plant materials (Erickson et al. 2015). Benson, R. B. J., N. E. Campione, M. T. Carrano, P. D. Mannion,
Ceratopsids also possessed conspicuous and C. Sullivan, P. Upchurch, and D.C. Evans. 2014. Rates of dino-
highly disparate cranial ornamentation in the saur body mass evolution indicate 170 million years of sustained
ecological innovation on the avian stem lineage. PLoS Biology 12:
form of nasal and postorbital horns and caudo- e1001853. doi: 10.1371/journal.pbio.1001853.
dorsally expanded parieto-squamosal frills Benson, R. B. J., G. Hunt, M. T. Carrano, and N. Campione. 2018.
(Brown and Henderson 2015). These structures Cope’s rule and the adaptive landscape of dinosaur body size
evolution. Palaeontology 61:13–48.
likely functioned as displays in socio-sexual sig- Benton, M. J. 2015. Exploring macroevolution using modern and
naling (Hone et al. 2011; Brown and Henderson fossil data. Proceedings of the Royal Society of London B
2015; Knapp et al. 2018), as well as in combat 282:20150569. doi: 10.1098/rspb.2015.0569.
Brett-Surman, M. K., and J. R. Wagner. 2007. Discussion of charac-
and for the attachment of jaw musculature ter analysis of the appendicular anatomy in Campanian and
(Maiorino et al. 2017). As in hadrosaurids, the Maastrichtian North American hadrosaurids—variation andMORPHOLOGICAL INNOVATION IN HADROSAURID DINOSAURS 361 ontogeny. Pp. 135–169 in K. Carpenter, ed. Horns and beaks: cera- sensorineural perspective on cranial crest function. Anatomical topsian and ornithopod dinosaurs. Indiana University Press, Record 292:1315–1337. Bloomington. Foote, M. 1997. The evolution of morphological diversity. Annual Briggs, D. E. G., R. A. Fortey, and M. A. Wills. 1992. Morphological Review of Ecology, Evolution, and Systematics 28:129–152. disparity in the Cambrian. Science 256:1670–1673. Gates, T. A., C. Organ, and L. E. Zanno. 2016. Bony cranial orna- Brown, C., and D. Henderson. 2015. A new horned dinosaur mentation linked to rapid evolution of gigantic theropod dino- reveals convergent evolution in cranial ornamentation in Cera- saurs. Nature Communications 7:12931. topsidae. Current Biology 25:1641–1648. Hedman, M. M. 2010. Constraints on clade ages from fossil out- Brusatte, S. L., G. T. Lloyd, S. C. Wang, and M. A. Norell. 2014. groups. Paleobiology 36:16–31. Gradual assembly of avian body plan culminated in rapid rates Herrera‐Flores, J. A., T. L. Stubbs, and M. J. Benton. 2017. Macro- of evolution across the dinosaur–bird transition. Current Biology evolutionary patterns in Rhynchocephalia: is the tuatara (Spheno- 24:2386–2392. don punctatus) a living fossil? Palaeontology 60:319–328. Butler, R. J., P. M. Barrett, P. Kenrick, and M. G. Penn. 2009. Diver- Hone, D. W. E., D. Naish, and I. C. Cuthill. 2011. Does mutual sex- sity patterns amongst herbivorous dinosaurs and plants during ual selection explain the evolution of head crests in pterosaurs the Cretaceous: implications for hypotheses of dinosaur/ and dinosaurs? Lethaia 45:139–156. angiosperm co‐evolution. Journal of Evolutionary Biology Hopkins, M. J. 2016. Magnitude versus direction of change and the 22:446–459. contribution of macroevolutionary trends to morphological dis- Butler, R. J., J. Liyong, C. Jun, and P. Godefroit. 2011. The postcra- parity. Biological Journal of the Linnean Society 118:116–130. nial osteology and phylogenetic position of the small ornithis- Hopkins, M. J., and A. B. Smith. 2015. Dynamic evolutionary chian dinosaur Changchunsaurus parvus from the Quantou change in post-Paleozoic echinoids and the importance of scale Formation (Cretaceous: Aptian–Cenomanian) of Jilin Province, when interpreting changes in rates of evolution. Proceedings of north-eastern China. Palaeontology 54:667–683. the National Academy of Sciences USA 112:3758–3763. Cailliez, F. 1983. The analytical solution of the additive constant Hopson, J. A. 1975. The evolution of cranial display structures in problem. Psychometrika 48:305–308. hadrosaurian dinosaurs. Paleobiology 1:21–43. Carrano, M. T. 2006. Body size evolution in the Dinosauria. Pp. Horner, J. R., D. B. Weishampel, and C. A. Forster. 2004. Hadro- 225–268 in M. T. Carrano, T. J. Gaudin, R. W. Blob, and J. sauridae. Pp. 438–463 in D. B. Weishampel, P. Dodson, and R. Wible, eds. Amniote paleobiology: perspectives on the evolu- H. Osmolska, eds. The Dinosauria. University of California tion of mammals, birds, and reptiles. University of Chicago Press, Berkeley. Press, Chicago, Ill. Isles, T. E. 2009. The socio-sexual behaviour of extant archosaurs: Chin, K., R. M. Feldmann, and J. N. Tashman. 2017. Consumption implications for understanding dinosaur behaviour. Historical of crustaceans by megaherbivorous dinosaurs: dietary flexibility Biology 21:139–214. and dinosaur life history strategies. Scientific Reports 7:11163. Knapp, A., R. J. Knell, A. A. Farke, M. A. Loewen, and doi: 10.1038/s41598-017-11538-w. D. W. E. Hone. 2018. Patterns of divergence in the morphology Close, R. A., M. Friedman, G. T. Lloyd, and R. B. J. Benson. 2015. of ceratopsian dinosaurs: sympatry is not a driver of ornament Evidence for a mid-Jurassic adaptive radiation in mammals. Cur- evolution. Proceedings of the Royal Society of London B rent Biology 25:2137–2142. 285:20180312. doi: 10.1098/rspb.2018.0312. Cooney, C. R., J. A. Bright, E. J. R. Capp, A. M. Chira, E. C. Hughes, Knell, R. J., D. Naish, J. L. Tomkins, and D. W. E. Hone. 2013. Sexual C. J. A. Moody, L. O. Nouri, Z. K. Varley, and G. H. Thomas. selection in prehistoric animals: detection and implications. 2017. Mega-evolutionary dynamics of the adaptive radiation of Trends in Ecology and Evolution 28:38–47. birds. Nature 542:344–347. Knell, R. J., and S. Sampson. 2011. Bizarre structures in dinosaurs: Cruzado-Caballero, P., J. Fortuny, S. Llacer, and J. I. Canudo 2015. species recognition or sexual selection? A response to Padian and Paleoneuroanatomy of the European lambeosaurine dinosaur Horner. Journal of Zoology 283:18–22. Arenysaurus ardevoli. PeerJ 3:e802. doi: 10.7717/peerj.802. Laurin, M. 2004. The evolution of body size, Cope’s rule and the Cuthbertson, R. S., A. Tirabasso, N. Rybczynski, and R. B. Holmes. origin of amniotes. Systematic Biology 53:594–622. 2012. Kinetic limitations of intracranial joints in Brachylopho- Leblanc, A. R. H., R. R. Reisz, D. C. Evans, and A. M. Bailleul. 2016. saurus canadensis and Edmontosaurus regalis (Dinosauria: Hadro- Ontogeny reveals function and evolution of the hadrosaurid sauridae), and their implications for the chewing mechanics of dinosaur dental battery. BMC Evolutionary Biology 16:152. hadrosaurids. Anatomical Record 295:968–979. Lloyd, G. T. 2016. Estimating morphological diversity and tempo Dalla Vecchia, F. M. 2009. Tethyshadros insularis, a new hadrosaur- with discrete character‐taxon matrices: implementation, chal- oid dinosaur (Ornithischia) from the Upper Cretaceous of Italy. lenges, progress, and future directions. Biological Journal of the Journal of Vertebrate Paleontology 29:1100–1116. Linnean Society 118:131–151. Dodson, P., C. A. Forster, and S. D. Sampson. 2004 Ceratopsidae. Lloyd, G. T., K. E. Davis, D. Pisani, J. E. Tarver, M. Ruta, Pp. 494–513 in D. B. Weishampel, P. Dodson, and H. Osmolska, M. Sakamoto, D. W. E. Hone, R. Jennings, and M. J. Benton. eds. The Dinosauria. University of California Press, Berkeley. 2008. Dinosaurs and the Cretaceous terrestrial revolution. Pro- Erickson, G. M., B. A Krick, M. Hamilton, G. R. Bourne, M. ceedings of the Royal Society of London B 275:2483–2490. A. Norell, E. Lilleodden, and W. G. Sawyer. 2012. Complex den- Lloyd, G. T., S. C. Wang, and S. L. Brusatte. 2012. Identifying het- tal structure and wear biomechanics in hadrosaurid dinosaurs. erogeneity in rates of morphological evolution: discrete character Science 338:98–101. change in the evolution of lungfish (Sarcopterygii; Dipnoi). Evo- Erickson, G. M., M. A. Sidebottom, D. I. Kay, K. T. Turner, N. Ip, M. lution 66:330–348. A. Norell, W. G. Sawyer, and B. A. Krick. 2015. Wear biomechan- Lloyd, G. T., D. W. Bapst, M. Friedman, and K. E. Davis. 2016. Prob- ics in the slicing dentition of the giant horned dinosaur Tricera- abilistic divergence time estimation without branch lengths: dat- tops. Science Advances 1:e1500055. doi: 10.1126/sciadv.1500055. ing the origins of dinosaurs, avian flight and crown birds. Biology Evans, D. C. 2010. Cranial anatomy and systematics of Hypacro- Letters 12:20160609. doi: 10.1098/rsbl.2016.0609. saurus altispinus, and a comparative analysis of skull growth in Lyson, T. R., and N. R. Longrich. 2011. Spatial niche partitioning in lambeosaurine hadrosaurids (Dinosauria: Ornithischia). Zoo- dinosaurs from the latest Cretaceous (Maastrichtian) of North Amer- logical Journal of the Linnean Society 159:398–434. ica. Proceedings of the Royal Society of London B 278:1158–1164. Evans, D. C., R. Ridgely, and L. M. Witmer. 2009. Endocranial anat- Maan, M. E., and O. Seehausen. 2011. Ecology, sexual selection and omy of lambeosaurine hadrosaurids (Dinosauria: Ornithischia): a speciation. Ecology Letters 14:591–602.
You can also read