Assessing sandfish population stocks within the south coast of Manus, and a summary report of sandfish connectivity field research
←
→
Page content transcription
If your browser does not render page correctly, please read the page content below
Assessing sandfish population stocks within the south
 coast of Manus, and a summary report of sandfish
                 connectivity field research

     Technical report of a survey conducted from May 19-June 27, 2014

           By David A. Feary, Richard Hamilton, Manuai Matawai,
                Chris Molai, Maunoa Karo and Glenn Almany.
ASSESSING SANDFISH POPULATION STOCKS WITHIN THE
SOUTH COAST OF MANUS, AND A SUMMARY REPORT OF
     SANDFISH CONNECTIVITY FIELD RESEARCH
            MAY 19 - JUNE 27, 2014

                 FINAL REPORT

  DAVID A. FEARY, RICHARD HAMILTON, MANUAI
  MATAWAI, CHRIS MOLAI, MAUNOA KARO, GLENN
                    ALMANY
CONTACT DETAILS:

David Feary
Assistant Professor
School of Life Sciences
University of Nottingham
United Kingdom
Email: David.Feary@nottingham.ac.uk

Richard Hamilton,
Senior Melanesia Scientist
The Nature Conservancy Asia Pacific Division
245 Riverside Drive
West End, QLD 4101
Australia
Email: rhamilton@tnc.org

Manuai Matawai
Manus Field Office
The Nature Conservancy
PO Box 408,
Lorengau, Manus Province,
Papua New Guinea
Email: mmatawai@tnc.org

Cover Photo: Juvenile sandfish (Holothuria scabra).

                                               ii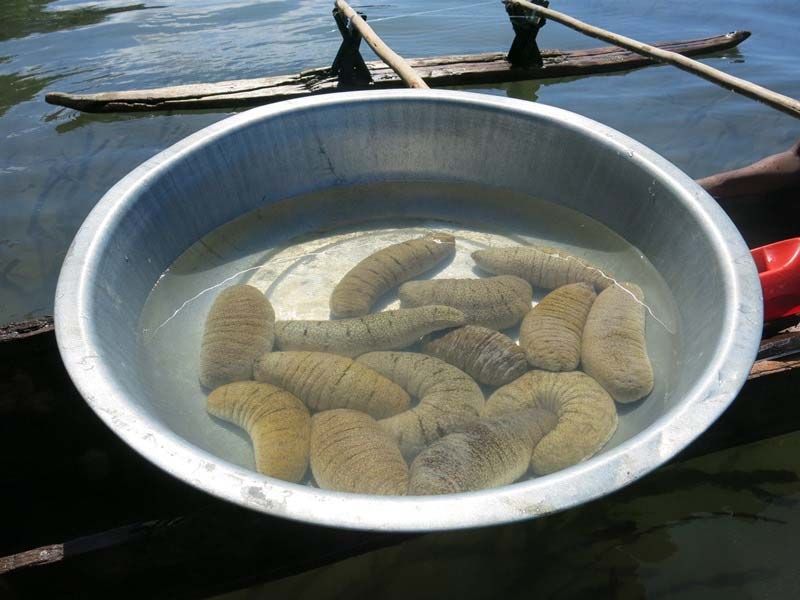
ACKNOWLEDGEMENTS

We would like to acknowledge the following members of the sandfish survey team: Polin
Chapokat, Paul Karamen, Rabbie Kanamon, Robert Maiah. Mendennis Kanawi, Pondros Lokes,
Polin Manuai, Cholia Pochalon, Pokakes Pondraken, Ron Ponowan, Gai Samol and Paul Tapas.
We also thank Dr. Pongie Kichawen, Director of the Manus Environment and Community
Conservation Network (MECCN) and Luanah Yaman, National Fisheries Authority Sedentary
Fisheries Manager for logistical support. We express our thanks to the Mwanus Endras Asi
Resource Development Network, the community members of Mbunai, Pere, Locha, Tawi,
Timoenai and M’buke and the Manus Provincial Government for supporting this work. Finally,
we thank Tien Nguyen and Nate Peterson for GIS and mapping support. Funding for this work
was provided by the David and Lucile Packard Foundation and the Papua New Guinea
National Fisheries Authority

                                            iii
TABLE OF CONTENTS
SUMMARY ...................................................................................................................................................... 5
SECTION 1: SEA CUCUMBER ASSESSMENTS, CONNECTIVITY RESEARCH AND FISHERIES
MANAGEMENT WITHIN PAPUA NEW GUINEA .................................................................................. 7
  1. INTRODUCTION........................................................................................................................................................ 7
  1.1 DECENTRALIZATION OF SEA CUCUMBER MANAGEMENT ................................................................................. 7
  1.2 MAIN AIMS OF WORK .......................................................................................................................................... 8
PART 1: STOCK ASSESSMENT OF SANDFISH POPULATIONS ACROSS THE SOUTHERN
COAST OF MANUS ........................................................................................................................................ 9
  2. AIM OF WORK: UNDERTAKE A RIGOROUS STOCK ASSESSMENT OF SANDFISH POPULATIONS THROUGHOUT
  THE SEVEN CUSTOMARY MARINE TENURE AREAS WITHIN THE MANUS E NDRAS TRIBAL NETWORK. .............. 9
  2.1 HIGH VALUE SEA CUCUMBER SPECIES USED WITHIN THIS STUDY - SANDFISH (HOLOTHURIA SCABRA)....... 9
  2.3 METHODS OF POPULATION ASSESSMENT ........................................................................................................10
  2.4 RESULTS ..............................................................................................................................................................19
  2.5 ESTIMATE OF TOTAL POPULATION ...................................................................................................................25
  2.6 AVERAGE MARKET VALUE OF ADULT SANDFISH WITHIN PERE: SHORT CASE STUDY ...................................30
  2.7 DISCUSSION .........................................................................................................................................................34
  2.8 DENSITY AND SIZE STRUCTURE OF SANDFISH POPULATIONS .........................................................................34
  2.9 RECOMMENDATIONS ..........................................................................................................................................35
PART 2: CONNECTIVITY RESEARCH – PRELIMINARY RESULTS OF FIELDWORK............... 37
 3. AIM OF WORK: DETERMINE THE SPATIAL SCALE OF LARVAL DISPERSAL AND ITS ROLE IN REPLENISHING
 LOCAL STOCKS OF THE COMMERCIALLY IMPORTANT SEA CUCUMBER, SANDFISH (HOLOTHURIA SCABRA),
 WITHIN AND ACROSS TRIBAL BOUNDARIES ALONG THE SOUTHERN COASTLINE OF MANUS ISLAND. ............... 37
 3.1 METHODS AND PRELIMINARY RESULTS OF SAMPLING ....................................................................................37
SECTION 2 REVIEW OF THE LITERATURE ON FISHERIES OF SEA CUCUMBER GLOBALLY
AND WITHIN PAPUA NEW GUINEA .................................................................................................... 44
  4. THE GLOBAL IMPORTANCE OF THE SEA CUCUMBER FISHERY ...........................................................................44
  4.1 GENERAL IMPACTS OF FISHING ON SEA CUCUMBERS ......................................................................................45
  4.2 MANAGEMENT MEASURES FOR SEA CUCUMBER FISHERIES GLOBALLY .........................................................45
  4.3 THE IMPORTANCE OF SEA CUCUMBERS TO PAPUA NEW GUINEA ..................................................................46
  4.4 MANAGEMENT MEASURES WITHIN PAPUA NEW GUINEA ..............................................................................47
  4.5 CURRENT NATIONAL POLICY FRAMEWORK ......................................................................................................47
  4.6 DATA COLLECTION IN SUPPORT OF THE REVISED MANAGEMENT PLAN ........................................................49
5. REFERENCES.......................................................................................................................................... 51

                                                                                     1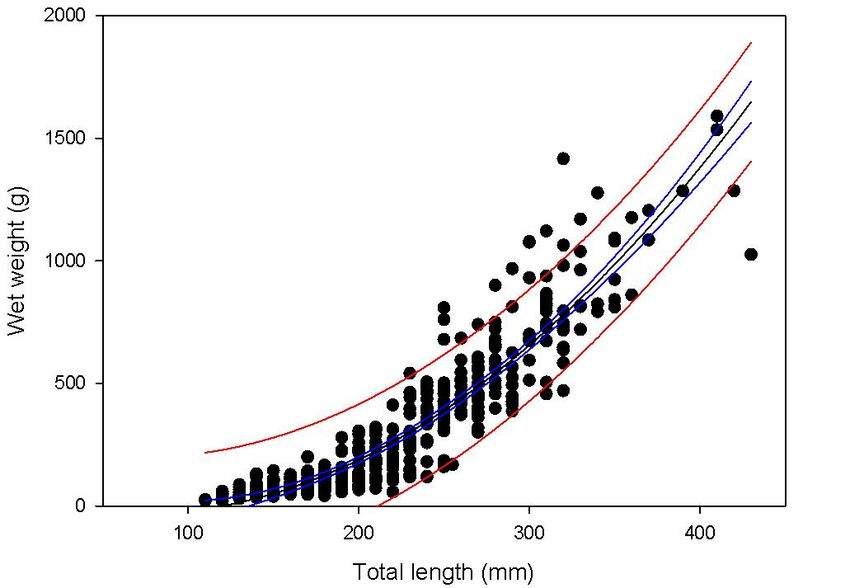
LIST OF FIGURES
Fig 1a Survey sites for stock assessments undertaken within the eastern part of Southern
Manus, with site names listed in white.

Fig 1b Survey sites for stock assessments undertaken within the western and southern parts
of Southern Manus, with site names listed in white.

Fig 2 Average density of sandfish (± SE) per 100m2 at seven villages in the Manus E Ndras
Tribal Network within shallow seagrass habitats (≤2m), and within Pere within deep
sand/silt habitats (≥3m). Note: no sandfish were found within transects at both Locha and
Ndrova.

Fig 3 Average density of juvenile (≤21cmTL) and adult (≥22cm TL) sandfish (± SE) within
100m2 transects within shallow seagrass habitats (≤2m) and within deep sand/silt habitats
(≥3m). Black bars signify juvenile sized individuals (≤21cmTL); white bars signify adult sized
individuals (≥22 cmTL). Note: no sandfish were found within transects at both Locha and
Ndrova.

Fig 4 Size structure of sandfish populations within shallow seagrass habitat (≤2m depth)
across 5 villages (a) Mbunai, Pere, Tawi and (b) Timoenai, M’buke. Black bars signify juvenile
sized individuals (≤21cmTL), white bars signify adult sized individuals (≥22 cmTL) Please
note: No sandfish were present in transects at 2 villages, Locha and Ndrova. Data presented is
abundance of sandfish pooled across all transects at each village.

Fig 5 Size structure of sandfish populations within deep sand/silt habitat (≥3m depth) within
Pere (Please note: Pere was the only village in which surveys of sandfish were undertaken in
deep sand/silt habitat). Black bars signify juvenile sized individuals (≤21cmTL); white bars
signify adult sized individuals (≥22 cmTL). Data presented is abundance of sandfish pooled
across all transects at each village.

Fig 6 Density per hectare (± SE) of juvenile (≤21cmTL) and adult sandfish (≥22cm TL) within
shallow seagrass habitats (≤2m) and deep sand/silt habitats (≥3m). Note: no sandfish were
found within transects at both Locha and Ndrova.

Fig 7 Average density of sandfish (± SE) in shallow seagrass habitat within 100m2 transects
during both night-time (i.e., surveyed between 2000 and 0100) and day time (i.e., surveyed
between 1500 and 1600). Note: ‘Night Survey’ and ‘Day Survey’ correspond to the average
density per 100m2 across all transects when lumped, while ‘M’buke Night Survey’, ‘Pere Night
Survey’, ‘M’buke Day Survey’ and ‘Pere Day Survey’ correspond to the average density per
100m2 of sandfish within each village.
Fig 8 Satellite map of suitable habitat for sandfish throughout the southern Manus coastline.
See legend for details of each habitat quantified.
Fig 9 Estimate of average density (± SE) of each size class (Adult [white box], Juvenile [black
box]) across full extent of suitable area within each village (M’buke, Mbunai, Pere, Tawi,

                                                2
Timoenai), within each of three habitat types (Shallow seagrass, Sparse seagrass, Deep
sand/silt). Note: no sandfish were found within transects at both Locha and Ndrova.
Fig 10 Relationship between total length (mm) and wet weight (g) for unprocessed sandfish
within Manus coastline (n = 415 individuals, adjusted R2 = 0.86). Blue lines are 95% CI around
mean, red lines are 95% prediction values.
Fig 11 Estimate of total wet weight (unprocessed) of adult sandfish (≥22cm TL) found
throughout total suitable habitat within villages, between each of three habitats types
(Shallow seagrass, Sparse seagrass, Deep sand/silt). NB. No sandfish were found within Locha
Village or Ndrova Island.
Fig 12 Estimate of total dry weight (processed) of adult sandfish (≥22cm TL) found
throughout total suitable habitat within villages, between each of three habitats types
(Shallow seagrass, Sparse seagrass, Deep sand/silt). NB. No sandfish were found within Locha
Village or Ndrova Island.
Fig 13 Estimate of total value (USD per kilo processed) of adult sandfish (≥22cm TL) found
throughout total suitable habitat within villages, between each of three habitats types
(Shallow seagrass, Sparse seagrass, Deep sand/silt). NB. No sandfish were found within Locha
Village or Ndrova Island.
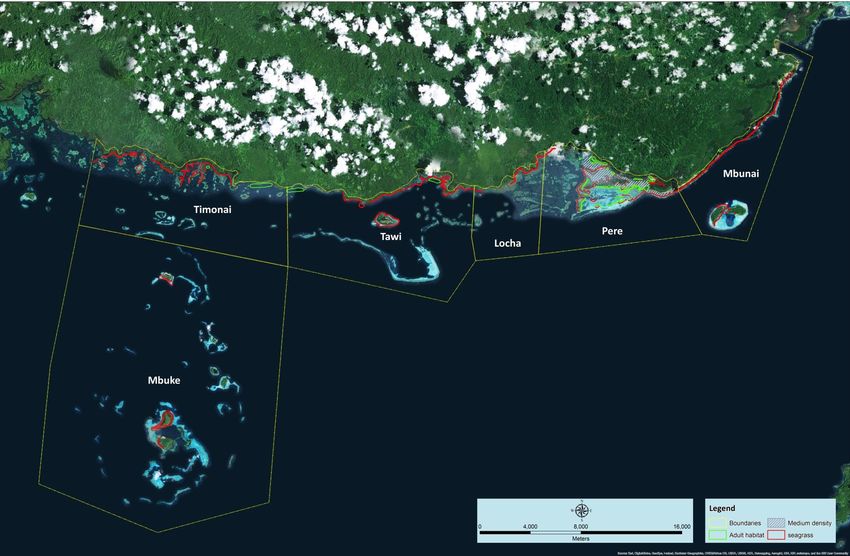
Fig 14 Map of sampled areas for sandfish (H. scabra) tissue, with village and site names. The
village name and the numbers of both adult and juvenile samples collected from each village
are given in red. Sites within each village from which individuals were sampled are in white.
3LIST OF TABLES
Table 1 Common Name, Scientific Name, the estimated average Purchase Prices that were
paid for various grades of dried sea cucumber across the western and central Pacific over the
past decade (Adapted from Crick et al. 2013). Purchase prices are shown in USD per kg, (dried
form), the Product Value is grouped by price bracket (H = high; M = medium; L = low; VL =
very low).
Table 2 Date, Local-Level Government, Village, Site, Habitat, Depth (m), Visibility (m) and the
number of 100m2 visual transects surveyed for Sandfish (Holothuria scabra) across the
southern Manus coastline.
Table 3 Comparison of sandfish (H. scabra) densities between day and night surveys. Date,
Village, Site, Survey time (Day or Night), Depth, Visibility and the number of 100m2 visual
transects surveyed for sandfish (H. scabra) across the southern Manus coastline.
Table 4 Estimate of total suitable sandfish habitat within each village across the southern
Manus coastline and total number of juvenile and adult sandfish in the total available habitat
(encompassing Shallow seagrass, Sparse seagrass and Deep sand/silt habitats where
surveyed).
Table 5 Village, Site, Site GPS coordinates and Total number of tissue samples collected for
adult and juvenile sandfish.
Table 6 Value Grade, common name, scientific name and minimum size restrictions for
Papua New Guinea sea cucumbers. (From PNG National Bêche-de-mer Fishery Management
Plan - Final Draft (2013) National Fisheries Authority October 2013-National Marine
Advisory Council Endorsed).
4SUMMARY
Despite the importance of the sea cucumber trade in terms of foreign revenue generation for
PNG and cash income for local fishers, stock collapse nationally led to a nationwide closure
coming into force from 2009. There is now increasing interest in examining the role of locally
based management strategies in sustaining sea cucumber populations. The present work was
undertaken in support of the decentralisation of sea cucumber fisheries within Papua New
Guinea, and encompassed two major goals: a rigorous stock assessment of the density and
status of a sea cucumber population, and an understanding of larval dispersal between and
connectivity among populations.
This work focused on the high value sea cucumber, the Sandfish (Holothuria scabra), and
accomplished a stock assessment of the populations throughout the southern coast of Manus,
while also collecting tissue samples from both adult and juvenile sandfish throughout this
region. This project worked closely with the Manus E Ndras Tribal Network within southern
Manus Island, Manus Province, with local fishers from the seven Council of Chief areas —
Nauna Asi, Polobuli Asi, Mouk Asi, M’buke Asi, Tawi Asi, Pere Asi and Mbunai Asi actively
taking part. This represented a significant training and community co-management
opportunity.
Sandfish are very high value, being purchased from fishers throughout the western and
central pacific at an average of US$90 per kilo and retailing in Hong Kong for up to US$1,668
per kilo. Due to their high value and shallow distribution, populations are estimated to have
declined by more than 90% in at least 50% of their range, leading to this species being listed
as ‘Endangered’ on the IUCN Red List in 2010.
Survey results indicate that sandfish populations within the southern Manus region have
shown considerable recovery since the 2009 moratorium and were dominated by juvenile
size classes. In consultation with fishers from southern Manus that partook in the present
study, there was general agreement that heavy fishing pressure on sandfish populations had
resulted in sandfish densities being exceptionally low across the southern Manus region prior
to the 2009 moratorium.
Although densities of sandfish fluctuated between villages across the southern Manus region,
average densities per hectare in shallow seagrass habitat were relatively high (from 192 to
422 individuals per hectare), and are on par with areas that have begun experimental, small-
scale fishing (i.e., Warrior Reefs within Torres Strait, Murphy et al 2012).
There was a dominance of immature sandfish individuals (≤21cm TL) throughout surveys, an
indication of heavy historical fishing pressure and recovery from 2009 onwards. Any further
harvesting of sandfish within this region should be restricted to the harvest of individuals that
are larger than the minimum size for maturity.
There was a clear demarcation in the size class of sandfish individuals, associated with habitat
availability. The majority of immature sandfish were observed using shallow, seagrass
5habitats (~1-2m in depth), whereas the largest mature sandfish (≥30cm TL) were
predominantly found in low abundances within sand/silt habitat at depths below ~3m. We
recommend that the protection of such mature stocks (which are the primary spawning
stock) is vital, and could be implemented by the use of permanent harvesting closures within
the deep habitats (sand/silt habitats).
As the majority of historical surveys for sandfish have been accomplished during the day, we
undertook and compared densities of sandfish between day and night. We found significantly
more individuals – more than twice as many – observed at night. We suggest that night
surveys should be included in future sandfish stock assessments, which will improve accuracy
in determining stock status.
We estimated the total number of juvenile and adult sandfish in the seagrass within each
customary area (Mbunai, Pere, Tawi, Timoenai and M’buke - no sandfish were sighted at
Locha or Ndrova) by taking the mean densities sighted on transects in each of these five areas
(per m2) and multiplying this estimate by the total available habitat present in each
customary area. Pere and Timoenai had the highest populations of sandfish, with an estimated
91,050 juveniles and 35,771 adults located within the Pere seagrass, and an estimated 56,582
juveniles and 15,166 adults located within the Timoenai seagrass.
This work has shown the importance of stock assessments in quantifying the densities and
size structure of sandfish populations within the southern Manus region. We recommend that
yearly assessments of the status of sandfish stocks throughout Manus are undertaken, and
include both NFA staff members and trained local fishers.
To determine the degree of self-recruitment of sandfish (H. scabra) populations within Pere,
and larval dispersal out of this area 6,465 individual sandfish were collected and a small 2cm
X 2cm piece of body wall tissue collected (all individuals were then replaced in the area
collected).
Tissue samples were collected from 57 sites from 15km to the west of Pere (i.e., Pamachau
Island), 38km east of Pere (i.e., Timoenai) and 21 km south of Timoenai (i.e., M’buke Island).
All samples have been sent to the King Abdullah University of Science and Technology
(KAUST), Saudi Arabia for on-going genetic parentage analysis.
6SECTION 1: SEA CUCUMBER ASSESSMENTS, CONNECTIVITY RESEARCH AND
FISHERIES MANAGEMENT WITHIN PAPUA NEW GUINEA
1. INTRODUCTION
The combination of high value and ease of capture has meant that the majority of sea
cucumber fisheries in Papua New Guinea are now severely overfished (Kinch et al. 2008b).
There were signs of overfishing, and ‘boom and bust’ cycles within the PNG sea cucumber
fishery from the beginning of the latest boom period in the late 1980s. For example, Lokani
(1989) found only a single species of sea cucumber (Holothuria scabra; sandfish) was
harvested for the first seven months of the Tigak Island bêche-de-mer fishery, before stocks of
this species steeply declined and then crashed over a 4-month period. As sandfish catches
declined other high value sea cucumber species, followed by progressively lower value sea
cucumber species were added to the catch, and these species also followed the same ‘boom
and bust’ cycles of high catch production followed by a precipitous and quick decline in stocks
(Lokani 1989). In addition, surveys (reported in Kinch et al. 2008b) showed that sea
cucumber stocks were relatively depleted throughout Papua New Guinea. In the Milne Bay
Province, Skewes et al. (2002) reported low densities of commercial holothurians (average of
21 ind. ha-1), while low survey densities and a comparison of historical and recent catch data
indicated that H. scabra and H. whitmaei populations were grossly overexploited by 2008
(Kinch et al. 2008b). In New Ireland Province, sparse populations were observed of H. scabra
up to 2008. More recently, Hamilton and Lokani (2011) compared changes in populations of
sea cucumbers on reef flats around Buka Island in the Autonomous Region of Bougainville in
1992 and 2008 and found that the abundances of the six most dominant sea cucumber species
had declined to 1-5 percent of former abundances over this 16-year period. This trend in
stock collapse was repeated throughout all other coastal provinces within PNG, and led to a
nationwide closure coming into force from 2009.
1.1 DECENTRALIZATION OF SEA CUCUMBER MANAGEMENT
Despite the importance of the sea cucumber trade in terms of foreign revenue generation for
PNG and cash income for local fishers, this fishery faces many management and monitoring
issues. Within PNG there is now increasing interest in examining the role of locally based
management strategies in sustaining sea cucumber populations, with such interest buoyed by
the relatively ineffective top-down management that has permeated management of sea
cucumber stocks. Such changes would decentralise the management of the sea cucumber
fishery to the provinces, Local Level Governments (LLGs) and communities within PNG.
Papua New Guinea’s seascape is suitable for developing more effective management of sea
cucumbers. Customary Marine Tenure - the informal rights-based framework for site-based
fisheries management in Papua New Guinea - evolved rapidly in response to the need to
control access to valuable commodities such as sea cucumbers several hundred years ago
(Kinch et al 2008b). The vast majority of community-based marine protected areas in Papua
7New Guinea have been established as a fisheries management tool, with the primary goal
being to allow sea cucumber stocks the chance to recover (Kinch 2004).
Decentralisation of sea cucumber management must also be supported by rigorous and
regular stock assessments of the density and health of sea cucumber populations at both the
community and regional levels. Such stock assessments provide managers with a rapid
overview of the current state of sea cucumber populations within their regions, while also
allowing the evaluation of resources in selected sites, populations and species. By undertaking
regular assessments, managers are also able to actively compare stock sizes and densities
between management regions, allowing for an evaluation of current community management
measures against national and provincial measures. Lastly, regular assessments result in local
and regional capacity building through the training of surveyors to undertake sea cucumber
stock assessments.
One of the major impediments to the decentralisation of management to sustain sea
cucumber populations is an understanding of larval dispersal between and connectivity
among populations. Genetic studies indicate that large-scale larval dispersal exists for some
species (Holothuria nobilis and H. scabra: Uthicke and Benzie 2001; Stichopus chloronotus:
Uthicke and Conand 2005). However, such work suggests that the same species can also show
quite low dispersal ability, with restricted connectivity between populations, and high genetic
differences between populations separated by relatively short distances (Uthicke and Purcell
2004). However, all these studies have examined the connectivity of sea cucumber
populations using traditional population genetics, which provide insight into dispersal over
many hundreds to thousands of generations (i.e., evolutionary time), but do not provide
information on the dispersal of populations over one or a few generations (i.e.,
demographic/ecological timescale); it is the later information that is the most relevant to
management, and can only be resolved using techniques such as parentage analysis (Almany
et al 2013).
1.2 MAIN AIMS OF WORK
The present study has worked closely with the Manus E Ndras Tribal Network within
southern Manus Island, Manus Province, to provide data and support for decentralization of
sea cucumber fisheries management within this region. The Network unites the Manus E
Ndras Sea Faring Titan Tribal Communities to collaborate on issues affecting livelihoods,
climate change and tribal governance. Extending across the entire south coast of Manus
Island, the Network includes seven Council of Chief areas — Nauna Asi, Polobuli Asi, Mouk
Asi, M’buke Asi, Tawi Asi, Pere Asi and Mbunai Asi. The development of local community
networks, such as Manus E Ndras, could provide the proof of concept for how decentralized
marine resource management can work in Papua New Guinea. Such decentralization would
revolutionize sea cucumber management by giving communities, tribal groups, and provinces
the power to manage and trade in their sea cucumber stocks, as they deem appropriate. This
scenario should provide local incentives for improved management of sea cucumber stocks
back at the community and provincial level (Purcell et al. 2012).
8Despite support for decentralization of sea cucumber fisheries at the National level, there are
a number of key ecological questions that need to be answered before we can provide advice
on whether or not the fishery should be reopened, and at what ecological scale decentralized
management should be supported. The goal of the present work is then to provide a proof of
concept for local management of sea cucumber. Therefore, the main aims of the present work
were to:
1. Undertake a stock assessment of sea cucumber populations throughout the southern Manus
region – within this work we focus on one of the most commercially important sea cucumber
within Papua New Guinea - Sandfish, (Holothuria scabra).
2. Examine the genetic connectivity of sandfish populations throughout the southern Manus
Region, and determine the level of larval dispersal within and away from a natal source.
PART 1: STOCK ASSESSMENT OF SANDFISH POPULATIONS ACROSS THE
SOUTHERN COAST OF MANUS
2. AIM OF WORK: UNDERTAKE A RIGOROUS STOCK ASSESSMENT OF SANDFISH POPULATIONS
THROUGHOUT THE SEVEN CUSTOMARY MARINE TENURE AREAS WITHIN THE MANUS E NDRAS TRIBAL
NETWORK.
In order for provincial and local management of sea cucumbers to succeed, fisheries
managers need up-to-date information on the density and health of local sea cucumber
populations. Without this basic information fisheries may be opened well before they have
had the chance to recover from their over-exploited state, therefore perpetuating the ‘boom-
and-bust’ scenario seen in sea cucumber fisheries throughout Papua New Guinea. Despite this
there has been a paucity of surveys across the Manus coastline examining the density of sea
cucumber populations.
2.1 HIGH VALUE SEA CUCUMBER SPECIES USED WITHIN THIS STUDY - SANDFISH (HOLOTHURIA SCABRA)
The sandfish (Holothuria scabra) is widespread in the tropical Indo-Pacific (excluding Hawaii)
between latitudes 30N and 30S, with this species never found further east than Fiji (Purcell et
al. 2012). Despite its wide geographical distribution, this species has a narrow habitat range
and is only found in low-energy environments that have muddy or sand substrates (IUCN Red
List, 2014). Sandfish are most abundant in intertidal seagrass beds that are in close proximity
to mangroves; however, they also can be found on inner sand reef flats and in sand and silt
lagoon habitats. In Papua New Guinea sandfish are distributed between depths of 0-12
metres, with most individuals found in less than 10 metres of water (Kinch et al. 2008b).
Larvae of this species are planktonic, settling in shallow seagrass habitats at between 13-16
days. Recently settled juveniles ( 50 mm) and adults inhabit both shallow
9seagrass areas and deep sand/silt habitats. This species (and predominantly all Holothuria
species) are site attached, slow moving and aggregate as adults and juveniles.
Sandfish support subsistence, artisanal, and commercial fisheries throughout the Indo-Pacific
and is one of the most commercially important target species for the Papua New Guinea
bêche-de-mer industry (Purcell et al. 2014). Sandfish are very high value, being purchased
from fishers throughout the western and central Pacific at an average of US$90 per kilo and
retailing in Hong Kong for up to US$1,668 per kilo (Purcell et al. 2012, Table 1). Due to their
high value and shallow distribution, populations are estimated to have declined by more than
90% in at least 50% of their range, leading to this species being listed as Endangered on the
IUCN Red List in 2010 (IUCN Red List, 2014).
2.3 METHODS OF POPULATION ASSESSMENT
Between May and June 2014, the density and size structure of sandfish populations were
examined at a minimum of 2 sites within each of 7 villages encapsulating the southern Manus
coastline (Mbunai Village (hereafter termed “Mbunai”), Ndrova Island (hereafter termed
“Ndrova”, Pere Village (hereafter named “Pere”), Locha Village (hereafter termed “Locha”),
Tawi Island (hereafter termed “Tawi”, Timoenai Village (hereafter termed “Timoenai”), and
M’buke Island (hereafter termed “M’buke”) (Fig. 1a, 1b). The survey sites were predominantly
chosen within shallow seagrass (~1-2m depth). In Pere sandfish populations were surveyed
within both the shallow seagrass and deep sand/silt habitats (≥3m depth). Sandfish
populations were surveyed with a minimum of 4 transects per site, with each transect 50 m
long by 2 m wide (representing 100m2 area per transect). A total of 364 transects were
surveyed (Table 2).
10Table 1 Common Name, Scientific Name, the estimated average Purchase Prices that were paid for various grades of dried sea cucumber
across the western and central Pacific over the past decade (Adapted from Crick et al. 2013). Purchase prices are shown in USD per kg, (dried
form), the Product Value is grouped by price bracket (H = high; M = medium; L = low; VL = very low).
Common name Scientific name Purchase price USD kg-1 (dried) Value group
Sandfish Holothuria scabra 90 H
White teatfish Holothuria fuscogilva 84 H
Golden sandfish Holothuria lessoni 60 M
Black teatfish Holothuria whitmaei 53 M
Greenfish Stichopus chloronotus 50 M
Prickly redfish/Pineapple fish Thelenota ananas 45 M
Deepwater blackfish/Panning’s blackfish Actinopyga palauensis 45 M
Deep water redfish Actinopyga echinites 45 M
Surf redfish Actinopyga mauritiana 39 M
Blackfish/Hairy blackfish Actinopyga miliaris 20 L
Curryfish Stichopus herrmanni 20 L
Stonefish Actinopyga lecanora 20 L
Tigerfish / leopardfish Bohadschia argus 20 L
Snakefish Holothuria coluber 16 L
Peanutfish/Dragonfish/Warty Stichopus horrens 14 L
Chalkfish/Brownspotted sandfish Bohadschia marmorata 14 L
11Brown sandfish Bohadschia vitiensis 14 L
Flowerfish/Orangefish/Ripple fish Pearsonothuria graeffei 14 L
Amberfish Thelenota anax 14 L
Lollyfish/Reef lollyfish Holothuria atra 11 VL
Elephant trunkfish Holothuria fuscopunctata 11 VL
Pinkfish Holothuria edulis 6 VL
12Fig 1a Survey sites for stock assessments undertaken within the eastern part of Southern Manus, with site names listed in white.
13Fig 1b Survey sites for stock assessments undertaken within the western and southern parts of Southern Manus, with site names listed in
white.
14Table 2 Date, Local-Level Government, Village, Site, Habitat, Depth (m), Visibility (m) and the number of 100m2 visual transects
surveyed for Sandfish (Holothuria scabra) across the southern Manus coastline.
Local Level Visibility Number of
Date Government Village Site Habitat Depth (m) (m) Transects
24-May-2014 Penabu-Nalisopat Mbunai Mbunai 1 Seagrass flat06-June-2014 Bobuma Timoenai Timoenai 2 Seagrass flat 1 5 16 08-June-2014 Bobuma M’buke M’buke 1 Seagrass flat 1 3 12 08-June-2014 Bobuma M’buke M’buke 2 Seagrass flat 1 3 16 10-June-2014 Bobuma Locha Locha 1 Seagrass flat 1
Within each transect all sandfish encountered were counted, with each individual’s length
visually estimated and placed within 50 mm size classes (total length, TL). To determine the
density of sandfish in juvenile versus adult phases all individuals were split into ≤21cmTL
(juvenile) and ≥22cm TL (mature [adult] phase) (following Lokani 1990) for later conversion
to density (per area) estimates. The depth of each transect determined the method used to
survey sandfish: all transects
Table 3 Comparison of sandfish (H. scabra) densities between day and night surveys. Date, Village, Site, Survey time (Day or Night),
Depth, Visibility and the number of 100m2 visual transects surveyed for sandfish (H. scabra) across the southern Manus coastline.

Date           Village         Site            Survey for            Depth     Visibility    Number transects

30-May-14      Pere            Pere Point 1    Night Baseline
2.4 RESULTS
There were substantial differences in the average density of sandfish populations in the
seagrass habitat across villages (Fig 2). Pere (8.62 ± 2.34 SE), Timoenai (7.5 ±1.25 SE) and
Tawi (4.45 ± 1.33 SE) held the highest densities of sandfish per 100m2, with lower densities of
sandfish recorded at Mbunai (2.16 ± 0.48 SE) and M’buke Island (hereafter ‘M’buke’) (2.06 ±
0.91 SE) (Fig 2). No sandfish were recorded in transects at both Ndrova and Locha (Fig 2).
Within the deep sand/silt habitat surveyed within the Pere there were exceptionally low
average densities of sandfish, with 0.87 (± 0.32) individuals found per 100m2 (Fig 2).

                                       12
   Average density per 100m2 (+/-SE)

                                       10

                                        8

                                        6

                                        4

                                        2

                                        0
                                            Locha   M'buke   Mbunai   Ndrova     Pere   Tawi   Timoenai Pere - Deep
                                                                          Location

Fig 2 Average density of sandfish (± SE) per 100m2 at seven villages in the Manus E Ndras
Tribal Network within shallow seagrass habitats (≤2m) ( ), within deep sand/silt habitats in
Pere (☐) (≥3m). Note: no sandfish were found within transects at both Locha and Ndrova.

We then separated sandfish densities per 100m2 into juvenile (≤21 cmTL) and adult (≥22
cmTL) size classes between shallow and deep habitats. This showed that the majority of
sandfish recorded in shallow habitats were juveniles (Fig 3). Within Mbunai adult sandfish
comprised 36.53% of the total number of sandfish surveyed, while within M’buke adult
sandfish comprised 30.3% of the total sandfish surveyed. However, within both villages there
were low densities of sandfish recorded, both villages having between 1 and 2 individuals per
100m2 (Fig 3). At Pere, Tawi and Timoenai adult sandfish comprised
were ‘adult’ sized individuals. The majority of adult individuals were between 25TL and 37TL
(Fig 5)
At all villages sandfish populations within the shallow seagrass were dominated by juveniles
(Fig 6). The average densities of juvenile sandfish in the seagrass were: Pere (666 juveniles
per hectare ± 175.1 SE), Timoenai (606 juveniles per hectare ± 105.07 SE), Tawi (383
juveniles per hectare ± 117.7 SE), M’buke (143 juveniles per hectare ± 66.4 SE), and Mbunai
(137 juveniles per hectare ± 31.1 SE) (Fig 6). The average density of adults within the shallow
seagrass habitat was substantially lower than juvenile densities; Pere (195 adults per hectare
± 65.5 SE), Timoenai (143 adults per hectare ± 35.3 SE), Mbunai (79 adults per hectare ± 21.6
SE), M’buke (62 adults per hectare ± 28.6 SE), and Tawi (62 adults per hectare ± 23.9 SE) (Fig
6). Within the deep sand silt habitat (surveyed within Pere), juvenile sandfish showed
densities of 12 individuals per hectare (± 8.5 SE), while adults showed densities of 75
individuals per hectare (± 29.5 SE).
There was a substantial difference in sandfish densities between day and night time surveys
(Fig 7). Across all villages the average density of sandfish during the daytime was 0.63
individuals per 100m2 (± 0.16 SE), while this more than doubled during the night to 1.98
individuals per 100m2 (± 0.52 SE). At the village level there were substantial differences in the
density per 100m2 of sandfish within both Pere and M’buke between night and day (Fig 7).
Sandfish within the daytime at Pere were in densities of 0.50 individuals per 100m2 (± 0.16
SE), while during the night sandfish densities increased to 2.91 individuals per 100m2 (± 0.98
SE). Such substantial differences in sandfish densities between night and day were not as
pronounced within M’buke, but also showed higher densities of sandfish within the night than
daytime surveys (Daytime: 0.68 individuals per 100m2 ± 0.21 SE; Night time: 1.17 individuals
per 100m2 ± 0.44 SE) (Fig 7).
209
8
7
Average density per 100m2 (+/-SE)
6
5
4
3
2
1
0
M'buke Mbunai Pere Tawi Timoenai M'buke Mbunai Pere Tawi Timoenai Pere Pere
Juvenile - Shallow Habitat Adult - Shallow Habitat Juvenile - Deep Adult -
Habitat Deep
Habitat
Locations
Fig 3 Average density of juvenile (≤21cmTL) and adult (≥22cm TL) sandfish (± SE) within 100m2 transects within shallow seagrass habitats
(≤2m) and within deep sand/silt habitats (≥3m). Black bars signify juvenile sized individuals (≤21cmTL); white bars signify adult sized
individuals (≥22 cmTL). Note: no sandfish were found within transects at both Locha and Ndrova.
21(a)
Total number of sea cucumbers 35
30
25
20
surveyed
15
10
5
0
11TL
13TL
15TL
16TL
17TL
18TL
19TL
20TL
21TL
22TL
23TL
24TL
25TL
26TL
27TL
29TL
10TL
11TL
12TL
13TL
14TL
15TL
16TL
17TL
18TL
19TL
20TL
21TL
22TL
23TL
24TL
25TL
26TL
27TL
28TL
29TL
30TL
31TL
33TL
13TL
14TL
15TL
16TL
17TL
18TL
19TL
20TL
21TL
22TL
23TL
24TL
25TL
26TL
31TL
4TL
9TL
Mbunei Pere Tawi
Location
(b)
35
Total number of sea cucumber
30
25
20
surveyed
15
10
5
0
13TL
14TL
15TL
16TL
17TL
18TL
19TL
20TL
21TL
22TL
23TL
24TL
25TL
28TL
29TL
12TL
13TL
15TL
16TL
17TL
18TL
19TL
20TL
21TL
22TL
23TL
25TL
26TL
27TL
28TL
29TL
9TL
Timoenai M'buke
Location
Fig 4 Size structure of sandfish populations within shallow seagrass habitat (≤2m depth) across 5 villages (a) Mbunai, Pere, Tawi and (b)
Timoenai, M’buke. Black bars signify juvenile sized individuals (≤21cmTL), white bars signify adult sized individuals (≥22 cmTL) Please note:
No sandfish were present in transects at 2 villages, Locha and Ndrova. Data presented is abundance of sandfish pooled across all transects at
each village.
220.9
0.8
0.7
Average density per 100m2 (+/-SE)
0.6
0.5
0.4
0.3
0.2
0.1
0
15TL 16TL 17TL 18TL 19TL 20TL 21TL 22TL 23TL 24TL 25TL 26TL 27TL 28TL 29TL 30TL 31TL 32TL 33TL 34TL 35TL 36TL 37TL
Size Class
Fig 5 Average density of sandfish size classes within 100m2 transects in deep sand/silt habitat (≥3m). Black bars signify juvenile sized
individuals (≤21cmTL); white bars signify adult sized individuals (≥22 cmTL). Juvenile (≤21cmTL) and adult (≥22cm TL) sandfish (± SE) Black
bars signify juvenile sized individuals (≤21cmTL); white bars signify adult sized individuals (≥22 cmTL). Note: no sandfish were found within
transects at both Locha and Ndrova.
23900
800
700
Average density per hectare (+/-SE)
600
500
400
300
200
100
0
M'buke Mbunai Pere Tawi Timoenai M'buke Mbunai Pere Tawi Timoenai Pere Pere
Juvenile - Shallow Habitat Adult - Shallow Habitat Juvenile - Adult - Deep
Deep Habitat
Habitat
Location
Fig 6 Density per hectare (± SE) of juvenile (≤21cmTL) and adult sandfish (≥22cm TL) within shallow seagrass habitats (≤2m) and deep
sand/silt habitats (≥3m). Note: no sandfish were found within transects at both Locha and Ndrova.
245
Average density per 100m2 (+/-SE)
4
3
2
1
0
M'buke Pere M'buke Pere
Night Survey Day Survey Night Survey Day Survey
Survey times within Villages
Fig 7 Average density of sandfish (± SE) in shallow seagrass habitat within 100m2 transects
during both night-time (i.e., surveyed between 2000 and 0100) and day time (i.e., surveyed
between 1500 and 1600). Note: ‘Night Survey’ and ‘Day Survey’ correspond to the average
density per 100m2 across all transects when lumped, while ‘M’buke Night Survey’, ‘Pere Night
Survey’, ‘M’buke Day Survey’ and ‘Pere Day Survey’ correspond to the average density per
100m2 of sandfish within each village.
2.5 ESTIMATE OF TOTAL POPULATION
To provide an estimate of the total populations of sandfish within each village, we quantified
the total area (per m2) of suitable sandfish habitat present within each village. We did this by
having fishers use their local knowledge to demarcate seagrass and deep sandfish habitat on
satellite images of their reefs, a process known as ‘participatory mapping’. These locally
identified features were then digitised in Arc GIS, enabling the total area of habitat(s) to be
calculated for each village (Fig 8). Within each village ‘suitable’ habitat encompassed areas of
“shallow seagrass” (dense seagrass habitat predominantly holding juvenile individuals, with
sparse densities of adults), “sparse seagrass” habitats (which were areas predominantly
holding sparse juvenile and adult sandfish densities) and “deep silt/sand” habitat (which
predominantly held adult sandfish).
We estimated that within Pere there was over 4 million m2 of shallow seagrass (4,628,175.09
m2), over 3 million m2 of sparse seagrass (3,987,971.01 m2) and over 1 million m2 of deep
sand/silt habitat (1,130,571.80 m2) (Table 4). Timoenai and Mbunai also held a substantial
area of suitable habitat for sandfish, encompassing over 1.5 million (1,532,091.10 m2) and 1.1
million m2 (1,000,752.93 m2) of shallow seagrass, respectively (Table 4). Shallow seagrass
habitat was also estimated for Tawi (791,301.98 m2), M’buke (781,064.28 m2) and Locha
25(260,141.14 m2). Deep sand/silt habitat was estimated for Mbunai (30,963.32 m2), Timoenai
(1,051,769.26 m2) and Tawi (527,204.34 m2).
Using the estimates of total suitable habitat within each village, we then estimated the total
number of juvenile and adult sandfish in the total available habitat (i.e., Shallow seagrass,
Sparse seagrass and Deep sand/silt habitats) within each village (Fig 9, Table 4). This showed
that the highest numbers of juvenile sandfish were found in the shallow seagrass habitats in
Pere (179,341 juveniles across total area ± 39,329 SE) and Timoenai (61,922 juveniles across
total area ± 14,000 SE). A large number of juvenile sandfish were also estimated within the
total area of sparse seagrass habitat at Pere (61,632 juveniles across total area ± 22,772 SE),
while a low number of juveniles were estimated to be in the deep sand and silt habitats within
Pere (2,826 juveniles across total area ± 2,826) (Fig 9, Table 4). Estimates of total juvenile
numbers within the shallow seagrass throughout all other villages were substantially smaller:
M’buke (6,415 juveniles across total area ± 3,034 SE), Mbunai (8,256 juveniles across total
area ± 1,958 SE), Tawi (15,166 juveniles across total area ± 4,980 SE) (Fig 9, Table 4).
Estimates of the number of adult sandfish in the seagrass were considerably lower than those
for juvenile sandfish (Fig 9, Table 4). Pere (2,472 adults across total area ± 854 SE) and
Timoenai (14,682 adults across total area ± 3,743 SE) held the highest estimated numbers of
adults in the shallow seagrass, while low numbers of adult sandfish were also apparent within
M’buke (2,789 adults across total area ± 1,283 SE) and Mbunai (4,753 adults across total area
± 1,340 SE). Sparse seagrass habitats within Pere held moderate numbers of adult sandfish
(9,139 adults across total area ± 2,966 SE), while low numbers of adults were apparent within
the deep sand/silt habitat within Pere (4,441 adults across total area ± 1,575) (Fig 9, Table 4).
26Fig 8 Satellite map of suitable habitat for sandfish throughout the southern Manus coastline. See legend for details of each habitat quantified.
27Table 4 Estimate of total suitable sandfish habitat within each village across the southern Manus coastline and total number of juvenile and
adult sandfish in the total available habitat (encompassing Shallow seagrass, Sparse seagrass and Deep sand/silt habitats where surveyed).
Habitat Type Total estimated number of juvenile Total estimated number of adult
Village Area m2 sandfish sandfish
Locha 260,141.14 - -
M’buke 781,064.28 6,415 ± 3,034 SE 2,789 ± 1,283 SE
Mbunai 1,000,752.93 8,256 ± 1,958 SE 4,753 ± 1,340 SE
Shallow seagrass
Pere 4,628,175.09 179,341 ± 39,329 SE 46,595 ± 12,878 SE
Tawi 791,301.98 15,166 ± 4,980 SE 2,472 ± 854 SE
Timoenai 1,532,091.10 61,922 ± 14,000 SE 14,682 ± 3,743 SE
Pere Sparse seagrass 3,987,971.01 61,632 ± 22,772 SE 9,139 ± 2,966 SE
Mbunai 30,963.32 - -
Pere 1,130,571.80 2,826 ± 2,826 4,441 ± 1,575
Deep sand and silt
Tawi 527,204.34 - -
Timoenai 1,051,769.26 - -
28250000
200000
Total number of sandfish (+/-SE)
150000
100000
50000
0
Mbuke Mbunai Pere Tawi Timoenai Pere Pere Mbuke Mbunai Pere Tawi Timoenai Pere Pere
Island Village Village Island Village Village Village Island Village Village Island Village Village Village
Seagrass Sparse Sand/silt Seagrass Sparse Sand/silt
seagrass seagrass
Juvenile Adult
Size class within Location and Habitat Type
Fig 9 Estimate of total number (± SE) of (Juvenile [black box], Adult [white box]) sandfish across full extent of suitable area within each village
(M’buke, Mbunai, Pere, Tawi, Timoenai), within each of three Habitat types (Shallow seagrass, Sparse seagrass, Deep sand/silt). Note: no
sandfish were found within transects at both Locha and Ndrova.
292.6 AVERAGE MARKET VALUE OF ADULT SANDFISH WITHIN PERE: SHORT CASE STUDY
To estimate the total legal value of adult sandfish throughout Pere we did the following.
Firstly, we determined the total number of adults sized individuals (individuals ≥22 cmTL,
Grade A) within shallow seagrass, sparse seagrass and deep sand/silt habitats. To convert
these population estimates to total sea cucumber wet weights (kg), we developed a length
(mm) to weight (g) conversion for H. scabra by collecting and measuring length (mm) and
weight (g) of 415 individual sea cucumber from Pere, encapsulating individuals from shallow
seagrass and deep sand/silt habitats (Fig 10). The minimum and maximum lengths of
individuals measured were 110mm and 430mm, respectively, with an average length of
218mm (± 3.08SE)
The quadratic equation developed was in the form of:
f = y0+a*x+b*x2, where f = weight (g), y0 = 25.8394. a = -1.7615, b = 0.0129.
This conversion factor was calculated for each individual sandfish surveyed, with all
estimated weights then divided by 1000 to convert to kg. In order to convert total wet weights
(kg) of adults per habitat to processed (i.e., bêche de mer) BDM weights (kg) we divided by a
factor of 20, since processed sandfish are 5% of their wet live weight (Purcell et al 2009a).
Finally, we multiplied the total processed BDM weights by US$90, that being the mean price
paid (per kg) to fishers for this processed product in the Pacific (Crick et al 2013).
Fig 10 Relationship between total length (mm) and wet weight (g) for unprocessed sandfish
within Manus coastline (n = 415 individuals, adjusted R2 = 0.86). Blue lines are 95% CI around
mean, red lines are 95% prediction values.
3035000
30000
Total wet weight (kg) of unprocessed sandfish
25000
20000
15000
10000
5000
0
M'buke Mbunai Pere Tawi Timoenai Pere Pere
Seagrass Sparse seagrass Sand/silt
Habitat type within Location
Fig 11 Estimate of total wet weight (unprocessed) of adult sandfish (≥22cm TL) found throughout total suitable habitat within villages,
between each of three habitats types (Shallow seagrass, Sparse seagrass, Deep sand/silt). NB. No sandfish were found within Locha Village or
Ndrova Island.
311600
1400
Total dry weight (kg) of processed sandfish
1200
1000
800
600
400
200
0
M'buke Mbunai Pere Tawi Timoenai Pere Pere
Seagrass Sparse seagrass Sand/silt
Habitat within Location
Fig 12 Estimate of total dry weight (processed) of adult sandfish (≥22cm TL) found throughout total suitable habitat within villages, between
each of three habitats types (Shallow seagrass, Sparse seagrass, Deep sand/silt). NB. No sandfish were found within Locha Village or Ndrova
Island.
32120000
100000
Total value ($US per kilo, processed)
80000
60000
40000
20000
0
M'buke Mbunai Pere Tawi Timoenai Pere Pere
Seagrass Sparse seagrass Sand/silt
Habitat type within Location
Fig 13 Estimate of total value (USD per kilo processed) of adult sandfish (≥22cm TL) found throughout total suitable habitat within villages,
between each of three habitats types (Shallow seagrass, Sparse seagrass, Deep sand/silt). NB. No sandfish were found within Locha Village or
Ndrova Island.
33There were substantial differences in estimates of total wet weight (kilogram [kg]
unprocessed adult sandfish), total dry weight (kg, processed adult sandfish [bêche de mer])
and the approximate retail value of processed adult sandfish (using US$90 per kilo: Crick et al
2013) between villages and habitat types (Figs 11, 12, 13). The largest harvestable
populations were estimated to be present within the shallow seagrass within Pere (23,596 kg
wet weight of sandfish ± 5,674 SE), which represents approximately 1,179 kg of processed
bêche de mer (± 284 SE) and is estimated to be worth US$78,058 (± 20,945 SE). Pere also held
the only area of sparse seagrass surveyed, which held an estimated 8,017 kg wet weight of
sandfish (± 2,199 SE), which represents approximately 400 kg of processed bêche de mer (±
110 SE) and is estimated to be worth US$14,916 (± 5,368 SE). Lastly, the deep sand/silt
habitats were also only surveyed within Pere, and held an estimated 2,554 kg wet weight of
sandfish (± 932 SE), which represents approximately 127 kg of processed bêche de mer (±
54.7 SE) and is estimated to be worth US$14,547 (± 5,216 SE). Although all other villages and
habitat types held substantially lower densities of harvestable populations, relatively high
densities of sandfish were apparent within the shallow seagrass in Timoenai (12,677 kg of
sandfish ± 2,664 SE), which represents 633 kg of processed bêche de mer (± 133 SE) with an
estimated total worth of US $21,413 (± 5,394 SE). M’buke held 1,894 kg of adult sandfish (±
668SE) within the shallow seagrass habitat, which represents 94 kg of processed bêche de
mer (± 33 SE) with an estimated total worth of US $5,007 (± 2,291 SE), Mbunai held 2,860 kg
of adult sandfish (± 710 SE) within the shallow seagrass habitat, which represents 143 kg of
processed bêche de mer (± 35 SE) with an estimated total worth of US $8,081 (± 2,487 SE),
while Tawi held 2,830 kg of adult sandfish (± 842 SE) within the shallow seagrass habitat,
which represents 141 kg of processed bêche de mer (± 42 SE) with an estimated total worth
of US $3,774 (± 1,272 SE ) (Figs 11, 12, 13)
2.7 DISCUSSION
Survey results demonstrate that sandfish populations were dominated by small size classes;
that is, small juveniles (adults that are presumed to be sexually immature, Lokani 1990).
Therefore, because harvesting of sea cucumber has not occurred since (at least) 2009, there is
sign of substantial recovery in small size classes. Furthermore, discussions with local
fishermen suggested that all major exports of sandfish within the surveyed area had been
undertaken in 2007 – no major collections and export of sandfish products had occurred since
at least this time. This then suggests that the size structure of sandfish surveyed within this
work may be dominated by individuals that have not been subjected to harvest since
2007/2008 (7 to 8 years post harvesting). Although there is still little available evidence on
the growth rates of sandfish (and the majority of commercial sea cucumber species), we
predict that the relative dominance of the 15-20cmTL sizes throughout the villages may be
associated with the impact of harvesting of sea cucumbers within this region.
2.8 DENSITY AND SIZE STRUCTURE OF SANDFISH POPULATIONS
The density of sandfish identified in this survey between villages should not be considered
exhaustive, but provides a good indication of the relative abundance of this species and the
34structure of populations across the across the seven Customary Marine Tenure areas within
the Manus E Ndras Tribal Network. Within this work we showed that there are substantial
differences in the average density per hectare of sandfish between villages. However, within
several locations (i.e., Pere, Timoenai and Tawi), average densities per hectare of juveniles are
relatively high (from 383 to 666 individuals per hectare), and are on par with areas that have
begun experimental, small scale fishing (i.e. Warrior Reefs), where the estimated average
density for legal sized (>18 cm) sandfish was 388.3 (± 48.3 SE) sandfish per hectare (Murphy
et al 2012).
The survey results show the impact of high levels of historical harvesting of sandfish prior to
2009. The average density of sandfish for several villages was reasonably high (when
compared to historical surveys of sandfish in Papua New Guinea, Lokani 2001), but much of
the sandfish remaining on the reefs of Manus are young adults, and are considered recently
recruited into the fishery. As in historical surveys within the region (Lokani 2001) the
dominant sizes of sandfish surveyed was approximately 20 cm TL, with very low densities of
large sandfish (>30cmTL). Such population structure will be associated with the relatively
slow growth of sandfish (Hamel et al. 2001), in addition to fishing practices that preferentially
target large sizes of sandfish. Such results are in parallel with both Lokani (1995) and Skewes
et al. (1998) who found that sea cucumber harvesting within the Warrior Reefs (Torres Strait
area) initially targeted large sizes of sandfish, moving to smaller sizes as larger sizes were
depleted.
There were substantial differences in the density of sandfish observed in day and night
surveys, with significantly more individuals – more than twice as many – observed at night.
This difference in density is expected to be due to the burrowing nature of sandfish; both
juvenile and adult sandfish are known to burrow during the daytime, and re-emerge at night
to feed. Although there is a substantial primary literature that has documented the nocturnal
behaviour of sandfish (Purcell 2010), we could find no ecological surveys of sandfish (or any
other sea cucumber species) that have quantified individual densities throughout night hours.
Although night surveys can present logistical difficulties, we suggest that their inclusion into
stock assessments would improve accuracy in determining stock status. For example,
combining day and night surveys of the same area would allow for a correction factor to be
applied to day surveys to obtain a truer measure of sandfish density in an area.
2.9 RECOMMENDATIONS
1. Based on the positive indication for stocks within Manus, small levels of fishing could
occur in the future.
2. We recommend that there is an implementation of some permanent closures in deep
habitats (sand/silt habitats) to protect the largest and most productive of the primary
spawning stock
3. We recommend that fishing of sea cucumbers should be restricted to only harvesting
individuals that are larger than the minimum size for (estimated) maturity (21cmTL)
(following Lokani 1990)
354. We recommend that the NFA re-impose seasonal harvesting rules, which only allow
harvesting to occur periodically.
5. We recommend that the estimates of adult abundances (reported within the present
study) are utilised when harvesting resumes within Manus, and not more than 50% of this
adult abundance is removed annually
6. We recommend that before harvesting resumes within Manus, sandfish density surveys
are undertaken again by locally trained surveyors, and undertaken on a regular basis once
harvesting is underway. Once density fall below 50% of the pre harvest densities then all
harvesting should be stopped. Harvesting should then only be resumed once density
estimates reach above 50% of the pre harvest densities.
7. We recommend that there is an increase in the number of surveys of sandfish at night (to
balance and adjust daytime averages)
8. Assessments of the status of sandfish stocks throughout Manus should be undertaken
yearly or bi-yearly utilising both NFA staff members and trained local fishers.
36PART 2: CONNECTIVITY RESEARCH – PRELIMINARY RESULTS OF FIELDWORK
3. AIM OF WORK: DETERMINE THE SPATIAL SCALE OF LARVAL DISPERSAL AND ITS ROLE IN
REPLENISHING LOCAL STOCKS OF THE COMMERCIALLY IMPORTANT SEA CUCUMBER, SANDFISH
(HOLOTHURIA SCABRA), WITHIN AND ACROSS TRIBAL BOUNDARIES ALONG THE SOUTHERN COASTLINE OF
MANUS ISLAND.
Fisheries replenishment depends on juvenile recruitment, however sea cucumber populations
produce planktonic larvae that have the potential to disperse widely before recruiting to
benthic habitats. Despite this, throughout PNG fisheries management is beginning to be
decentralized, with management now focusing on the spatial scale of small Customary Marine
Tenure areas, often consisting of just a few hundred hectares of habitat. Therefore, a key
concern for PNG fishers is the degree to which their local actions may (or may not) contribute
to the replenishment of their own stock, but also how actions in adjacent (neighbouring)
areas may impact their stock. A local- or provincial-level network of communities that
cooperatively make management decisions across an area encompassing several Customary
Marine Tenure areas, such as the Manus E Ndras Tribal Network, could – depending on
patterns of larval dispersal – solve the problem of unequal burdens and benefits on
communities.
The focus of this work will be to determine the spatial scale of larval dispersal—the dispersal
kernel— of sandfish throughout the seven tribal regions that make up the Manus E Ndras
Tribal Network at southern Manus Island, Manus Province. This work utilizes recent advances
in genetic parentage analysis and will provide the first direct measurements of larval
dispersal, and the first direct estimates of how the probability of larval dispersal varies as a
function of distance, in a commercially important invertebrate (see Almany et al. 2013 for
detailed methods). This work will play a critical role in determining the spatial scale over
which decentralized management strategies are likely to be effective in sustaining viable sea
cucumber populations, who benefits from such management strategies, and the degree of
cooperation necessary among neighbors within the southern Manus Province for the fishery
to be sustainable.
3.1 METHODS AND PRELIMINARY RESULTS OF SAMPLING
We examined the degree of self-recruitment into, and larval dispersal out of, sandfish (H.
scabra) populations resident within Pere (Patusi Bay) across the southern Manus coastline
(Fig 11). Between May 19 and June 22, 6,465 individual sandfish were collected and a small
(2cm X 2cm) piece of body wall tissue collected. Within Pere both adult (i.e., ≥ 22cmTL: 2,094
individuals) and small juvenile individuals (i.e., ≤15 cmTL: 1,294 individuals) sandfish were
collected and tissue excised (Table 5). Juvenile sandfish were similarly sampled from 57 sites
from a broad area around the source population (Pere, where adults were sampled)
stretching 15km to the west of Pere (i.e., Pamachau Island), 38km east of Pere (i.e., Timoenai)
and 21 km south of Timoenai (i.e., M’buke).
Although juvenile (non-mature) sandfish within Papua New Guinea have been categorized as
being ≤21cm TL (Lokani 1990), maturity can occur within sandfish from 17cmTL to 21cmTL
37You can also read