Remediating Agricultural Legacy Nutrient Loads in the Baltic Sea Region
←
→
Page content transcription
If your browser does not render page correctly, please read the page content below
sustainability

Article
Remediating Agricultural Legacy Nutrient Loads in the Baltic
Sea Region
Julia Tanzer * , Ralf Hermann and Ludwig Hermann *

                                           Proman Management GmbH, Weingartenstraße 92, 2214 Auersthal, Austria; office@proman.pro
                                           * Correspondence: j.tanzer@proman.pro (J.T.); l.hermann@proman.pro (L.H.); Tel.: +43-660-155-85-03 (J.T.);
                                             +43-699-18-15-99-15 (L.H.)

                                           Abstract: The Baltic Sea is considered the marine water body most severely affected by eutrophication
                                           within Europe. Due to its limited water exchange nutrients have a particularly long residence time
                                           in the sea. While several studies have analysed the costs of reducing current nutrient emissions,
                                           the costs for remediating legacy nutrient loads of past emissions remain unknown. Although the
                                           Baltic Sea is a comparatively well-monitored region, current data and knowledge is insufficient to
                                           provide a sound quantification of legacy nutrient loads and much less their abatement costs. A first
                                           rough estimation of agricultural legacy nutrient loads yields an accumulation of 0.5–4.0 Mt N and
                                           0.3–1.2 Mt P in the Baltic Sea and 0.4–0.5 Mt P in agricultural soils within the catchment. The costs
                                           for removing or immobilising this amount of nutrients via deep water oxygenation, mussel farming
                                           and soil gypsum amendment are in the range of few tens to over 100 billion €. These preliminary
                                           results are meant as a basis for future studies and show that while requiring serious commitment to
                                 funding and implementation, remediating agricultural legacy loads is not infeasible and may even

                                           provide economic benefits to local communities in the long run.
Citation: Tanzer, J.; Hermann, R.;
Hermann, L. Remediating                    Keywords: Baltic Sea; eutrophication; legacy nutrient loads; abatement costs; agriculture
Agricultural Legacy Nutrient Loads
in the Baltic Sea Region. Sustainability
2021, 13, 3872. https://doi.org/
10.3390/su13073872
                                           1. Introduction
Academic Editor: Flávio Augusto                  Urbanisation and agricultural intensification since the 1950s have caused an increase
Bastos da Cruz Martins and                 in emissions of excessive nutrients (mainly compounds of nitrogen (N) and phosphorus
Christopher Robin Bryant                   (P)). The nutrient enrichment of in-land and marine waterbodies, known as eutrophication,
                                           is a serious threat to aquatic ecosystems which has led to frequent algal blooms, oxygen
Received: 1 February 2021                  depletion and a decline in biodiversity [1]. By 2050 20% of large marine ecosystems may be
Accepted: 25 March 2021                    affected by increasing coastal eutrophication if efforts to reduce nutrient pollution are not
Published: 31 March 2021                   intensified [2].
                                                 In Europe, the marine water body, which is currently considered to suffer most
Publisher’s Note: MDPI stays neutral       from eutrophication is the Baltic Sea [1]. More than a century of N and P emissions
with regard to jurisdictional claims in    from municipal and industrial wastewater, as well as agricultural runoff have led to a
published maps and institutional affil-    situation, were 97% of the Baltic Sea are impaired by elevated nutrient levels, reoccurring
iations.                                   cyanobacterial blooms, high oxygen debt and other eutrophication impacts [3]. Its shallow
                                           depth, limited water exchange and brackish conditions make the Baltic Sea an especially
                                           weak and vulnerable environment [4].
                                                 However, the Baltic Sea is also, arguably, the best studied and monitored sea within
Copyright: © 2021 by the authors.          Europe and the region has long-standing experience in the combat against eutrophica-
Licensee MDPI, Basel, Switzerland.         tion [1]. Actions are mainly led by the Baltic Marine Environmental Protection Commission
This article is an open access article     (Helsinki Commission, HELCOM) an intergovernmental alliance between the European
distributed under the terms and            Union (EU) and the nine Baltic countries bordering the Baltic Sea (Denmark, Estonia,
conditions of the Creative Commons         Finland, Germany, Latvia, Lithuania, Poland, Russia, and Sweden), founded in 1974. The
Attribution (CC BY) license (https://      key document coordinating measures and actors is the Baltic Sea Action Plan (BSAP),
creativecommons.org/licenses/by/
                                           which was adopted in 2007 and is currently in the process of updating [5]. Its main
4.0/).

Sustainability 2021, 13, 3872. https://doi.org/10.3390/su13073872                                        https://www.mdpi.com/journal/sustainability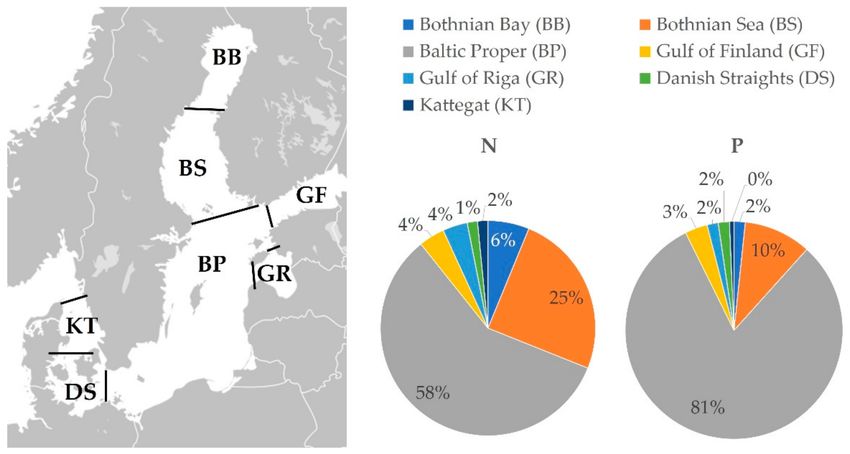
Sustainability 2021, 13, 3872                                                                                            2 of 18

                                aim is to restore the good environmental status of the Baltic marine environment. Re-
                                garding eutrophication, the original BSAP set maximum allowable nutrient input levels
                                (0.79 Mt N/y and 0.02 Mt P/y) that should be achieved by 2021. These targets are broken
                                down both to sub-basins and to reduction needs for individual member countries com-
                                pared to reference inputs in 1997–2003 [4]. Furthermore, the Urban Wastewater Treatment
                                Directive (91/271/EEC), the Nitrates Directive (91/676/EEC), the Water Framework Direc-
                                tive (2000/60/EC), the Marine Strategy Framework Directive (2008/56/EC), the Industrial
                                Emissions Directive (2010/75/EU), as well as the EU Strategy for the Baltic Sea Region
                                (EUSBSR) are playing an important role for the implementation of policy dealing with
                                eutrophication [1,6]. Despite significant reductions of nutrient loads to the sea (ca. 25% for
                                N and >50% for P since their peak in the 1980s), the 2021-targets of the BSAP are missed
                                and eutrophication continues to be one of the most pressing issues in the region [3].
                                      Both aspects, the severity of the problem as well as the good documentation of
                                emissions, their impacts, and the effects of different mitigating measures, could enable the
                                Baltic Sea region to become a forerunner for a successful large-scale transition towards
                                a circular, green economy and society. Within the region, but also within the European
                                Commission, the need for bold, interdisciplinary, and trans-sectoral actions that engage
                                the whole society is growing. This is reflected e.g., in the promotion of a Baltic Sea
                                Socioeconomic Action Plan [7] or a Mission Blue [8] in the former and the European Green
                                Deal [9] as well as the Missions under the Horizon Europe Programme [10] in the latter.
                                However, one of the most crucial issues for the implementation of an integrated, holistic
                                strategy is the mobilisation of adequate funding. During the 11th EUSBSR Annual Forum
                                (https://www.annualforum2020.eu/en, accessed on 20 October 2020), lack of national
                                commitment to funding was identified as one of the reasons why the aims of the EUSBSR
                                have not been reached yet. While the European Commission envisages a budget of at least
                                €100 billion over the period 2021–2027 for the just transition toward the green economy [11],
                                actual mobilisation of funding by the member states often proves difficult as has for instance
                                been shown for the Natura 2000 strategy [12].
                                      Meanwhile, the costs of damaging the natural environment are often overlooked. In
                                the Baltic Sea region several studies have analysed the costs of reducing nutrient loads
                                to the sea [13–17], sometimes juxtaposing them to the value people assign to a healthy
                                sea [13] or comparing economic effects (employment, property values, etc.) of an intact
                                and an environmentally degraded marine environment [16]. Yet, to our knowledge, the
                                damage caused by past nutrient emissions has not been quantified to date. Due to the
                                limited water exchange, P has a particularly long residence time in the Baltic Sea (N leaves
                                the system via denitrification). Huge amounts of P from past emissions have been stored
                                in the bottom sediments of the Baltic Sea from which they can be released under anoxic
                                conditions [18]. Moreover, cyanobacterial blooms caused by excessive P concentrations,
                                lead to higher levels of N2 fixation, thus counteracting the effects of N load reductions [19].
                                Furthermore, large amounts of P have accumulated in agricultural soil, so that current
                                efforts to decrease overfertilisation will not immediately manifest in reduced agricultural
                                P emissions [20]. In fact, it is estimated that even if the targets set in the BSAP were met,
                                it would take another 150–200 years until the overall goal of “a Baltic Sea unaffected by
                                eutrophication” would be reached [1], based on [21].
                                      In the present study, we provide a first estimation of legacy nutrient loads and their
                                abatement costs for the agricultural sector, which is one of the sectors currently regarded
                                as most challenging and important to tackle [8]. The aims of this preliminary analysis
                                are twofold:
                                1.   Comparing amounts and removal costs of legacy nutrient loads to those of reducing
                                     current emissions as well as to public funding available in order to support the
                                     adequate integration of legacy nutrient loads in future eutrophication remediation
                                     strategies
                                2.   Substantiating the discussion on preventing emissions vs remediating environmen-
                                     tal damages with a comparison of long-term damage costs of agricultural nutrient
Sustainability 2021, 13, 3872 3 of 18
emissions, the economic benefits generated by the sector and the costs of agricultural
emission prevention
For that purpose, results of past monitoring and modelling in the Baltic Sea are
combined to estimate the amounts of P stemming from agricultural activities currently
present in the sea and on land. Subsequently, the costs of extracting P from the water or
permanently binding it in bottom sediments and on land are quantified.
2. Materials and Methods
2.1. Description of the Baltic Sea Region
The Baltic Sea is one of the world’s largest brackish water bodies (240,000 km2 ),
surrounded by eight EU member states (Denmark, Estonia, Finland, Germany, Latvia,
Lithuania, Poland, and Sweden) as well as Russia. About half of Belarus and minor parts
of Czech Republic, Norway, Slovakia and Ukraine also lie within the Baltic Sea catchment
(1,729,500 km2 ) [22].
The characteristic salinity gradients both with depth and from the southwest to the
northeast stem from the facts that the Baltic Sea is rather shallow (less than 30 m in more
than one third of the area) and that water exchange is limited as the narrow passage
through the Sound and Belt Sea is its only connection to the North Sea. The latter also
causes seasonal oxygen deficiencies and anoxic conditions in deeper parts of the sea as well
as accumulation of nutrients and other pollutants from human origins. Few species are
adapted to the brackish conditions; however, they have created a rare community, where
both seawater and freshwater species coexist alongside each other [4].
Climatological conditions vary considerably across the basin with Atlantic-temperate
climate in the southwest, continental-temperate climate in the east and boreal to artic
conditions in the north. This is reflected in the land use, where forest and peatland
dominate in the north, whereas cultivated areas are more common in the southern parts of
the catchment [22]. Consequently, the share of agricultural area in total land area ranges
from 0.2% in the Russian Republic of Karelia to 66.6% in Sjælland in Denmark. Livestock
densities in the different regions, which are an indicator for the amount of organic fertiliser
applied to fields vary between 0.15 life stock units/ha (LSU/ha) in Helsinki-Uusimaa in
Finland to 2.11 LSU/ha in Leningrad Oblast in Russia [23–32].
2.2. Quantifying Agricultural Legacy Nutrient Loads
2.2.1. Nutrients Present in the Sea
Savchuk [18] modelled the current (as of 2016) nutrient pools in the Baltic Sea with
approximately 6 Mt N and 0.7 Mt P. However, anthropogenic emissions are only partly
responsible for these pools. Latest data reported by HELCOM [33] show that around one
third of both N and P emissions can be attributed to the “natural background”. The share
of current nutrient pools attributable to agricultural emissions is thus calculated as:
T
Lcum,agr = ∑ (lriver,t,agr + lair,t,agr ) (1)
t= T − RT
where:
Lcum,agr cumulative agricultural nutrient load to the Baltic Sea (expressed in t N or t P)
lair,t,agr deposition of airborne agricultural emissions on the Baltic Sea (expressed in
t N/y or t P/y)
lriver,t,agr riverine agricultural nutrient load to the Baltic Sea (expressed in t N/y or
t P/y),
RT nutrient residence time in the Baltic Sea
T most recent year, for which data on nutrient load is available
Residence times of N and P in the Baltic Sea have been estimated by Savchuk [18] and
Radtke et al. [34]. Savchuk [18] reports an average residence time of 49 years for P, which is
in accordance with Radtke et al. [34] who found P residence time exceeding their studySustainability 2021, 13, 3872 4 of 18
period of 35 years. Results for N are more divergent, though: while Savchuk [18] estimates
a mean residence time of 9 years, it is merely 1.4 years for riverine N according to Radtke
et al. [34]. To account for uncertainties in residence times, ranges of Lcum,agr are calculated
applying residence times of 1–9 years for riverine N and 35–49 years for P.
It should be noted that assuming constant residence times over time constitutes a
model simplification. In reality, nutrient residence times are dependent on trends in
inflows of marine water and weather conditions (e.g., temperature and wind) [4]. Not least,
residence times are affected by nutrient levels themselves, for instance through biological
feedbacks as described in Section 1.
HELCOM provides a time series of riverine and direct nutrient inputs as well as water
flows to the Baltic Sea since 1995, the most recent entry stemming from 2017 [35], see
Figure 1. Similarly, a time series for 1995–2016 for atmospheric emissions and deposition of
oxidized and reduced N is available [36,37], see Figure 1. To reach a consistent time series,
deposition values for 2016 are extended to 2017 in the present study. Measurements of
atmospheric deposition of P are very limited, which is why HELCOM assumes a constant
deposition rate of 5 kg P/km2 [38]. Prior to 1995, a time series of riverine P inputs and
water flows based on Savchuk et al. [39] is available in McCrackin et al. [20].
Figure 1. Nutrient inputs to the Baltic Sea 1995–2017: (a) Annual direct and riverine N (based on [35]); (b) Annual direct
and riverine P (based on [35]); (c) Annual atmospheric deposition of oxidized and reduced forms of N (based on [37]);
(d) Annual atmospheric deposition of P (based on [38].
In addition, HELCOM conducts Pollution Load Compilations (PLC) at regular inter-
vals, in which the state of nutrient loads and their sources are analysed in more detail.
These are used to estimate the share of the cumulative nutrient load that can be attributed
to agriculture. However, the analysis is restricted to HELCOM contracting parties; thus,
transboundary agricultural emissions from non-riparian countries within the Baltic Sea
catchment (primarily Belarus) have not been considered. Table 1 provides an overview of
the available data on riverine agricultural emissions. For years without specific information,
values are determined via linear inter- or extrapolation. Airborne agricultural N emissions
deposited in the Baltic Sea are calculated using general factors reported in the PLC-5.5
assessment [38]: 85–95% of reduced N deposition can be attributed to agricultural emis-Sustainability 2021, 13, 3872 5 of 18
sions, whereas they play a negligible role in oxidized N deposition. Furthermore, 75% of
reduced N deposition on the Baltic Sea are estimated to stem from emissions of HELCOM
contracting parties. These factors are mostly based on data from 2000 and 2003; however,
as ratios in N deposition have been reported to be comparatively stable over time [38], it is
justifiable to apply them to the whole time series. Due to lack of data HELCOM treats P
deposition as natural background input [38] so that atmospheric P deposition of agriculture
emissions is not considered in the current assessment. Similarly, agricultural emissions
deposited on river surfaces and subsequently transported to the Baltic Sea are neglected.
Table 1. Reported riverine agricultural nutrient loads, absolute (t N, t P) and relative to total riverine
load (%N, %P).
Year Mt N %N Mt P %P Reference
1985 0.019 [40]
1995 0.017 [40]
2000 0.016 [40]
2006 36–62% 34–55% [41]
2014 0.18–0.23 0.005–0.006 [42]
However, like estimates of nutrient residence times, all of these input data are subject
to large uncertainties. Especially for the early years of the time series missing data had
to be replaced with estimates. Moreover, nutrient loads are partly derived from measure-
ments of discharges and nutrient concentrations at river mouths, partly from modelling
and both measurement frequency and modelling approaches differ between different sta-
tions/countries and have changed over time [43]. Svendsen and Gustafsson [35] estimate
uncertainty of annual total waterborne N with roughly 15–25%, whereas for annual total P
uncertainty may reach up to 50%. The accuracy of air concentrations of N is approximately
30% [37] and for P deposition 20% [38]. These ranges are used to calculate minimum and
maximum cumulative nutrient loads. For P loads prior to 1995 no uncertainties are stated.
An equal uncertainty as for later years (50%) is assumed, which may, however, under-
estimate true uncertainty. The PLC reports do not disclose uncertainties of agricultural
emissions either. Therefore, different combinations of input data and calculation paths are
used to compile a likely range of cumulative agricultural nutrient loads. All calculations
are documented in Tables S1 and S2.
2.2.2. Nutrients Present on Land
According to McCrackin et al. [20] (based on data by Bouwman et al. [44]) 50 Mt P
have accumulated in arable land and grassland in the Baltic Sea region between 1900 and
2010. Part of this stock is strongly bound in soil, whereas another is prone to leaching and
thus will contribute to the marine P load in the future. McCrackin et al. [20] modelled the
distribution of P in the landscape between the mobile and stable pool and estimate that
in 2013 the mobile and stable pool comprised 17 and 27 Mt P, respectively. Their system
not only includes P accumulated in agricultural soil, but also in marine sediments, the
sewage system, and landfills. Nevertheless, considering that the total pool in Bouwman
et al. [44] is of a similar magnitude, that sewage is typically managed within short time
frames and that the P pool in the Baltic Sea as estimated by Savchuk [18] is comparatively
small (0.7 Mt), it can be assumed that agricultural soils also predominate in the P pools of
McCrackin et al. [20]. Consequently, we estimate the nutrient load that has accumulated
on agricultural land between 17 Mt P (equivalent to the full mobile pool in McCrackin
et al. [20]) and 19 Mt P (applying the ratio mobile:stable pool of McCrackin et al. [20] to the
total pool estimated by Bouwman et al. [44]).
For the period 1900–2013 McCrackin et al. [20] determined annual leaching rates of
0.08% and 3.17% from the mobile pool to the Baltic Sea and from the mobile to the stable
pool, respectively. Under the simplified assumption that these rates are stable over time,Sustainability 2021, 13, 3872 6 of 18
we model P leaching to the Baltic Sea until the mobile pool is depleted to less than 1 t of
P as:
PMt+1 = PMt ∗ (1 − r BS − rSP ) (2)
where:
PMt mobile pool in year t
rBS leaching rate from the mobile pool to the Baltic Sea (0.08% according to [20])
rSP leaching rate from the mobile pool to the stable pool (3.17% according to [20])
It should be noted that P leaching from agricultural soils to the Baltic Sea is correlated
to riverine discharge. As future discharge levels remain unknown, we assume discharge to
equal the long-term average 1900–2013 as reported in McCrackin et al. [20]. Changes in
average discharge, e.g., due to climate change, are therefore neglected in the present study.
Calculations are documented in Table S3.
2.3. Monetising Impacts of Agricultural Legacy Nutrient Loads
Monetisation of legacy nutrient loads stemming from agricultural activities are based
on an abatement cost approach, thus quantifying the costs arising if negative environmental
impacts were mitigated [45].
Recently, measures tackling the legacy nutrient load in the Baltic Sea have attained
increasing attention, including attempts to extract nutrients from the sea via mussel farm-
ing [46–49], targeted fishing of cyprinids [50] and harvesting of (naturally occurring or
cultivated) algae [51,52], as well as efforts to prevent P release from bottom sediments
via dredging [53], deep water oxygenation [54–56] and injection of aluminium [57,58] or
marl [59]. Meanwhile, legacy P on agricultural land is mainly addressed by structural
liming [58,60] or gypsum amendment [61,62], both aiming at binding P in more stable
forms in the soil.
The costs and potential impacts in terms of nutrient abatement of these measures are
derived from a review of both peer-reviewed scientific articles and grey literature such as
various project reports. The information is then used to develop an abatement scenario for
agricultural legacy loads. To provide a fair measure of the impact of past nutrient emissions,
it is important that nutrient abatement is conducted in a cost-efficient way. On the other
hand, measures tackling sea bottom sediments constitute substantial interventions into
the marine environment. Oxygenation pumping for instance may destroy the thermal and
salinity stratification of the ocean and cause the release of contaminants previously bound
in the sediments. Depending on the method and mitigation measures taken, dredging may
cause turbidity, noise and vibration disturbance and destroy benthic habitats. Aluminium
may be released from the sediments at alkaline and acid pH and have toxic effects on
aquatic organisms, although this risk is perceived as rather low due to the high buffering
capacity of the Baltic Sea [63,64]. Similarly, intensive fishing or mussel farming could cause
unpredictable and severe changes in marine biodiversity [65], although regarding the latter,
the risk of oxygen deficits following sedimentation of organic material underneath the
farms or competition with fish populations is gauged marginal in recent studies [66]. Sites
for soil gypsum amendment also have to be carefully selected to prevent contamination
of lakes, groundwater or ecologically valuable sites with sulphate [61]. In general, more
research is needed on long-term effects and potential risks of large-scale implementations
of these measures. To nevertheless provide a first rough estimate of monetary impacts of
past agricultural nutrient loads, the developed abatement scenario is based on currently
available knowledge and is taking both costs and potential risks into account.
It has to be noted that soil- and sea-based measures are complementary as they tackle
two different types of legacy nutrients. Costs should therefore be regarded as additive
rather than alternative. Similarly, the measures and costs presented here are not meant to
substitute for actions on reduction of current nutrient emissions but aim at monetising the
damage caused by emissions that already occurred in the past.
Furthermore, most abatement cost studies in the Baltic Sea region (e.g., [13–15]) at-
tribute the full costs alternately to N and P, although most measures have effects on bothSustainability 2021, 13, 3872 7 of 18
nutrients. To facilitate comparison with these studies and between the measures analysed
in the current study (not all measures are suitable to tackle the N load), we opt for express-
ing costs as per kg P removed or immobilised. Nevertheless, scenarios are designed in a
way that ensures both nutrients will be abated fully.
2.4. Current Output Created by Agriculture
Data on the Gross value added (GVA) created in the agricultural sector are available
from Eurostat [67] for the countries of the EU and the online data platform Knoema [25–32]
for Russia and Belarus. As substantial parts of Russia and Germany are outside the Baltic
Sea catchment, regional data on GVA is used. For Germany, these stem from a national
statistical database [68] and the calculation method differs slightly from Eurostat data
(differences on national level amount to 3–14%). Eurostat data is available from 1995. Thus,
an average annual GVA for the period 1995–2017 is calculated. For Russian regions, data
is only available for 1996 and 2015 and is linearly interpolated for intermediate years. As
agricultural legacy P loads partly include, partly exclude emissions from Belarus, average
annual GVA is calculated both including and excluding Belarus (see Table S4).
3. Results and Discussion
3.1. Agricultural Legacy Nutrient Loads in the Baltic Sea Region
Based on the calculations described in Section 2.2 the agricultural legacy nutrient loads
in the Baltic Sea as of 2017 amount to 0.5–4.0 Mt N and 0.3–1.2 Mt P. Hence, agriculture is
responsible for 30–40% of the cumulative load (see Table 2). Figure 2 shows the distribution
of nutrient loads between the different subbasins of the Baltic Sea based on Savchuk [18].
In addition, of the 17–19 Mt P that have accumulated in mobile pools on agricultural
land within the catchment, 0.4–0.5 Mt would leach to the Baltic Sea over a period of
approximately 500 years. 96% of this load occur in the initial 100 years, as can be seen in
Figure 3.
Table 2. Cumulative nutrient loads over nutrient lifetime in the Baltic Sea and parts of the load
that can be attributed to agricultural emissions of HELCOM contracting parties based on historical
emission data.
Mt N Mt P
Nutrients in the sea
total cumulative load 2.003–9.792 0.868–3.254
cumulative agricultural load 0.541–3.958 0.262–1.162
of this: riverine 0.128–3.100 0.262–1.162
of this: deposition 0.413–0.858 0
Nutrients on land
cumulative agricultural load neglected 0.418–0.468
While the estimate for the total N load corresponds well with the model by Savchuk [18]
(6 Mt), the total P load in the present study is considerably higher (0.9–3.3 Mt vs. 0.7 Mt),
taking into account that the lower number refers to a reference time of 35 years instead of
49 as applied by Savchuk [18]. In general, the wide ranges of the estimates we provide
reveal that even in a comparatively well studied and monitored region like the Baltic Sea
catchment, nutrient loads are associated with high uncertainties. As shown in Tables S1 and
S2 uncertainties of the total nutrient emissions provided by HELCOM [35,37,38] dominate
over uncertainties related to nutrient residence times and methodological uncertainties of
determining the agricultural share in total loads. Thus, there is a need to further harmonise
measurement and modelling techniques between the different HELCOM parties and to
increase understanding of emission and retention mechanisms as well as the complex
ecosystem interactions governing eutrophication [3].Sustainability 2021, 13, 3872 8 of 18
Figure 2. Overview of Baltic Sea subbasins (left, background map from [69]) and distribution of
nutrient loads based on [18] (right).
Figure 3. Leaching of legacy P from the mobile P pool in agricultural soils to the Baltic Sea during
the initial 200 years under to different assumptions of initial magnitude of the mobile pool (PM min
and PM max). Calculation based on [20] and documented in Table S3.
Furthermore, it should be minded that transboundary loads from non-HELCOM con-
tracting parties are not included in the riverine agricultural loads due to lack of data (legacy
P stored in agricultural soils also includes Belarus). Moreover, like current HELCOM
assessments, the present study assumes steady state conditions in the Baltic environment.
Climate change is predicted to significantly impact the region over the next century, though.
A shift in precipitation regimes (i.e., an increase in extreme rainfall events), for instance,
could amplify the risk of soil and riverbank erosion and thus of nutrient input to the sea.
Moreover, soil frost and snow cover reduce leaching of pollutants during large parts of the
year, which is why warmer winters are also likely to result in increased nutrient loads [22].
In addition, warmer temperatures are likely to increase mineralisation rates and primary
production in the sea [4], although on century-long timescales recent studies expect a
decline in marine primary production [70,71]. It is therefore likely that nutrient residence
times both in sea and on land as well as annual “natural” background loads change in the
future and efforts to combat eutrophication will have to be reinforced compared to current
projections. In addition, numerous feedbacks between eutrophication and other marine
pressures exist. Shifts in the food chain caused by overfishing or habitat loss could, for
example, lead to an increase in phytoplankton blooms due to a lack of natural enemies [58].
The state of eutrophication is thus partly dependent on the management of other pressures.Sustainability 2021, 13, 3872 9 of 18
3.2. Costs of Remediating Agricultural Legacy Nutrient Loads
The literature review comprises a total of 45 studies on remediation measures [16,46–
63,65,72–96], the majority of which dealing with mussel farming (see Table S5). However,
most studies refer to pilot experiments or small-scale implementations; hence, nutrient
removal or immobilisation costs are site-specific and cannot be transferred to the whole
region. An upscaling to larger areas with abatement potentials above 100 t P has only been
undertaken in eight studies, as shown in Table 3.
Table 3. Costs and potential impacts (t P removed or immobilised) of soil and sea-based measures.
Potential Impact Costs
Measure Extent Repetition Reference
[Mt P/a] [€/kg P]
Soil-based
Finland (potential extension to
0.0002–0.0003
Gypsum amendment Sweden, Denmark, Germany, and 55–86 5 years [61,62]
(0.001–0.002)
Poland)
Arable land with clay content
Structural liming 1 >20% in Swedish North and 0.0001 222 10–30 years [58]
South Baltic Sea Water Districts
Sea-based
Swedish Coastal area of the Baltic
Aluminum treatment 1 0.0005 89 one-time [58]
Proper
Deep water oxygenation 2 Baltic Proper 0.060–0.092 2–4 one-time [72,97]
Deep water oxygenation 3 Bornholm Basin (BP) 0.005–0.008 2–5 one-time [55,72]
Finnish parts of the Gulf of
Deep water oxygenation 4 0.00007–0.00012 28–48 annual [54]
Finland
Deep water oxygenation large-scale, not specified not stated 2–75 not stated [63]
Blue mussel farming Baltic Proper 0.010 not stated 1–2 years [65]
Bothnian Sea, Bothnia Bay, Gulf of
Blue mussel farming 0.001 not stated 1–2 years [65]
Finland, Gulf of Riga
1 Costs are given in SEK in [58]. The annual exchange rate for 2011 (1 SEK = 0.1108 €) is used for conversion. 2 Costs are given in SEK in [72].
The annual exchange rate for 2013 (1 SEK = 0.1156 €) is used for conversion. Extent according to [72] (0.092 Mt P) dates back to 2005; while
a more recent study by the same research group estimates 0.060 Mt P [97]. No repetition is considered, as oxygenation is assumed to only
be necessary for 10–15 years [98]. The depreciation time is 20 years [72]. 3 No repetition is considered, as oxygenation is assumed to only be
necessary for 10–15 years [98]. The depreciation time is 20 years [72]. 4 [54] assume that oxygenation has to be conducted permanently
to prevent remobilisation of P from the sediments. The depreciation time is 20 years. A pessimistic scenario, where no reduction in the
internal P source can be achieved is not considered, as no unit costs can be calculated in this case.
Kotta et al. [65] do not provide cost estimates for the regional upscaling of mussel
farming. Their aim is to show that mussel farming can be an effective complement to land-
based measures as an extent of 1500 km2 (0.4% of the Baltic Sea surface area) would suffice
to close the remaining nutrient gaps of the BSAP. However, cost estimates for numerous
individual farms in different region are available, as shown in Table 4.
Table 4. Production costs and required subsidies of blue mussel farming in different regions of the
Baltic Sea. Summary of studies listed in Table S5.
€/kg P €/kg P
Region
(Production Costs) (Required Subsidies)
Outer Baltic (Kattegat and Belt Sea) 114 1 –2846 0–2732
Central Baltic (Baltic Proper) 250–5230 69–5041
Inner Baltic (Bothnian Bay, Bothnian Sea,
728–21,300 131–21,050
Archipelago Sea, Gulf of Finland, Gulf of Riga)
1 Production costs under economically profitable production (see below
Nutrient abatement costs are mainly dependent on mussel yield, which, following the
salinity gradient, tends to decrease from the southwest, where mussel farming is alreadySustainability 2021, 13, 3872 10 of 18
commercially conducted, to the northeast. However, Buer et al. [99] found mussel nutrient
content equally or even more dependent on habitat and harvesting time than on salinity.
Besides, differences in farming and harvesting techniques, as well as investment costs
and assumed lifetime of equipment may have a large impact on production costs under
real farm conditions. For instance, the Swedish Sankt Anna farm, located at a sheltered
site in the Östergötland archipelago, achieved higher yields (3.4 kg/m rope) than a farm
located near Kiel, Germany (2.5 kg/m rope). Model predictions for the two sites were
1.3 kg/m and 14.7 kg/m, respectively [65]. Similarly, in a model with higher spatial
differentiation for the western Baltic, Holbach et al. [100] predict biomass yields of up to
41.7 kg/m rope in areas that were judged unsuitable for blue mussel cultivation by Kotta
et al. [65]. Moreover, contrary to soil- and sediment-based measures, mussel farming is not
only a remediation measure, but could also create economic benefits. In the outer Baltic
0.09 Mt of blue mussels were cultivated and marketed as food in 2016 [101]. Assuming a
P content of 0.088% [65] this corresponds to a removal of 81 t P. Although mussels from
the central and inner Baltic are probably not suitable for human consumption due to their
limited size, there are numerous alternative market opportunities including processing
to feed or fertiliser and production of environmentally friendly anti-corrosive products,
adhesives, or human nutraceuticals [48,51]. Schultz-Zehden et al. [48] estimate that such
markets could become economically viable if production costs do not exceed 0.1 €/kg
(translating to 114 €/kg P in the outer-, 189 €/kg P in the central-, and 250 €/kg P in the
inner Baltic [65]). It is thus evident, that mussel farms will be at least partly dependent
on external subsidies, as shown in Table 4. Yet, mussel farming in the central and inner
Baltic is still in the pilot stage and has therefore generally not been optimised for nutrient
extraction. With increasing experience, technological advances and once a critical size
allowing for industrial production and economies of scale is reached, higher yields and
lower production costs may be possible [47,48,101].
3.3. Remediation Scenario
Although data are not fully comparable because they refer to different regions and
were conducted at different times, Tables 3 and 4 indicate that deep water oxygenation
is the most cost-effective of the sea-based measures, for which larger-scale cost estimates
are available. Thus, it is assumed that deep water oxygenation is implemented to its
full capacity of immobilisation of 0.06–0.09 Mt P in the Baltic Proper, corresponding to
approximately 10% of the agricultural legacy load present in this subbasin. Considering
the cost range of large-scale oxygenation (2–75 €/kg P, as listed in Table 3) under the most
favorable conditions, i.e., where immobilisation capacity is at the higher and costs are at
the lower end of the range, the costs of this measure would amount to 0.2 billion €, whereas
in the opposite, least favorable case, they would be 4.5 billion €. Deep water oxygenation
may also be possible in other subbasins, as shown by Rantajärvi et al. [54]; however, to
date the Baltic Proper is the only subbasin for which potentials have been estimated. The
abatement potential of this measure is therefore most likely underestimated.
The remaining abatement of legacy nutrients in the sea (0.15–0.18 Mt P) is assumed to
be reached via blue mussel farming. Although contrarily to Kotta et al. [65], in this scenario
mussel farming is not perceived as a measure to mitigate current nutrient emissions, but to
remediate the nutrient loads already present in the sea, an equal extent of mussel farming
of 900 km2 with a removal potential of 0.010 Mt P/a in the central and 600 km2 with a
removal potential of 0.001 Mt P/a in the inner Baltic is assumed. This is merely a fraction
of the area considered most suitable for mussel farming by Kotta et al. [65]. Yet, 1500 km2
of mussel farms could easily be achieved under the current spatial planning regime of
the Baltic Sea, whereas large extents could cause spatial conflicts with other uses such as
recreation, aquaculture, environmental protection, transport, or energy generation [65].
Following the same rationale of conservative estimation for the outer Baltic, the current
extent of commercial mussel farming with an annual removal of 81 t P (see Section 3.2)
is assumed. Hence, to remove the remaining agricultural legacy loads mussel farmingSustainability 2021, 13, 3872 11 of 18
would have to be conducted for 29–130 years in the inner-, for 13–93 years in the central-,
and for 76–335 years in the outer Baltic. Because of the conservative estimation of mussel
farm extent, it is assumed that only locations with the most favourable conditions and thus
lowest costs are used. Costs are therefore set to the lower end of the ranges for required
subsidies shown in Table 4. This approach is subject to two main restrictions: Firstly, as
nutrient removal progresses, ecological conditions in the Baltic Sea might change, resulting
in lower food availability and thus lower abatement potentials of mussel farming in the
future. This may necessitate a relocation of mussel farms and entail higher production
costs of mussel farming over time. Secondly, current estimates of mussel production
costs are mostly based on pilot experiments along the coastlines. At least with current
technology offshore production costs are deemed considerably higher [66]. Spatial conflict
among near shore locations may thus be more severe than for overall suitable locations
and mussel farms may be forced to move to less profitable areas. On the other hand, wider
extension of blue mussel farming combined with advancing experience and technology,
as described in Section 3.2, may significantly reduce abatement costs and marketing of
mussels as feed or fertiliser could constitute a new industrial sector creating income and
job opportunities for the region. Furthermore, mussel farming may be supplemented by
other biological measures, which were excluded from the present study because they have
not been demonstrated beyond pilot experiments in single locations. For instance, farming
of zebra mussels or targeted fishing of cyprinids may constitute a viable alternative, where
low salinity leads to high costs of blue mussel farming. Zebra mussels exhibit similar
nutrient removal capacities as blue mussels and a case study in the Curonian Lagoon in
Lithuania revealed annual harvest potentials of up to 40 t/ha [51], which is at the lower
end of blue mussel yields in the western Baltic [49]. According to Mäki [50], up to 8 t P
could be extracted by fishing of roach and breach in the Archipelago Sea (southern part of
the Bothnian Sea) annually. As it is difficult to determine which effects will prevail in the
long run, costs are estimated based on current conditions in the present study.
Thus, considering the most favourable case where P immobilisation via deep water
oxygenation is at its upper range and only 0.15 Mt P have to be removed from the sea via
mussel farming, the total costs of this measure would be 14.1 billion €. If, on the other hand,
P immobilisation is less effective, costs of mussel farming might increase to 86.3 billion €.
Regarding legacy loads on agricultural land, the costs for structural liming and gyp-
sum amendment seem to be in a similar range, considering the different lifetimes of the
measures. Soil gypsum amendment has been chosen for further analysis in this scenario as
abatement potentials have been estimated for a larger region. It has to be noted though,
that costs solely refer to Finnish conditions, but are, in lack of better data, transferred to
other countries. Gypsum amendment of agricultural soils in Finland, Sweden, Denmark,
t PM≤1t
Germany, and Poland could reduce leakage from the mobile pool (i.e., ∑t= 2013 PMt ∗ r BS ) by
more than 50%, leading to an additional transfer of P to the stable soil pool of 0.14–0.18 Mt P.
The remaining 0.24–0.32 Mt leaching to the Baltic Sea are again presumed to be abated via
mussel farming. The additional area of 1500 km2 for mussel farming is not changed so that
the remediation of the land-based load will prolong the period for which mussel farming
has to be conducted to 56–166 years in the inner-, 33–120 years in the central- and 144–428
years in the outer Baltic. As for the sea-based load, the range of costs for abatement of
nutrient emissions from land is defined between a situation where potential immobilisation
of P in soil is at its maximum (0.18 Mt P) and costs at their minimum (55 €/kg P) and the
opposite situation, where immobilisation potential is at its minimum (0.14 Mt P) and costs
at their maximum (86 €/kg P).
Overall abatement costs amount to 32–116 billion € (see Table 5). All calculations are
documented in Tables S3 and S6.Sustainability 2021, 13, 3872 12 of 18
Table 5. Abatement costs of agricultural legacy loads.
Measure P Abatement [Mt] N Abatement [Mt] Costs [Billion €]
Deep water oxygenation 0.060–0.092 0 0.184–4.500
Soil gypsum amendment 0.145–0.183 0 0.010–0.013
Mussel farming 0.406–1.425 5.275–18.511 32.422–111.455
Sea load 0.170–1.102 2.210–14.315 14.055–86.311
Soil load 0.236–0.323 3.065–4.196 18.367–25.144
Total 0.680–1.630 5.275–18.511 1 32.616–115.967
1 N abatement is calculated from the P:N-ratio in harvested mussels [65] and therefore exceeds the agricultural
legacy load shown in Table 2.
It should be born in mind that abatement costs presented here merely constitute a
first rough estimate to monetise the impact of agricultural legacy nutrient loads and more
research is needed to develop a more realistic scenario. Specifically, the most important
assumptions and simplifications of the present abatement scenario are summarised below:
• Abatement will only be undertaken in regions and for measures for which large-scale
estimates are currently available
• Costs and abatement potentials will not significantly differ from predictions made by
upscaling of pilot studies
• Environmental sustainability of abatement measures (especially deep-water oxygena-
tion) can be confirmed in future studies
• The establishment of an industrial sector processing Baltic Sea mussels to fertiliser or
feed will be successful
• Mussel farms can be established in the most suitable locations (predominately near shore)
• Socio-economic and environmental conditions in the Baltic Sea region will remain
stable over a long period (up to 500 years)
Especially the last point constitutes a significant limitation of the present study. Cost
estimates given in Table 5 should therefore only be regarded as preliminary and not be
used for the development of concrete abatement strategies.
3.4. Putting Remediation Costs into Perspective
Despite its preliminary nature the scenario described above shows that the remediation
of agricultural legacy loads in the Baltic Sea is in the same range as the funds budgeted
in the Green Deal for the transformation of the whole European economy. Although the
timeframe for the Green Deal is with eight years much shorter than what is projected for
mussel farming and soil gypsum amendment, it can be assumed that a significant part
of abatement costs arises during the first years, when investment in oxygen pumps, the
establishment of a blue mussel industry in the central and inner Baltic, etc. have to be
undertaken. In the present scenario, 15–40% of total costs arise in the initial 15 years of the
abatement period (see Table S6). Nevertheless, if planned for adequately, mobilisation of
the required funds to tackle agricultural legacy nutrient loads does not seem infeasible. A
contingent valuation study in the coastal states of the Baltic Sea revealed that residents
are willing to pay 3.8–4.4 billion €/year in taxes for the achievement of a Baltic Sea in
good eutrophication status [102]. Although the survey focused on the reduction of nutrient
emissions, results can be transferred to the current study because recently there is increasing
evidence that eutrophication can only be successfully diminished if both current and legacy
nutrient loads are tackled simultaneously [1,3]. Moreover, nutrient abatement does not
only involve costs, but could also yields economic benefits. Both the tourism and the real
estate sector could profit from less frequent algal blooms. This is illustrated by an extensive
algal bloom near the island of Öland, Sweden, in 2005, which led to a decline in tourism
sales of 25%. Especially if the region establishes itself as a knowledge-hub for abatement
technologies, high qualified jobs could be created [16]. Furthermore, jobs in the mussel
industry could provide additional income opportunities for local fishermen, in times where
traditional fishing is becoming more and more challenging [101].Sustainability 2021, 13, 3872 13 of 18
Also compared to the Gross value added (GVA) produced by the agricultural sector in
the region the damage caused by agricultural nutrient emissions appears substantial. While
the former amounts to 20.3 billion €/year (not including Belarus) and 25.6 billion €/year
(including Belarus), mean monetised impacts over the residence time of P in the Baltic Sea
are up to 1.2 billion €/year (see Table S6) and thus 5–6% of GVA. This is a considerable
amount keeping in mind that fertiliser, which is responsible for nutrient emissions, is
only one input factor in agricultural value creation and that the share of subsidies in
agricultural factor income in the HELCOM EU countries is between 42% (Germany) and
73% (Estonia) [103].
Yet, compared to costs of agricultural mitigation measures, which are partly already
undertaken, remediation costs are not necessarily more expensive, as shown in Table 6.
Overall, unit abatement costs in the present scenarios amount to 48–71 €/kg P, whereas costs
of achieving the BSAP goals (including land-based measures other than in the agricultural
sector) have been estimated with 85–205 €/kg P [13,15].
Table 6. Unit abatement costs for P in the present study compared to land-based agricultural
measures. Data from [13–15,104].
Measure Unit Abatement Cost [€/kg P]
Sea-based measures 1 0–21,050
Land-based agricultural measures
Buffer strips and wetlands 50–6790
Catch crops 150–9735
Fertiliser reduction 1–10,920
Livestock reduction 497–150,000
Combination 2 674–1762
1Corresponding to the range of costs of abatement measures listed in Tables 3 and 4. 2. Combination of different
agricultural measures as part of a scenario to fulfill the nutrient reduction needs of the BSA
Nevertheless, this should not be interpreted as an argument to substitute sea-based
measures for measures on land. Not only are the figures of the present assessment prelimi-
nary, but studies on costs of nutrient reductions in the region all date back to around 2010.
Factors such as climate change, which has been shown to substantially reduce the need
for nutrient reductions in several parts of the catchment [17], may change costs of nutrient
reductions in the future. Similarly, measures that have not been regarded in previous
abatement cost studies have recently been explored. For instance, McCrackin et al. [105]
modelled reduction potentials of 28–43 kt N and 4–6.6 kt P by redistributing manure from
livestock intensive regions to regions dominated by crop production, where it replaces
mineral fertiliser. Although costs have not been estimated in this study, a redistribution
of nutrients is likely to entail lower costs than a reduction of fertiliser use or livestock
production as listed in Table 6. Besides, the present study exclusively deals with the reme-
diation of nutrient loads stemming from agriculture, which constitute only 30–50% of the
total legacy P load in the Baltic Sea. Removing or immobilising all legacy P would thus
increase abatement times and costs as well as pressure in terms of availability of space
significantly. Decreasing current nutrient emissions to a minimum should therefore remain
a first priority.
4. Conclusions
Two things become evident from the current research:
First, even in a comparatively well studied and monitored region like the Baltic Sea
catchment, past nutrient loads can only be reconstructed with great uncertainties. Efforts
to harmonise measurement and modelling techniques therefore have to be reinforced and
more research on the mechanisms governing eutrophication is needed. Monetising non-
economic impacts of human activities is always challenging. The calculation of abatement
costs is one of several approaches that, at the same time, outlines a way forward toSustainability 2021, 13, 3872 14 of 18
remediate the damage caused. However, sea-based abatement measures in the Baltic Sea
have not surpassed the pilot stage yet and large knowledge gaps on their capacities, costs,
and potential risks remain. Hence, instead of a full abatement study showing the most
cost-effective solution only a rough estimate of the costs for remediating past agricultural
nutrient loads can be provided to date.
Secondly, despite all uncertainties it is apparent that agricultural nutrient emissions
have caused severe impacts that will affect the region over a long period. The costs
for removing or immobilising nutrient loads that have accumulated in the Baltic Sea
over the past 35–49 years might amount to 5–6% of the GVA generated by the sector.
Remediating agricultural legacy loads will therefore require serious commitment to funding
and implementation of the measures needed. Nevertheless, benefits measured as people’s
willingness to pay for a healthy marine environment exceed remediation costs so that
mobilisation of the required funds does not seem infeasible. Several sea-based measures
have proven successful in pilot experiments and would be ready for implementing on a
larger scale. Upscaling must, however, be accompanied by on-going research to improve
the effectiveness of the measures and to avoid negative side effects and spatial conflicts
with other uses. Thus, it may be possible to identify the most beneficial mix of measures
for different locations that might even create income and job opportunities for the region in
the long term.
Regarding the second aim of the study, no clear conclusion on the costs of avoiding
agricultural nutrient emissions compared to those of remediating the eutrophication im-
pacts caused by them can be drawn. This is partly due to the high uncertainties associated
with our calculations and partly because costs seem to be in a similar range. In any case,
land-based measures and measures tackling internal legacy nutrient loads in the sea should
not be regarded as alternatives but as complements. While the former will not show imme-
diate effects if nutrient stocks in the sea remain high, the capacity of seabased measures is
limited and insufficient to remediate unrestrained nutrient inputs.
Supplementary Materials: The following are available online at https://www.mdpi.com/article/10
.3390/su13073872/s1, Table S1: Calculation of agricultural legacy N loads in the Baltic Sea, Table S2:
Calculation of agricultural legacy P loads in the Baltic Sea, Table S3: Legacy P loads on agricultural
land under different abatement scenarios, Table S4: GVA of the agricultural sector in the Baltic Sea
region, Table S5: Literature review of remediation measures for legacy nutrient loads in the Baltic
Sea, Table S6: Abatement costs of the sea-based agricultural legacy load in the Baltic Sea.
Author Contributions: Conceptualization, L.H. and J.T.; methodology, L.H. and J.T.; validation, L.H.,
R.H. and J.T.; formal analysis, J.T.; investigation, J.T.; resources, R.H.; data curation, J.T.; writing—
original draft preparation, J.T.; writing—review and editing, L.H., R.H. and J.T.; visualization,
J.T.; supervision, L.H.; project administration, L.H. and R.H.; funding acquisition, L.H. and R.H.
All authors have read and agreed to the published version of the manuscript.
Funding: This research was performed within the project Lex4Bio, funded by the European Union’s
Horizon 2020 research and innovation program, grant number 818309, including the APC for pub-
lishing this article.
Conflicts of Interest: The authors declare no conflict of interest. The funders had no role in the design
of the study; in the collection, analyses, or interpretation of data; in the writing of the manuscript, or
in the decision to publish the results.
References
1. European Environmental Agency. Nutrient Enrichment and Eutrophication in Europe’s Seas. Moving Towards a Healthy Marine
Environment; Publications Office of the European Union: Luxembourg, 2019.
2. United Nations. The Sustainable Development Goals Report 2018; United Nations Publications: New York, NY, USA, 2018.
3. HELCOM. HELCOM Thematic Assessment of Eutrophication 2011–2016. Baltic Sea Environment Proceedings No.156. 2018. Avail-
able online: http://www.helcom.fi/baltic-sea-trends/holistic-assessments/state-of-the-baltic-sea-2018/reports-and-materials/
(accessed on 30 March 2021).Sustainability 2021, 13, 3872 15 of 18
4. HELCOM. State of the Baltic Sea—Second HELCOM Holistic Assessment 2011–2016. Baltic Sea Environment. 2018. Available
online: www.helcom.fi/baltic-sea-trends/holistic-assessments/state-of-the-baltic-sea-2018/reports-and-materials/ (accessed
on 30 March 2021).
5. HELCOM. Baltic Sea Action Plan. Reaching Good Environmental Status for the Baltic Sea. Available online: https://helcom.fi/
baltic-sea-action-plan/ (accessed on 2 December 2020).
6. EUSBSR. EU Strategy for the Baltic Sea Region. 2020. Available online: https://www.balticsea-region-strategy.eu/ (accessed on
2 December 2020).
7. Ollikainen, M.; Hasler, B.; Elofsson, K.; Iho, A.; Andersen, H.E.; Czajkowski, M.; Peterson, K. Towards the Baltic Sea Socioeconomic
Action Plan. Ambio 2019, 48, 1377–1388. [CrossRef] [PubMed]
8. Barquet, K.; Rosemarin, A.; Järnberg, L.; Joshi, S.; Leader, E.; Olsson, O.; Sindhöj, E. Mission Blue—Exploring Circular Interven-
tions in the Baltic Sea Region. Bonus Return. 2020. Available online: https://www.bonusreturn.eu/mission-blue-exploring-
circular-interventions-in-the-baltic-sea-region/ (accessed on 30 March 2021).
9. European Commission. The European Green Deal, Brussels. 2019. Available online: https://ec.europa.eu/info/strategy/
priorities-2019-2024/european-green-deal_en (accessed on 30 March 2021).
10. European Commission. Missions in Horizon Europe. Available online: https://ec.europa.eu/info/horizon-europe/missions-
horizon-europe_en (accessed on 2 December 2020).
11. European Commission. Available online: https://ec.europa.eu/info/strategy/priorities-2019-2024/european-green-deal_en
(accessed on 2 December 2020).
12. Geitzenauer, M.; Blondet, M.; de Koning, J.; Ferranti, F.; Sotirov, M.; Weiss, G.; Winkel, G. The challenge of financing the
implementation of Natura 2000—Empirical evidence from six European Union Member States. For. Policy Econ. 2017, 82, 3–13.
[CrossRef]
13. BalticSTERN Secretariat. The Baltic Sea—Our Common Treasure. Economics of Saving the Sea; (USAB Stockholm); Swedish Agency
for Marine and Water Management: Göteborg, Sweden, 2013.
14. Ahlvik, L.; Ekholm, P.; Hyytiäninen, K.; Pitkänen, H. An economic-ecological model to evaluate impacts of nutrient abatement in
the Baltic Sea. Environ. Model. Softw. 2014, 55, 164–175. [CrossRef]
15. Wulff, F.; Humborg, C.; Andersen, H.E.; Blicher-Mathiesen, G.; Czajkowski, M.; Elofsson, K.; Fonnesbech-Wulff, A.; Hasler, B.;
Hong, B.; Jansons, V.; et al. Reduction of Baltic Sea Nutrient Inputs and Allocationof Abatement Costs Within the Baltic Sea
Catchment. Ambio 2014, 43, 11–25. [CrossRef]
16. Dahlgren, S.; Källström, N.; Lind, F.; Morin, M.; Mrozowski, T.; Seppä, T.; Wallin, M. Restoring Waters in the Baltic Sea Region. In
A Strategy for Municipalities and Local Governments to Capture Economic and Environmental Benefits; The Boston Consulting Group:
Stockholm, Sweden, 2015.
17. Allin, A.; Schernewski, G.; Friedland, R.; Neumann, T.; Radtke, H. Climate change effects on denitrification and associated
avoidance costs in three Baltic river basin—Coastal sea systems. J. Coast. Conserv. 2017, 21, 561–569. [CrossRef]
18. Savchuk, O. Large-scale nutrient dynamics in the Baltic Sea, 1970–2016. Front. Mar. Sci. 2018, 5, 95. [CrossRef]
19. Gustafsson, E.; Savchuk, O.; Gustafsson, B.; Müller-Karulis, B. Key processes in the coupled carbon, nitrogen, and phosphorus
cycling of the Baltic Sea. Biogeochemistry 2017, 134, 301–317. [CrossRef]
20. McCrackin, M.; Muller-Karulis, B.; Gustafsson, B.; Howarth, R.; Humborg, C.; Svanbäck, A.; Swaney, D. A Century of Legacy
Phosphorus Dynamics in a Large Drainage Basin. Glob. Biogeochem. Cycles 2018, 32, 1107–1122. [CrossRef]
21. Andersen, J.H.; Carstensen, J.; Conley, D.J.; Dromph, K.; Fleming-Lehtinen, V.; Gustafsson, B.G.; Josefson, A.B.; Norkko, A.;
Villnäs, A.; Murray, C. Long-term temporal and spatial trends in eutrophication status of the Baltic Sea. Biol. Rev. 2017, 92,
135–149. [CrossRef]
22. Räike, A.; Oblomokova, N.; Svendsen, L.M.; Kaspersson, R.; Haapaniemi, J.; Eklund, K.; Brynska, W.; Hytteborn, J.; Tornbjerg, H.;
Kotilainen, P.; et al. Background information on the Baltic Sea catchment area for the Sixth Baltic Sea Pollution load compilation
(PLC-6). HELCOM. 2019. Available online: https://helcom.fi/helcom-at-work/projects/plc-6/ (accessed on 30 March 2021).
23. Eurostat. Main Farm Land Use by NUTS 2 Regions [ef_lus_main]. 2020. Available online: https://appsso.eurostat.ec.europa.eu/
nui/show.do?dataset=ef_lus_main&lang=en (accessed on 29 March 2020).
24. Eurostat. Main Livestock Indicators by NUTS 2 Regions [ef_lsk_main]. 2020. Available online: https://appsso.eurostat.ec.europa.
eu/nui/show.do?dataset=ef_lsk_main&lang=en (accessed on 29 March 2020).
25. Knoema. Kaliningrad Region. Available online: https://knoema.com/atlas/Russian-Federation/Kaliningrad-Region (accessed
on 14 December 2020).
26. Knoema. Karelia, Republic of. Available online: https://knoema.com/atlas/Russian-Federation/St-Petersburg-City (accessed
on 14 December 2020).
27. Knoema. Tver Region. Available online: https://knoema.com/atlas/Russian-Federation/Tver-Region (accessed on 14 December
2020).
28. Knoema. Smolensk Region. Available online: https://knoema.com/atlas/Russian-Federation/Smolensk-Region/ (accessed on
14 December 2020).
29. Knoema. Pskov Region. Available online: https://knoema.com/atlas/Russian-Federation/Pskov-Region (accessed on 14 De-
cember 2020).You can also read