Assessing Sustainability Performance at the Farm Level: Examples from Greek Agricultural Systems - MDPI
←
→
Page content transcription
If your browser does not render page correctly, please read the page content below
sustainability

Article
Assessing Sustainability Performance at the Farm
Level: Examples from Greek Agricultural Systems
Irene Tzouramani 1, * , Stamatis Mantziaris 1,2         and Pavlos Karanikolas 2
 1    Agricultural Economics Research Institute, Hellenic Agricultural Organization, Athens 11528, Greece;
      sta.athens@hotmail.com
 2    Department of Agricultural Economics and Rural Development, Agricultural University of Athens,
      Athens 11855, Greece; pkaranik@aua.gr
 *    Correspondence: tzouramani@agreri.gr

 Received: 29 February 2020; Accepted: 3 April 2020; Published: 7 April 2020

 Abstract: In recent years, farmers and policymakers have faced ample challenges and have struggled
 to support the sustainability of the agricultural sector. Sustainable agriculture encompasses multiple
 concepts, and its performance produces extensive debate about data requirements, appropriate
 indicators, evaluation methods, and tools. Under the European Union (EU) financed project FLINT
 (Farm Level Indicators for New Topics in policy evaluation), detailed data have been collected at the
 farm level to provide broader coverage of sustainability indicators on a wide range of relevant topics
 to facilitate the assessment of sustainability performance. The approach has been applied in a pilot
 network of representative farms at the EU level, considering the heterogeneity of the EU farming sector
 to provide data infrastructure with up to date information for sustainability indicators. This study
 aims to assess sustainability performance at the farm level in Greece. Representative and dominant
 agricultural systems, such as permanent crops, olive trees, arable crops, and livestock (sheep) farms,
 comprise the Greek sample. It uses the analytical hierarchy process (AHP) methodology and attempts
 to gain insights into the sustainability performance of agricultural systems. The outcome of the
 sustainability assessment reveals knowledge and develops support for strategic farm choices in order
 to support both farmers and policymakers towards more sustainable development plans. The results
 indicate that three typical Mediterranean farming systems, namely permanent crops, olive trees,
 and extensive livestock systems (sheep farms), are more sustainable in contrast to intensive and arable
 crop farms.

 Keywords: sustainability assessment; farm level; AHP methodology; agricultural policy; Greece

1. Introduction
     Today, there is growing interest in assessing the sustainability of agriculture. Sustainability has
become a high priority, both in scientific research and in policy agendas [1]. Despite the existence of
many studies examining particular dimensions, the need for an integrated assessment of sustainability
at the farm level has been widely recognized in scholarly research [2–9]. This realization is a result of
the sustainability concerns of citizens, as well as frequent policy changes, which create new information
needs for all sustainability dimensions at the farm scale [10,11]. In the concurrent consideration of
the multifaceted nature of sustainability at the farm level, diverse methods for the measurement of
indicators and the aggregation of scores have been used [12,13]. The most frequently used methods
include tools, frameworks, and indices based on indicators. These are followed by multi-criteria
methods, including the analytical hierarchy process (AHP) [9,14–18].
     However, the above task is hampered by the complexity of the sustainability concept and the
heterogeneity of agricultural systems [19], as well as the limited availability of data, which could

Sustainability 2020, 12, 2929; doi:10.3390/su12072929                          www.mdpi.com/journal/sustainability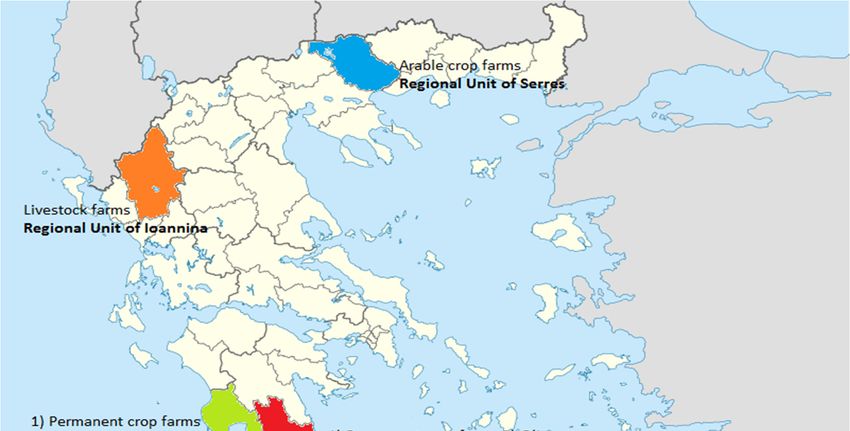
Sustainability 2020, 12, 2929                                                                        2 of 22

possibly allow the calculation of meaningful and relevant indicators [20]. Besides the lack of data
at the farm level, recent research has pointed out the need to broaden the scope and complement
well-established monitoring tools, such as farm accountancy data networks (FADN) [10,20]. Also, any
effort for the assessment of sustainability involves various controversial issues, including the process of
computing composite indicators, which encompass much information from multiple indices [6,9,11].
      The sustainability assessment of Greek agriculture is crucial and could provide vital information
for an appropriate strategy that will support its improvement. Greek agriculture features a high
degree of sectorial and spatial heterogeneity, as well as a prevailing small-scale structure. In addition,
various farming systems of crucial importance are extensive. For example, the average density in olive
orchards is 139 trees per hectare (ha), which is much lower than the threshold of intensive systems
(more than 180 trees per ha) [21,22]. Similarly, the extensive production system is dominant in sheep
rearing, with 78% of the Greek sheep flocks being reared in low-input production systems [23]. On the
other hand, Greek agriculture presents some noteworthy distinctive features compared to the majority
of EU countries, such as the highest share of permanent crops (tree cultivations and vineyards) in the
total utilized agricultural area (UAA) among EU countries [24], as well as large numbers for sheep and
goat rearing, mainly for the production of dairy products rather than meat.
      As a part of the broader Mediterranean region, Greek agriculture is facing a series of challenges
with clear sustainability implications, such as fragile social structures, the intensive exploitation of
natural resources, increasing risks of droughts and biodiversity loss, decrease in crop yields, and rising
demand for water [25,26]. At the same time, the long-term viability of farms is in jeopardy, all the more
so because most of them are small and are less powerful actors in a rapidly consolidating agri-food
system. All these challenges undoubtedly imply a necessity for a multidimensional sustainability
assessment at the level of farms. It has to be noted that, with a few exceptions [27–29], the literature on
this critical issue is scant in regard to Greek agriculture.
      This study aims to conduct a comparative assessment of the sustainability performance of various
agricultural sectors by using an AHP method to aggregate sets of economic, social, and environmental
sustainability indicators. To this end, we use data from different sources, including farm-level data
from FADN, complemented with additional data from the EU FLINT project (Farm Level Indicators for
New Topics in policy evaluation), along with expert opinions and stakeholder views. This synthetic
approach is applied across the professional farms of four typical farming systems in Greece, i.e., arable
crops, olive trees, permanent crops, and livestock. All these sectors account for nearly half of the total
output of Greek agriculture [30], while they are vital for many rural areas of the country. In addition,
these systems are characteristic not only for Greece but also for many other Mediterranean countries.
      The paper is organized as follows. Firstly, the applied methodology and the data used in the
study are described. Secondly, the empirical application is then presented, followed by the discussion
of the results. Finally, the paper concludes by reporting the main findings.

2. Materials and Methods

2.1. Analytical Hierarchy Process
      The analytical hierarchy process (AHP) method was employed here to assess the sustainability of
performance at the farm level. The AHP method can be useful in addressing sustainability issues since
it can accommodate conflicting, multi-dimensional, and incommensurable sets of objectives [31] and
is considered by many as the most reliable multiple criteria decision analysis (MCDA) method [18].
The AHP methodology has been used widely, either alone or in combination with other MCDA methods
such as Preference Ranking Organization Method for Enrichment of Evaluations (PROMETHEE),
Elimination Et Choix Traduisant la Realité (ELECTRE), Technique for Order of Preference by Similarity
to Ideal Solution (TOPSIS) for the sustainability assessment of various aspects of the agricultural sector
(e.g., agricultural production models, cultivation techniques, farm types, public policies, and conceptual
issues such as development models, etc.) and various regions.
Sustainability 2020, 12, 2929 3 of 22
More specifically, the AHP has been implemented in the comparative sustainability analysis
of agricultural production models (organic, integrated, and conventional) for the cultivation of
the olive trees in the Mediterranean [32,33]. The sustainability levels of alternative cultivation
techniques have also been estimated, such as the tillage practices of maize in Poland [34] and irrigation
management alternatives in Portugal [31]. Important agricultural regions in China and Romania have
been assessed from the sustainable agricultural point of view [35,36]. Furthermore, the dimension
of farm-type sustainability has been investigated in the cases of the irrigated agriculture of the
Duero Basin in Spain [37] and dairy farming and its possible geographic variability in Portugal [38].
Also, the prioritization of public policies has been analyzed through AHP to support farmer livelihoods
in sugarcane growing regions in Brazil under the three pillars of sustainability [39]. Appropriate
conceptual models, such as sustainable agricultural development and ethics models in Iran, have been
determined via the AHP methodology [40,41].
In the case of Greece, the AHP has been implemented to evaluate the most sustainable farm
management practice for the cultivation of Pistacia vera L. on the island of Aegina [28], but also to identify
the optimum locations for adoption, and the formation of precision farming clusters as a sustainable
solution in the region of Central Macedonia, Greece [18]. Alternative multi-criteria methods have also
been applied for sustainability analysis of the agricultural sector in Greece. Dantsis et al. [27] applied
multiple attribute value theory to evaluate the sustainability of farms in two geographical regions [42],
and Papathanasiou et al. [43] applied TOPSIS and VIseKriterijumska Optimizacija I Kompromisno
Resenje (VIKOR) methods to classify the rural areas of Central Macedonia in northern Greece using a
set of social sustainability indicators. Although MCDA methods have been used for sustainability
analysis in Greek rural areas, the current study presents a comprehensive sustainability analysis, taking
into account the three major types of farming (arable farming, tree farming, and livestock farming).
2.2. Description of the Main Methodological Issues and AHP
The AHP method was developed by Saaty [44] and is considered an efficient method for dealing
with multiple criteria for decision-making problems, aiming to find the optimal choice among
alternatives, based on the objective set, taking into account a set of criteria. The steps for applying the
AHP method are described below.
2.2.1. Development of the AHP Model
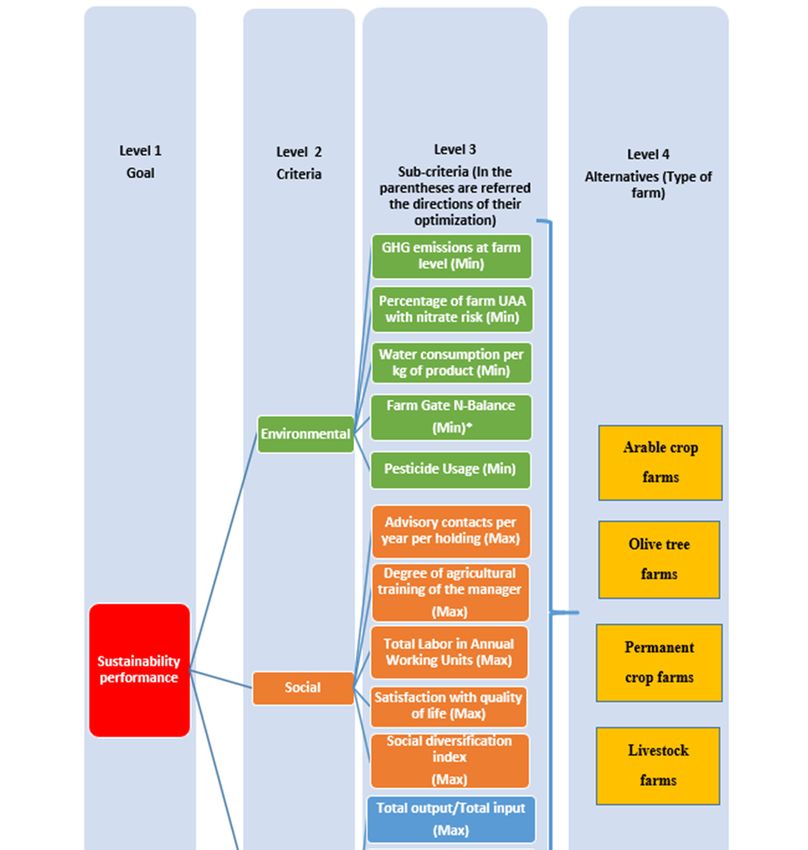
The first step corresponds to the structure of the decision within a hierarchical model. The decision
problem is structured at different levels of the hierarchy, which are usually three or four; in particular,
level 1 of the hierarchy corresponds to the objective, level 2 to the criteria, level 3 to the sub-criteria,
and level 4 to the alternatives. As can be seen, in our research, we included four levels of the hierarchy
(see Section 2.4.3).
2.2.2. Determining Local Priorities (Weights) for the Sub-Criteria and Criteria
A pairwise comparison matrix is filled, referred to as A (Saaty’s hierarchy matrix). It contains the
performance of each criterion (or sub-criterion) against each other, taking into consideration expert
judgment [45].
Saaty [44] suggested a scale from 1 to 9 in order to determine the preference intensity among
criteria or sub-criteria (see Table 1). The subsequent rules must be followed when constructing the
comparison matrix:
• If aij = a, then aji = 1/a;
• If criterion or sub-criterion i has equal importance to criterion or sub-criterion j, respectively, then
aij = aji = 1, so aii =1 for all i [45].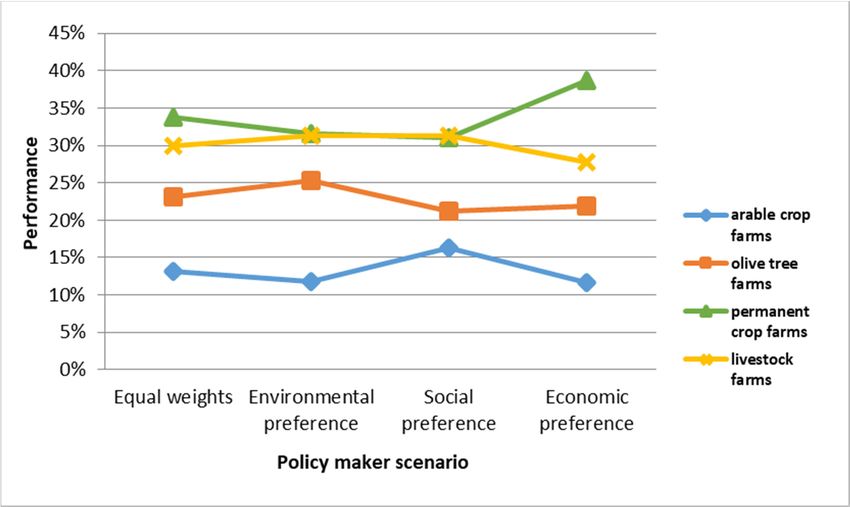
Sustainability 2020, 12, 2929                                                                     4 of 22

                                Table 1. Evaluation scale for pairwise comparisons.

                      Verbal Evaluation                                           Value
           The two factors are of equal importance                                   1
         i element is slightly more important than j                                 3
             i element is clearly important than j                                   5
                i is much more important than j                                      7
     i is extremely more important comparing with j                                  9
                      Intermediate values                                        2, 4, 6, 8
                                                   Source: [45].

     After constructing the pairwise comparison matrix A, its consistency should be checked by
following the four steps below:

1.     Calculation of A*W T , where W concerns the criteria or sub-criteria weights. In more detail,
       the evaluation of the weights W 1 . . . Wn of the criteria or sub-criteria is made as follows:

      (1)       Each element of column i of the comparison matrix A is divided with the sum of the
                column. This results in a normalized table whose sum equals 1
      (2)       Calculation of mean value of row i in the normalized table [45].
2.     Calculation of the largest eigenvector (λmax):

                                                   n
                                                1 X ith entry in AW
                                                                                                     (1)
                                                n
                                                  i=1
                                                      ith entry in W

      where n corresponds to the dimension of the pairwise comparison matrix [45].
3.    Estimation of the consistency index (CI):

                                                          (λmax) − n
                                                   CI =                                              (2)
                                                            n−1

      The lower levels of the consistency index (CI) are associated with lower levels of inconsistency,
      which is desirable.
4.    The consistency index (CI) estimated in the previous step is compared with the random index
      (RI), which is the mean CI of 500 randomly filled matrices [46]. The indicator derived from this
      comparison is the consistency ratio (CR):

                                                               CI
                                                       CR =                                          (3)
                                                               RI

     The acceptable level of the CR may not exceed 10%; however, some authors have suggested that
the acceptable level of the CR may expand to 20% [34,47]
     In order to prioritize the economic sub-criteria, AHP pairwise comparison questionnaires were
distributed to experts at the Agricultural University of Athens, the Agricultural Economics Research
Institute, and the Technical University of Crete. Among the completed questionnaires, those who
achieved a CR ≤ 10% or those who marginally exceeded this threshold were taken into account in
our analysis. We then calculated the average of their weights for each sub-criterion to derive the
final local priorities of the economic sub-criteria. In the case of the hierarchy process of social and
environmental sub-criteria, the averages of experts’ responses to the European Union project FLINT
were used. Within the FLINT project, the hierarchy process was implemented via a scale from 2 to
−2 (where 2 = ++; 1 = +; 0 = +/−; −1 = −; −2 = −−) and then incorporated by the authors into the
pairwise comparison matrix. After completing the comparison matrices, the consistency test was carried
out, where the CR received values of less than 4% in both categories of the sub-criteria. At this point,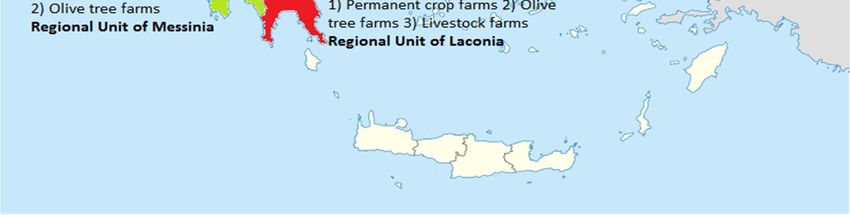
Sustainability 2020, 12, 2929                                                                         5 of 22

it should be noted that the weights of the criteria (level 2) were not determined by experts but preferred to
apply a variety of distributions (scenarios), with emphasis on a different criterion each time. The baseline
scenario corresponds to the distribution of 0.33/0.33/0.33 among the three criteria considered, namely,
the environmental, social, and economic criteria. In the case of the preferred scenario, the distribution
was broken down to 0.5/0.25/0.25. For example, in the case of the environmental preference scenario, the
weight for environmental criterion equaled 0.5, while, for each of the other two criteria, they equaled 0.25.

2.2.3. Determining Local Priorities for the Alternatives
     For each sub-criterion, the performances of the alternatives were compared via pairwise
comparisons using a scale of 1 to 9 as before (Section 2.2.2). Additionally, consistency tests were
performed in the process of evaluating the performance of the alternatives for each sub-criterion, where
the CR was limited to values below 5%. Then, the weight of each sub-criterion was multiplied by the
corresponding performance of each alternative and then summed up to estimate the local priorities of
alternatives for each criterion (or performance for each criterion, namely environmental, social and
economic performance). The performances of alternatives for each criterion or sub-criterion sum to 1.

2.2.4. Determining Overall Priorities for the Alternatives and Sensitivity Analysis
     In order to determine the overall priorities (or performances) of the alternatives, we synthesized the
performance of each alternative for each criterion and the weight of the corresponding criterion, which
was determined in the form of the scenarios mentioned above. More specifically, the performances of
alternatives for each criterion were multiplied by the corresponding criteria weights and summed up
to calculate the overall performances of the alternatives.

2.3. Data Collection and Sample Description
      Data were collected in the framework of the European research project FLINT, whose primary
objective was to provide indicators for assessing agriculture sustainability at the farm level to support
policy evaluation [10]. A wide range of indicators have been organized to cover several sustainability
themes and merged with the FADN database, where economic indicators are dominant [6]. The Greek
case study collected data from the most prevailing farming types in the country, including permanent
crops, olive tree farms, arable crops farms, and livestock (sheep) farms. The optimal farm selection plan
was based on two determinant factors, namely, the farm holding had to be part of the FADN, following
the design of the selection plan on FADN structure covering the farming type and farm economic size
classes, and willingness of the farmer to cooperate. In Greece, a sample of 124 agricultural holdings
was selected, following the goal to have at least 25 observations per principal type of farming. The data
were collected with educated data collectors via face-to-face interviews in the spring of 2016, referring
to the calendar year of 2015.
      The Greek survey took place in different geographical areas according to the locations of the
farming types. Arable crops farms are located in the regional unit of Serres, cultivating mainly irrigated
crops such as maize, cotton, and alfalfa (Figures 1 and 2). These farms have the highest percentage of
irrigated land (76.5%) compared to other types of the surveyed farms, and the vast majority of them
are in lowland areas (87%) (Table 2). The olive tree farms are located in the regional units of Laconia
and Messinia (Figure 2). Almost all of the cultivated land is occupied by olives, mainly non-irrigated
(Figure 1). The irrigation rate corresponds to 42.5%, and the majority of farms are in lowland areas
(46%) (Table 2). The permanent crop farms of the survey are mainly located in the regional units of
Laconia and Messinia (Figure 2). The distribution of crops consists mostly of trees such as olives
and oranges (Figure 1). The percentage of irrigated land is 42.2%, and the majority of farms are in
lowland areas (53%) (Table 2). Finally, regarding the livestock farms of the survey, they are located in
the regional units of Ioannina and Laconia (Figure 2). The average number of sheep corresponds to
25.9 livestock units, and the mainland uses correspond to pastures and the cultivation of animal feeds
such as alfalfa (Figure 1). The percentage of irrigated land is 8.9% of total land, which is by far the
Altitude 300–600 m as a percentage of
                                                                19%                  29%                 6.7%              42%
                            farms
          Altitude > 600 m as a percentage of farms             28%                  25%                 6.7%              50%
            Gender of farm manager (% female)                   37%                  42%                 16%               16%

                                               Degree of agricultural education of farm manager

            Only
Sustainability   practical
               2020,       agricultural experience
                     12, 2929                                   24%                  32%                 44%               53%         6 of 22
                 Basic agricultural training                     -                     -                 4%                17%
                 Full agricultural training                     76%                  68%                 52%               30%
              Source: Authors, based on farm accountancy data networks (FADN) and farm-level indicators for
smallest compared to the other studied farm types, and the majority of farms are in mountainous areas
          new topics in policy evaluation (FLINT) data.
(50%) (Table 2).

                                 Arable crop farms                                           Olive tree farms

                       other crops
                          d. wheat                                                other crops
                             fallow
                    rice(irrigated)
              sunflower(irrigated)                                           olives(irrigated)
                             barley
                 alfalfa(irrigated)
                 cotton(irrigated)                                                      olives
                  maize(irrigated)

                                  0% PEER
      Sustainability 2020, 12, x FOR    10%    20%
                                          REVIEW          30%                                    0%      20%     40%     60% 7 of 23
       Sustainability 2020, 12, x FOR PEER REVIEW                                                                                7 of 23

                                        (a)                                                            (b)
                           Permanent crop farms                                                 Livestock farms
              Figure 1. Crop Permanent    crop
                                 allocation    farms
                                             per farming system; (a) arable crop farms; (b) Livestock
                                                                                                  olive treefarms
                                                                                                             farms; (c) permanent
              crop farms;    (d)
                     other crops  livestock farms.                              other  crops
                      other crops                                                 other crops
                                                                           maize(irrigated)
                            vines                                           maize(irrigated)
                              vines                                                   fallow
                                                                                        fallow
             oranges(irrigated)                                                       alfalfa
               oranges(irrigated)                                                       alfalfa
                                                                          alfalfa(irrigated)
                olives(irrigated)                                           alfalfa(irrigated)
                 olives(irrigated)                                                   grazing
                                                                                       grazing
                            olives                                                  pasture
                             olives                                                   pasture
                                      0%    20% 40% 60%                                    0%          20%      40%     60%
                                       0%    20% 40% 60%                                    0%          20%      40%     60%

                                       (c)
                                        (c)                                                           (d)
                                                                                                       (d)
      Figure 1. Crop allocation per farming system; (a) arable crop farms; (b) olive tree farms; (c) permanent
      crop farms; (d) livestock farms. Figure 2. Locations of the sample farms.
                                                 Figure 2. Locations of the sample farms.

      2.4. Description of Sustainability Figure
                                         Indicators at the FarmofLevel
                                                 2. Locations     the sample farms.
       2.4. Description of Sustainability Indicators at the Farm Level
           A set of indicators was selected to comprehensively and reliably represent the farming systems,
            A set of indicators was selected to comprehensively and reliably represent the farming systems,
      encountering the complexity and the multifunctional character of Greek agriculture. Within the
       encountering the complexity and the multifunctional character of Greek agriculture. Within the
      FLINT project, an extensive literature review identified a selection of core variables and themes of
       FLINT project, an extensive literature review identified a selection of core variables and themes of
      sustainability [6]. The themes cover the three sustainability dimensions known as “triple P”, i.e.,
       sustainability [6]. The themes cover the three sustainability dimensions known as “triple P”, i.e.,
      planet (environmental), people (social), and profit (economic) (Table 3), following the definition of
       planet (environmental), people (social), and profit (economic) (Table 3), following the definition of
      the United Nations, i.e., that sustainable development pertains equally to ecological, social, and
       the United Nations, i.e., that sustainable development pertains equally to ecological, social, and
      economic issues. The indicators of sustainability at the farm level were chosen from the wide list of
       economic issues. The indicators of sustainability at the farm level were chosen from the wide list of
Sustainability 2020, 12, 2929 7 of 22
Table 2. Descriptive statistics of the Greek sample.
Permanent Crop Arable Crop
Variables Olive Tree Farms Livestock Farms
Farms Farms
Holder’s average age (years) 52.6 50.8 50.2 53.6
Total size or total utilized agricultural area (UAA) ha 248.8 225.3 330.8 537.9
Average size (UAA) ha 7.8 9.8 22 22.4
Irrigated land (% of UAA) 42.1% 42.5% 76.5% 8.9%
Average livestock units of sheep - - - 25.9
Altitude < 300 m as a percentage of farms 53% 46% 86.7% 8%
Altitude 300–600 m as a percentage of farms 19% 29% 6.7% 42%
Altitude > 600 m as a percentage of farms 28% 25% 6.7% 50%
Gender of farm manager (% female) 37% 42% 16% 16%
Degree of agricultural education of farm manager
Only practical agricultural experience 24% 32% 44% 53%
Basic agricultural training - - 4% 17%
Full agricultural training 76% 68% 52% 30%
Source: Authors, based on farm accountancy data networks (FADN) and farm-level indicators for new topics in
policy evaluation (FLINT) data.
All farms were family farms, with full agricultural training, and the average age of managers was
51.7 years. It is worth mentioning that female managers were more predominant in permanent crops
and olive farms, in contrast to the other farm types (Table 2). Regarding the economic size of farms,
as determined by FADN standard output (SO), the majority of permanent crop farms (58%), arable
crops farms (47%), and livestock farms (58%) were considered large (SO > €25,000). The majority
of olive tree farms (48%) were considered medium (SO €8000–25,000), while presenting the largest
percentage of small farms (17%) compared to other farm types (SO < €8000). In addition, there were no
very large farms in the case of olive tree farms (SO > €50,000), whereas small farms were not observed
in the case of livestock farms (SO < €8000).
2.4. Description of Sustainability Indicators at the Farm Level
A set of indicators was selected to comprehensively and reliably represent the farming systems,
encountering the complexity and the multifunctional character of Greek agriculture. Within the
FLINT project, an extensive literature review identified a selection of core variables and themes of
sustainability [6]. The themes cover the three sustainability dimensions known as “triple P”, i.e.,
planet (environmental), people (social), and profit (economic) (Table 3), following the definition of the
United Nations, i.e., that sustainable development pertains equally to ecological, social, and economic
issues. The indicators of sustainability at the farm level were chosen from the wide list of 33 topics
developed by the FLINT project consortium, taking into account policy needs [48] and consultation
from stakeholders and FLINT partners [49,50]. The mean value of each indicator for each farm type
corresponds to a sub-criterion, which is used as the input by the AHP model (see also Figure 3).
Table 3. Set of sustainability indicators at the farm level.
Sustainability Dimension Indicator Unit Source
Greenhouse gas (GHG) emissions at farm tCO2 eq/ha FLINT e_14_1
Percentage of farm UAA with nitrate risk % FLINT e_10_4
Environmental Water consumption per kg of product Lt/kg FLINT e_16_1
Farm gate N-balance Kg/ha FLINT e_5_1
Pesticide usage Kg/ha FLINT e_4_1
Advisory contacts per year per holding n FLINT s_1_1
Degree of agricultural training of the manager Category FLINT s_2_1
Social Total labor in annual working units n FLINT s_5_1
Satisfaction with quality of life n FLINT s_6_4
Social diversification index Count FLINT s_7_2
Total output/total input Euro FADN SE132
Total subsidies/family farm income Euro FADN SE605/SE420
Economic
(Family farm income/family work unit)/reference income Euro FADN SE430
Farm net value added (FNVA) Euro FADN SE415
Source: Authors, based on FLINT and FADN data sources.Sustainability 2020, 12, 2929 8 of 22
Sustainability 2020, 12, x FOR PEER REVIEW 11 of 23
Figure 3. Analytical hierarchy process (AHP) model for the assessment of the sustainability performance;
Figure 3. Analytical hierarchy process (AHP) model for the assessment of the sustainability
(*) Values that tend to approach zero are considered more ideal than others that are far from zero; in the
performance; (*) Values that tend to approach zero are considered more ideal than others that are far
case of negative values, they are converted to absolute values so that they are directly comparable to
from zero; in the case of negative values, they are converted to absolute values so that they are directly
positive values.
comparable to positive values.
3. Results
3.1. Environmental PerformanceSustainability 2020, 12, 2929 9 of 22
2.4.1. Environmental Indicators
GHG emissions at farm level: The GHG emission per farm (tons of carbon dioxide equivalent, i.e.,
tCO2 eq.) is a primary policy target and is estimated using the tier 1 and tier 2 procedures of the
Intergovernmental Panel on Climate Change—IPCC [48]. The best value for this indicator is a low
one, which means a more environmentally sustainable farm. It provides useful information about the
applied production practices and more broadly about the agricultural systems. Moreover, it supports
the long-term evaluation of GHG production and is enhanced with the relevant information on the
right Common Agricultural Policy (CAP) actions for climate change mitigation. It also helps to adjust
the applied strategy for Greek farming systems and practices that contribute positively to reducing
GHG emissions.
Percentage of farm UAA with nitrate risk: The level of nitrate risk is crucial for economic,
environmental, and health issues [48,51]. Farmers have to care for the cautious suitability of crop
requirements of fertilizers and nutrients in order to adjust optimal cost-effective and environmentally
beneficial management for the farm [52]. A low value of this indicator indicates a more environmentally
sustainable level for the given farm.
Water consumption per kg of product: Water is an essential environmental factor which contributes
to sustainable economic growth. Water, as a limited recourse in the Mediterranean area, is therefore a
central theme to include in the sustainability assessment regarding water consumption in agriculture.
An effective strategy regarding water efficiency can provide a significant contribution to estimate the level
of sustainability. Hence, the level of water consumption through irrigation was estimated. The water
footprint indicator reveals the volume of water consumed by the unit of the product obtained. The lower
the value of this indicator, the more environmentally sustainable the farm is considered to be [53].
Farm gate N-balance: The information about the level of nitrogen use is crucial at the farm level.
It helps farmers to discern conditions to save on fertilizer costs, decrease greenhouse gas emissions,
and enhance agronomic efficiency and environmental sustainability. It supports optimal fertilizer
management, with no adverse impact on either the profitability of production or the environment.
A suggested indicator in the FLINT was the farm gate N-balance [48]. The farm gate approach focuses
on imports and exports, over which the farmers may apply direct control. Values that tend to approach
zero are considered ideal. In the case of negative values, they are converted to absolute values so that
they are directly comparable to positive values. Consequently, the lower the absolute value of this
indicator, the more environmentally sustainable the farm is considered to be.
Pesticide usage: The pesticide usage, or pesticide risk score, has many impacts on farmers,
consumers, and the sustainability of agricultural sectors. Pesticides can have a significant effect on water
quality and can affect water quality for both human and livestock consumption, and aquatic habitats and
wildlife [54]. The indicator refers to the quantities and diverse types of different types of pesticides used
on farms. This information is used to calculate a farm-level pesticide risk score [48]. A low value for this
indicator is preferable, since it showcases that the farm is environmentally sustainable.
2.4.2. Social Indicators
Advisory contacts per year per holding: The total number of contacts with advisory services per
year was used to operationalize the type and the range of themes on which farmers seek advice.
This indicator is a composite one, and it refers to advice-need events related to accountancy, management
or investments, crop and animal production, and other gainful activities. The role of advisory services
is essential to support the dissemination of innovation, and enhance the productivity and improve
environmental performance [55]. Farms with access to advisory services are better informed and
produce better knowledge, and, therefore, may support innovative actions. The higher the value of
this indicator, the more socially sustainable the farm is considered to be.
Degree of agricultural training of the manager: The level of education represents the credentials of
human resources. The higher the value of this indicator, the more socially sustainable the farm is
considered to be.Sustainability 2020, 12, 2929 10 of 22
Total labor in annual working units: The total labor input, expressed in annual work units or full-time
person equivalents, is an indicator that counts the potential of an agricultural sector to retain or even
augment the number of jobs in an area, usually a remote, mountainous, or less favored rural area.
Thus, it is an indicator of significant importance, especially during the crisis period which the Greek
economy has been experiencing within the last ten years. The higher the value of this indicator,
the more socially sustainable the farm is considered to be.
Satisfaction with quality of life: This indicator, as a fundamental dimension in social sustainability,
tries to measure the quality of jobs in the agricultural sector. This helps to determine links between life
quality perceptions and sustainability conditions [56]. The indicator is measured on a scale from zero
to ten. A higher value indicates a more socially sustainable farm.
Social diversification index: The social diversification index describes the openness of the farmer.
It refers to the growth of activities both inside and outside the farm. It accounts for the total number of
activities. It is a clear indication of a significant livelihood strategy of a farm, denoting the range of
diversification activities, both at the farm and the farm household level [48]. The higher the value of
this indicator, the more socially sustainable the farm is considered to be.
2.4.3. Economic Indicators
The evaluation of economic sustainability focuses on the viability, productivity, and dependence
of the relative farming systems. Short-term and long-term viability refer to the level of profitability,
the level of support from subsidies (which determine autonomy), and the long-term sustainability.
Four indicators were used to describe the economic pillar. More specifically, the total output/total
input, total subsidies/farm family income, farm family income per family labor unit compared to the
reference income, and farm net value added.
Total output/total input: The total output per total input indicator refers to the total output of crops
and crop products, livestock, and livestock products, and of the other output, divided by the total
input costs linked to the agricultural activity of the holder and those which are related to the output of
the accounting year. This indicator is a measure of productivity at the farm level. The higher the value
of this indicator, the more economically viable the farm is considered to be.
Total subsidies/farm family income: Total subsidies (excluding investment) are compared with the
farm family income (FFI) to determine to what extent the FFI depends on subsidies, and, consequently,
how sensitive it could be in the case of policy changes. FFI consists of two components, namely,
FFI from the market and subsidies. Therefore, if the FFI from the market is less than zero (i.e., when
cash expenses and depreciation exceed farm output), the index total subsidies/FFI will be higher than
100%. The lower the value of this indicator, the more economically viable the farm is considered to be.
Farm family income/family work unit compared to the reference income: Family farm income is expressed
by the per family work unit and compared to the reference income, i.e., the mean income of a worker
in the non-agricultural sectors of the economy. This indicator reflects a socio-economic approach to
farm economic viability, as it encompasses two different dimensions; firstly, the reproduction of a
farm’s productive system, since with a net farm income greater than zero, the farm revenue covers
both all cash expenses and the depreciation, and secondly, the support of the standard of living of
the farm household. It is possible to assess to what extent the needs of the household members are
fulfilled by comparing the FFI/FWU with the poverty line and the reference income. Thus, we consider
a farm as economically viable if it attains an FFI/FWU value greater than 80% of the reference income.
The higher the value of this indicator, the more economically viable the farm is.
Farm Net Value Added (FNVA): The farm net value added indicator is the remuneration to the fixed
factors of production (work, land, and capital), whether they are external or family factors. The higher
the value of this indicator, the more economically viable the farm is.As for the local priority rankings of the environmental sub-criteria, according to experts, the
farm gate N-balance has the highest weight at 50%, followed by pesticide usage at 25%, percentage
of farm UAA with nitrate risk at 12%, water consumption per kg of product at 8%, and GHG
emissions at 5% (see also Figure 4 and Table A1 in the appendix). The overall environmental
performance shows that livestock farms rank first, with marginal differences from olive tree farms
Sustainability
(see also 2020, 12, 2929
Figure 4 and Table A2 in the appendix). Then, permanent crop farms followed, while the11 of 22
arable crop farms have a significant difference from all other examined farm systems. It is also worth
noting that livestock farms outperform all other farming systems in three out of the five sub-criteria
3. Results
(see also Figure 4, Table 4 and Table A2 in the appendix).
3.1. Environmental Performance
Table 4. Environmental sub-criteria (mean values per farm type).
As for the local GHG priority
Emissions rankings of the environmental sub-criteria, according Pesticide to experts, the farm
Percentage of Farm UAA Water Consumption per Farm Gate N-
gate N-balance has the
at the Farmhighest
Level weight at 50%, followed by pesticide usageUsage at 25%, percentage of farm
with Nitrate Risk kg of Product (Lt/kg) Balance (Kg/ha)
UAA with nitrate risk (tCO at 12%, water consumption per kg of product at 8%,
eq/ha)2
and GHG emissions at 5%
(Kg/ha)
Arable crop
(see also Figure 4 and0.24 Table A1 in the Appendix
61% A). The overall
710.86 environmental
8.32 × 10 performance
139.69 −4 shows
farms
that livestock farms rank first, with marginal differences from olive tree farms (see also Figure 4 and
Olive tree
Table A2farms
in the Appendix 1.22 A). Then, permanent 42% crop farms followed,
126.16 while2.88the
× 10arable crop farms have a
44.11 −4
significant difference
Permanent from all other examined farm systems. It is also worth noting that livestock farms
1.44 35% 120.79 2.64 × 10 72.59 −4
outperform
crop farmsall other farming systems in three out of the five sub-criteria (see also Figure 4, Tables 4
and A2Livestock
in the Appendix 80.43
A). 17% 7.03 2.75 × 10 81.93 −5
farms
100% 70%
90%
60%
Priorities of alternatives (farm types)
80%
70% 50%
priorities of
sub-criteria
60%
40%
Local
50%
30%
40%
30% 20%
Local priorities
20% of sub-criteria
10% arable crop
10% farms
olive tree
0% 0% farms
GHG emissions, Percentage of Water Pesticide Usage Farm Gate N- Overall
at farm level farm UAA with consumption /kg Balance permanent
nitrate risk of product crop farms
livestock
farms
Figure
Figure 4. 4.Performance
Performance of
of farms
farms per
perenvironmental
environmentalsub-criterion and and
sub-criterion overall.
overall.
3.2. Social Performance
Table 4. Environmental sub-criteria (mean values per farm type).
In the case of the social
GHG sub-criteria, the ranking formed Water
by the responses of the experts was as
Percentage of Farm Gate
follows. The total labor in annual
Emissions at working units has a weight of 44%, advisory
Consumption contacts per year per
Pesticide
Farm UAA with N-Balance
the Farm Level
holding has a weight of 29%, satisfaction with per kg of Usage (Kg/ha)
Nitrate Riskquality of life has a weight of 13%, degree of
(Kg/ha)
agricultural training of(tCO eq/ha)
the2manager Product (Lt/kg)
has a weight of 8%, and, finally, the social diversification index
Arable
has a crop farms
weight 0.24 Figure 5 and 61%
of 5% (see also Table A1 in the 710.86
appendix). The 8.32 × 10⁻⁴ overall social
highest 139.69
Olive tree farms 1.22 42% 126.16 2.88 × 10 −4 44.11
performance was observed for livestock farms followed by arable crop farms, permanent crop farms,
Permanent crop farms 1.44 35% 120.79 2.64 × 10⁻⁴ 72.59
and, finally, by olive tree farms (see also Figure 5 and Table A2 in the appendix). −5 The high
Livestock farms 80.43 17% 7.03 2.75 × 10 81.93
3.2. Social Performance
In the case of the social sub-criteria, the ranking formed by the responses of the experts was as
follows. The total labor in annual working units has a weight of 44%, advisory contacts per year per
holding has a weight of 29%, satisfaction with quality of life has a weight of 13%, degree of agricultural
training of the manager has a weight of 8%, and, finally, the social diversification index has a weight of 5%
(see also Figure 5 and Table A1 in the Appendix A). The highest overall social performance was observed
for livestock farms followed by arable crop farms, permanent crop farms, and, finally, by olive tree farms
(see also Figure 5 and Table A2 in the Appendix A). The high performances of livestock farms on twoTable 5. Social sub-criteria (mean values per farm type).
Advisory Contacts Degree of Agricultural Total Labor in Satisfaction with Social
per Year per Holding Training of the Manager Annual Working Quality of Life Diversification
(n) (Category) Units (n) (n) Index (count)
Arable
Sustainability 2020, 12, 292937.6 12 of 22
2.07 1.29 5.33 1.27
crop farms
Olive tree
12.7 2.39 0.96 7.43 1.30
farms
major sub-criteria
Permanent (total15.8labor in annual working
2.44 and advisory1.27
contacts units per
6.06 year per holding)
2.00 explain
crop farms
their high overall
Livestock social performance (see also Figure 5, Tables 5 and A2 in the Appendix A).
33.5 1.75 1.80 6.29 0.92
farms
100% 60%
90%
Priorities of alternatives (farm types)
50%
80%
70%
40%
priorities of
sub-criteria
60%
Local
50% 30%
40%
20%
30%
20% Local priorities
10% of sub-criteria
10% arable crop
farms
0% 0% olive tree farms
Advisory contacts Degree of Total Labor in Satisfaction with Social Overall
per year per agricultural Annual Working quality of life Diversification permanent
holding training of the Units index
manager
crop farms
livestock farms
Figure 5. Performance
Figure 5. Performanceof
offarms
farms per socialsub-criterion
per social sub-criterion and
and overall.
overall.
Table 5. Social sub-criteria (mean values per farm type).
3.3. Economic Performance
Advisory Degree of
According to experts, the economic
Contacts per
sub-criteria ranking
Agricultural
was as
Total Labor in follows: (FFI/FWU)/reference
Satisfaction Social
income has a weight ofYear 50%, Annual Working with Quality Diversification
pertotal output/total
Training ofinput
the has a weight of 22%, FNVA has a weight of 21%,
Units (n) of Life (n) Index (count)
and total subsidies/FFI has a(n)
Holding weightManager
of 6% (see also Figure 6 and Table A1 in the appendix). In terms
(Category)
of thecrop
Arable prioritization
farms of alternatives
37.6 or overall
2.07 economic performance,
1.29 permanent5.33crop farms are the
1.27
Olive tree also
first (see farmsFigure 6 and12.7Table A2 in the 2.39 0.96 significantly from
appendix). They differ 7.43 all other types1.30of
Permanent crop farms 15.8 2.44 1.27 6.06 2.00
farms, followed by olive33.5
Livestock farms
tree farms, livestock
1.75
farms, and, finally,
1.80
arable crop farms.
6.29
It is also worth
0.92
noting that permanent crop farms outperform the other crops in all economic sub-criteria, which
explains their high-performance range over other farming systems (see also Figure 6, Table 6 and
3.3. Economic
Table A2 Performance
in the appendix). Specifically, permanent crops score a lower dependency on subsidies,
which indicates that family
According to experts, thefarm income depends
economic sub-criteriaon market income
ranking wasand not on external
as follows: sources like
(FFI/FWU)/reference
subsidies. The productivity scores were higher compared to all other analyzed sectors, meaning that
income has a weight of 50%, total output/total input has a weight of 22%, FNVA has a weight of
permanent crops have a high value of output and lower costs. Moreover, farm family income had the
21%, and total subsidies/FFI has a weight of 6% (see also Figure 6 and Table A1 in the Appendix A).
highest score, reflecting a primary indicator of farm economic viability in combination with the
In terms of thetoprioritization
revenues cover all cash of expenses,
alternatives
andorthe
overall economic
depreciation performance,
contributes to thepermanent
support ofcrop farmfarms
are the first (see also Figure 6 and Table A2 in the Appendix A). They differ significantly from all
other types of farms, followed by olive tree farms, livestock farms, and, finally, arable crop farms. It is
also worth noting that permanent crop farms outperform the other crops in all economic sub-criteria,
which explains their high-performance range over other farming systems (see also Figure 6, Tables 6
and A2 in the Appendix A). Specifically, permanent crops score a lower dependency on subsidies,
which indicates that family farm income depends on market income and not on external sources like
subsidies. The productivity scores were higher compared to all other analyzed sectors, meaning that
permanent crops have a high value of output and lower costs. Moreover, farm family income had
the highest score, reflecting a primary indicator of farm economic viability in combination with the
revenues to cover all cash expenses, and the depreciation contributes to the support of farm household
standard of living. Finally, the farm net value added, which represents the remuneration of the fixed
factors of production, scored higher than all other sectors.Arable crop
345% 78% 54% 17,850
farms
Olive tree
32% 202% 158% 16,875
farms
Permanent
25% 258% 202% 26,457
crop farms
Sustainability 2020, 12, 2929 13 of 22
Livestock
112% 152% 140% 25,567
farms
100% 60%
90%
50%
Priorities of alternatives (farm types)
80%
70%
40%
priorities of
sub-criteria
60%
Local
50% 30%
40%
20%
30% Local priorities
of sub-criteria
20% arable crop
10% farms
10% olive tree farms
0% 0% permanent crop
Total subsidies/FFI Total output/Total (FFI/FWU)/Reference FNVA Overall
input income farms
livestock farms
Figure 6.6.Performance
Figure of farms
Performance of farmsper
pereconomic
economic sub-criterion
sub-criterion and and overall.
overall.
Table
3.4. Overall Sustainability 6. Economic
Performance andsub-criteria (mean values per farm type).
Sensitivity Analysis
Aggregating the results of the previous sections, we may(Family observe that livestock farms
Farm
Total
outperform all other farms in two criteria; namely, Total Output/ Income/Family
the environmental Farm
and social criteria Net
(see Value
also
Subsidies/Farm
Figure 7 and Table A2 inFamily the appendix). Total Input Work Unit)/ Added (€)
Income On the other hand, arable crop farms occupy the last position
Reference income
in the environmental and economic criteria. It is also worth noting the clear superiority of the
permanent
Arable cropcrop farms in the345%
farms economic criterion, a78% situation which is not54% observed in the other two
17,850
Olive tree
criteria. farms
In the 32% the overall sustainability
process of evaluating 202% 158%
performance of each alternative 16,875
(farm
Permanent crop farms
type), in addition to the basic25% distribution of equal 258% 202%
weights (0.33/0.33/0.33) among criteria, we 26,457
have
Livestock
studied threefarms
alternative policy112% scenarios from the 152% 140% For each preference
policy maker's perspective. 25,567
scenario, the weight distribution among criteria was adjusted accordingly (0.50/0.25/0.25). As can be
3.4. seen,
Overallpermanent crop farms
Sustainability rank firstand
Performance in the baseline scenario
Sensitivity Analysisof equal weights, followed by livestock
farms with a slight difference (see also Figure 8 and Table A2 in the appendix). Olive tree farms are
inAggregating the aresults
third place with distinctofdifference,
the previouswhilesections, we farms
arable crop may observe
rank last that
withlivestock farms When
a big difference. outperform
all other
it comesfarms inenvironment,
to the two criteria;permanent
namely, the cropenvironmental andare
farms and livestock social criteria
virtually (see also
the same, Figure
followed by 7 and
Tableolive
A2tree farms,
in the with a decreased
Appendix A). On difference
the other compared to thecrop
hand, arable baseline
farmsscenario,
occupy while,
the for
lastarable crop in the
position
farms, the distance
environmental becomes wider.
and economic criteria.In It
the iscase
alsoofworth
socialnoting
preference
the scenario, permanentofcrop
clear superiority the farms
permanent
crop farms in the economic criterion, a situation which is not observed in the other two criteria.
In the process of evaluating the overall sustainability performance of each alternative (farm type),
in addition to the basic distribution of equal weights (0.33/0.33/0.33) among criteria, we have studied
three alternative policy scenarios from the policy maker’s perspective. For each preference scenario,
the weight distribution among criteria was adjusted accordingly (0.50/0.25/0.25). As can be seen,
permanent crop farms rank first in the baseline scenario of equal weights, followed by livestock farms
with a slight difference (see also Figure 8 and Table A2 in the Appendix A). Olive tree farms are in
third place with a distinct difference, while arable crop farms rank last with a big difference. When it
comes to the environment, permanent crop farms and livestock are virtually the same, followed by
olive tree farms, with a decreased difference compared to the baseline scenario, while, for arable crop
farms, the distance becomes wider. In the case of social preference scenario, permanent crop farms and
livestock are virtually the same, followed by olive tree farms with an increased difference compared to
baseline scenario, while arable crop farms rank last but decrease the gap significantly. Finally, in the
case of the economic preference scenario, the sustainability performance of permanent crop farms
improves significantly; as a result, they rank first with a significant difference over livestock farms,
which reveal a lower performance than other scenarios. Olive tree farms are in third place, with ait comes to the environment, permanent crop farms and livestock are virtually the same, followed by
olive tree farms, with a decreased difference compared to the baseline scenario, while, for arable crop
farms, the 2020,
Sustainability distance becomes
12, x FOR wider. In the case of social preference scenario, permanent crop15
PEER REVIEW farms
of 23
and livestock are virtually the same, followed by olive tree farms with an increased difference
compared
and to baseline
livestock scenario,
are virtually the while
same,arable cropby
followed farms rank
olive treelast but decrease
farms with an the gap significantly.
increased difference
Sustainability
Finally,2020,
in to12, 2929
the case of the economic preference scenario, 14 of 22
compared baseline scenario, while arable crop farms the sustainability
rank performance
last but decrease the gap of permanent
significantly.
crop farms
Finally, in theimproves
case of thesignificantly; as a result,
economic preference they rank
scenario, first with a significant
the sustainability performance difference over
of permanent
livestock
crop farmsfarms, whichsignificantly;
improves reveal a lowerasperformance thanrank
a result, they other scenarios.
first with a Olive tree farms
significant are in third
difference over
distinct difference,
place, with
revealing
a distinct
lower
difference,
sustainability
revealing
performance
lower sustainability
compared
performance
to the baseline
compared to the
scenario,
livestock farms, which reveal a lower performance than other scenarios. Olive tree farms are baseline
in third
whileplace,
arable
scenario, crop
withwhile farms rank last.
arabledifference,
a distinct crop farms rank last.
revealing lower sustainability performance compared to the baseline
scenario, while arable crop farms rank last.
60%
60%
50%
50%
40%
40%
Performance
Performance
30%
30%
20%
20%
10%
10%
0%
0%
Environmental
Environmental Social
Social Economic
Economic
arable crop
arable crop farms
farms olive tree
olive tree farms
farms permanent crop
permanent crop farms
farms livestock farms
livestock farms
Figure
Figure
Figure 7.Performance
7.7. Performance of
Performance of farms
of farms per
farmsper criterion.
percriterion.
criterion.
Figure
Figure 8. Overall
8. Overall sustainability performance
sustainability performance per
perpolicymaker
policymakerscenario.
scenario.
4. Discussion
4. Discussion
This This
studystudy contributes
contributes to to fillinga agap
filling gapin inthe
the integrated
integrated assessment
assessment of of
farm-level sustainability
farm-level sustainability
for some critical Greek farming systems. It is worth mentioning that two
for some critical Greek farming systems. It is worth mentioning that two of the examined of the examined systems
systems
concern permanent crops, for which only a few sustainability assessment
concern permanent crops, for which only a few sustainability assessment methods have beenmethods have been applied
applied
so far [57]. A series of methodological and empirical issues emerge from the preceding analysis.
so far [57]. A series of methodological and empirical issues emerge from the preceding analysis.
Sustainability assessment is not an easy task, especially when it is conducted across all pillars
and through composite indicators. Composite indicators are easy to interpret, while they convey
and summarize valuable information in complex, multi-dimensional issues. On the other hand,
their interpretation could be ambiguous, because they can send misleading policy messages [58].
Two further problems are the subjectivity of the process of assigning weights to individual indicators,
which, along with their aggregation, is the essential stage in the process of constructing compositeSustainability 2020, 12, 2929 15 of 22
indicators [59]. This ambiguity is mitigated by the fact that the opinions of experts reflect, at least to
some degree, the “preferences” of the society on the debated and multi-faceted issue of sustainability.
Therefore, future research could broaden the pool of experts (whose opinions are used to assign weights
to separate indicators) with other stakeholders from the agri-food system, such as policymakers,
farmers, cooperative members, etc. Additionally, future research should include small farms, which
make up the backbone of Greek agriculture.
Taking into account the appeal for broadening the datasets of the established monitoring tools [20],
we have shown that the enrichment of FADN data with a series of farm-level information from the
FLINT project, concerning environmental and social aspects of farm functioning, provides a meaningful
set of indicators that enable a thorough sustainability assessment.
Assessing sustainability at the farm level is a powerful tool that can be used for a variety of
purposes, such as the improvement in the governance of the agricultural sector [59] and the facilitation
of the marketing of food products [60]. It can also support farmers to carry out detailed diagnoses
to find the strengths and weaknesses of farms, thus contributing to the construction of a viable farm
development plan. Also, the findings of this study can prove useful in identifying the actions needed
to ensure the long-term sustainability of the examined systems, as well as in the formation of strategies
for sustainable development in both sectoral and spatial terms.
A significant finding of this research is that although arable crop farms have received relatively more
financial support over time, mainly in the form of direct payments, they have not been able to reduce
the gap in the criterion of economic performance significantly. Similarly, while the agri-environmental
measures in Greece were applied primarily to arable crops, our analysis shows that arable crop farms
lag behind other sectors in terms of environmental performance criteria.
Moreover, Prosperi et al. [61] claimed that the high sustainability performance of agri-food systems
implies an enhanced ability to withstand shocks and stressors of various kinds, i.e., it renders these
systems less vulnerable. Consequently, the findings of this study assume significant importance in
view of all challenges faced by Greek (and more generally the Mediterranean) agriculture, especially
climate change, economic crises, and other stressors. Furthermore, the sustainability performance
variation of the farming systems under consideration can be investigated in the light of future changes,
such as climate change. In particular, foresight scenarios can be used for crop yields and prices based
on the Fifth Intergovernmental Panel on Climate Change (IPCC) report, which takes into account the
possible global climate and socio-economic changes. We should not forget that the dual entity farm
firm/farm household is a system that is part of a broader hierarchy of agriculture-related systems.
Therefore, a systemic approach is needed, whereby sustainability is seen as an emergent property,
related to particular levels within the hierarchy. As Webster [62] rightly points out, “its operational
definition at the farm level thus may not apply at other levels in the hierarchy.”
The proposed methodology has enabled us to identify both intra- and inter-agricultural system
heterogeneity with regard to the sustainability performance of different farms across the sub-criteria
in each of the three dimensions (pillars). In the social dimension, this variation is more pronounced.
Nevertheless, the picture is much clearer when the overall sustainability assessment is conducted.
Interestingly, it seems that three “typical” Mediterranean farming systems, as practiced by professional
farms in Greece (permanent crops, olive trees, and sheep), are more sustainable than arable crops. In the
case of professional sheep farms, the high sustainability performance confirms previous findings in the
literature [63,64]. This study could support the role of specific agricultural sectors and consequently
farmers through compensating them according to their significant contribution to more sustainable
farming practices. Given the multi-dimensional nature of any sustainability assessment, some room
should be given for flexibility in the use of sustainability performance indicators.
As we have seen, the relative ranking of the examined farming systems seems to be consistent
across four different policy priorities. This finding implies that even under diverse prioritization
concerning the three pillars of sustainability, permanent crops, olive trees, and sheep will be expectedYou can also read