Agricultural Economy in the Fraser Valley Regional District - Regional Snapshot Series: Agriculture
←
→
Page content transcription
If your browser does not render page correctly, please read the page content below
Image courtesy Chilliwack Economic Partners Corp

                                        Photo: Cheryl Uphill

Regional Snapshot Series: Agriculture
Agricultural Economy in the
Fraser Valley Regional District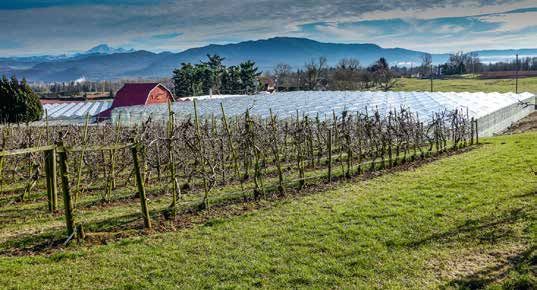
TABLE OF CONTENTS
  A Region Defined by Agriculture

  Competitive Advantage

  Economics of Agriculture: A National Perspective

  Economics of Agriculture: Provincial Context

  Economics of Agriculture: Regional Context

  Agricultural Land Reserve

  Agricultural Diversity

  Agriculture Challenges

  Agriculture Opportunities

  Regional Food Security
The Fraser Valley Regional District is comprised of 6 member
municipalities and 8 electoral areas.

City of Abbotsford, City of Chilliwack, District of Mission, District of Hope, District of Kent,
Village of Harrison Hot Springs and Electoral Areas A, B, C, D, E, F, G and H.

                              Fraser Valley Regional District

                                                                                                   A NOTE ON CENSUS DATA LIMITATIONS

                                                                                                   Although every effort has been made in the
                                                                                                   preparation of the Regional Snapshot Series
                                                                                                   to present the most up-to-date information,
                                                                                                   the most recent available Census data is
                                                                                                   from 2016.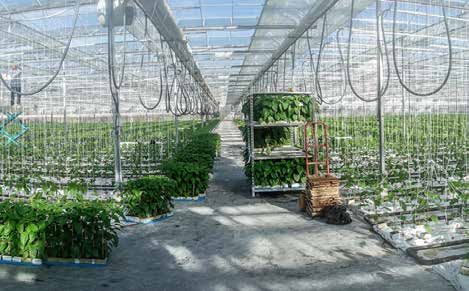
A REGION DEFINED BY
                                          AGRICULTURE
CHOICES FOR                               TODAY AND INTO THE FUTURE
OUR FUTURE:                               Agriculture: A 21st century industry

our Regional                              The Fraser Valley Regional District (FVRD) is comprised of six member municipalities
                                          and eight electoral areas and features a variety of diverse communities, from small

Growth Strategy                           rural hamlets to the fifth largest city in British Columbia. The FVRD is one of the most
                                          intensively farmed areas in Canada, generating the largest annual farm receipts of any
                                          regional district in British Columbia. Notwithstanding the rapid population growth of
                                          the region, agriculture has flourished and remains a crucial component of the region’s
                                          economy.
Though occupying a relatively
small geographic area, agriculture        Proximity to large markets in combination with high quality soils, favourable climate and
forms a significant component of          accessible water as well as the diversity of the sector and proximity to educational and
the Region’s economy, producing           research institutions makes the Fraser Valley Regional District a centre for agricultural
39% of provincial gross farm              production and innovation today and into the future.
receipts in 2015.
                                          Although the region is home to a diverse range of large and small farms, agriculture
Given the importance of                   in the Region is big business conducted in a highly sophisticated manner requiring
agriculture, Choices for Our              substantial capital investment. Agriculture’s influence goes far beyond the farm gate.
Future, the FVRD’s Regional               As a primary industry, the production of food and other agricultural products not only
Growth Strategy adopted in 2004,          provides inputs to other sectors of the economy, but is also a significant consumer of
                                          goods and services. A strong agricultural economy is essential for the regional and
recognizes that population growth
                                          lower mainland economy as a whole and efforts to protect and enhance this sector
has exerted considerable pressures        should remain a key focus of regional policy going forward.
on agricultural lands and that
future growth must not negatively
impact the agriculture sector.
                                           Fraser Valley Regional District and surrounding area

                                                                                   Lillooet                                        Kamloops

“...Foster economic
                                                                                         Boston Bar
growth in the
                                            Squamish
agricultural sector...”                                                                                         Yale

- Choices for our Future
                                                                                                                  Hope
                                                                                 Harrison
                                                                                Hot Springs
                                                                                                   Kent

                                     Metro Vancouver                                    Chilliwack
                                                                  Mission

                                                                   Abbotsford
                                                Canada
                                                                                  Image: ESRI, i-cubed, USDA FSA, USGS, AEX, GeoEye, AeroGRID, Getmapping, IGP; FVRD
                                              United States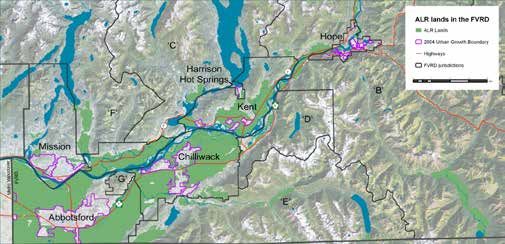
COMPETITIVE ADVANTAGE
A COMBINATION OF FACTORS
High quality soils, a moderate climate, water and access to
markets
Soils in the Fraser Valley are some of the richest in the country supporting a broad
range of vegetables, field and cereal crops, small fruits, nursery products, sod, pasture
and other crops.

Climate in the primary agricultural areas of the FVRD is characterized by mild winters,
warm summers and a narrow range of temperatures that only occasionally drop below
zero. As a result, the region has one of the longest frost-free periods in Canada,
making it one of the best agricultural areas in the country.

Summers are generally mild, although the marine influence which moderates summer
temperatures along the coast does not extend far inland. The average July maximum
temperature of 24.4o C in the Chilliwack and Abbotsford area is higher than that at
Vancouver International Airport, which has a July average maximum temperature of
22oC, although the differences on a daily basis can be significantly greater.

The region experiences approximately 1,700 mm of precipitation a year, with
approximately 1,400 mm falling between October and April. Although heavy winter
rains can create challenges, they recharge the region’s aquifers that are tapped for
irrigation purposes during the dry summer months.

Proximity to markets
                                                                                             What is Agricultural Land?
The combination of good soils, moderate climate and access to water within close
proximity to a local market of over 2.5 million people today and one that will become
a market of almost 3.6 million by 2041, provides both challenges and opportunities           Although 5% of the province’s land base is
for agriculture in the region.                                                               considered capable for agriculture, not all
                                                                                             land is created equally and there is signifi-
Increasingly, Lower Mainland consumers are becoming aware of the bounty at their             cant variability in terms of the ability of land
doorstep and are making choices at local supermarkets with respect to where their            to support the production of diverse agricul-
food comes from. Close proximity to markets can reduce shipping costs for the                tural products.
agricultural sector, therefore encouraging a healthy local food processing industry so
that it can continue to process foods produced in this region in the future should be        According to the Provincial Agricultural Land
a priority for local, regional and provincial decision makers.                               Commission, “...the main limiting factors in
                                                                                             British Columbia are climate and topog-
The Fraser Valley’s close proximity to the Metro Vancouver market and highly developed       raphy. Climate determines the heat energy
air, rail and port facilities provides opportunities for the region’s agriculture industry   and moisture inputs required for agricultural
to further develop potential export markets. Data on markets for FVRD farm goods             production. Topographic limitations mostly
is not readily available. However, provincially, agriculture/aquaculture exports have        restrict the ability to use cultivation equip-
remained relatively constant over the years, making up 10.6% of BC’s total exports           ment. Soils with all their variability are also
in 2015. With trade barriers lowering, Fraser Valley products are finding their way to       a key limiting factor. Depending upon their
other parts of Canada, the United States, Asia, Europe and other parts of the world.         properties and characteristics they may be
                                                                                             appropriate for sustaining the production of
British Columbians still must rely on food imports. Some commodities are produced            certain agricultural products, but not others.”
in BC for export and are replaced by cheaper foreign imports. For example B.C.               www.alc.gov.bc.ca/ALR/What_is_Ag_Land.htm
produces high quality greenhouse tomatoes that are sold to the U.S. while at the
same time it imports less expensive field tomatoes from California (BC Ministry of           Although agriculture takes place in other
Agriculture and Lands, BC’s Food Self Reliance, 2006). The BC’s Food Self Reliance report    parts of the province, the environment, soils
states that BC Farmers produce 48% of all foods consumed in BC meaning that, given           and topography in the Fraser Valley enable
the seasonality of food production and climate limitations, food imports will remain         the production of a wide variety of agricul-
a necessity. However, food imports can be subject to external influences such as             tural goods that cannot occur anywhere else
political unrest, increasing energy costs, flooding/drought, disease, trade disputes         in the province. This makes the quality of
and other issues that can disrupt access to food. For this reason it is important for        land in the FVRD important in both a prov-
the lower mainland to maintain a level of food self reliance to act as a buffer against      incial and national context
unanticipated disruptions.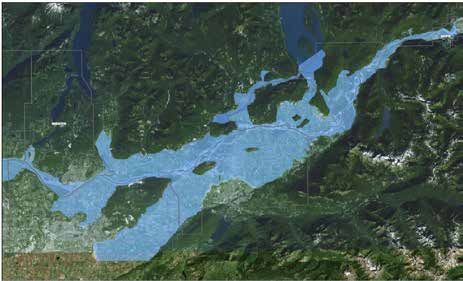
ECONOMICS OF AGRICULTURE
                                            A NATIONAL PERSPECTIVE
                                            Agriculture plays an important economic function
                                            nationally and provincially.

                                            Agriculture and the agri-food sectors contribute significantly to Gross Domestic
                                            Product (GDP) and employment at both national and provincial levels. Although
                                            primary agriculture alone accounts for a small share of the total economy, the agri-
                                            food system, that depends on primary agriculture for inputs, is far more influential.
                                            Indeed, according to the Government of Canada, the food and beverage processing
                                            industry was the most important manufacturing sector in Canada in 2014, accounting
                                            for 16.0% of the total manufacturing sector GDP. (Agriculture and Agri-food Canada, An
                                            Overview of the Canadian Agriculture and Agri-Food System, April 2016 pg. xiii)

                                            The food and beverage processing industry, which consumes almost half of Canada’s
                                            agricultural output, is one of the most important manufacturing sectors in Canada.
                                            During 2008-09, the food and beverage processing industry became Canada’s largest
                                            manufacturing activity, which has held true over the past six years. The value of food
                                            and beverage shipments has increased to $103.4 billion in 2014 (from $78 billion in
                                            2009). Meat and dairy processing together account for 42% of the real value of food
                                            and beverage shipments, which has remained steady (approximately $43.5 billion).
Canadian Agri-Food System:                  (pg. 69)

The Canadian agriculture and agri-food
                                            There is a tendency to view farming as merely the growing of food and pastoral
system accounted for 6.6% of total
                                            landscapes. The reality is that growing food or other agricultural products is only
Canadian Gross Domestic Product (GDP)
                                            one part of a much larger supply chain in which the farmer is both a consumer and
in 2015. (p. 7)
                                            producer of goods and services. According to Agriculture and Agri-Food Canada,
                                            nation-wide, producers spent a record $50.2 billion in operating expenses which
The Canadian agriculture and agri-food
                                            flowed back into the broader economy. In 2014, it was estimated that the agriculture
system provided one in eight jobs in
                                            and agri-food system accounted for over 13% of BC’s employment. (pg. 29)
2015, employing over 2.3 million people.
(p. 28)
                                            Provincial context
The U.S. is Canada’s largest export
market, accounting for 51.4% of the value   British Columbia does not have the extent of agricultural lands found in other parts
of all exports. Three main commodity        of Canada, with only 5% of BC’s total land area, or 4.4 million hectares, capable for
groups accounted for over two-thirds of     agriculture. Nevertheless, British Columbia’s agriculture/aquaculture food system
all exports: Grains and Grain Products      collectively generated $12.3 billion in consumer sales and 320,000 jobs in 2014.
(25.8%), Oilseeds & Oilseed Products
(23.2%), and Live Animals, Red Meat, &                       Estimated Economic Impact of the BC Agri-food System
Other Animal Products (19.3%). (p. 7)

Record high cattle and hog prices, as                                                      Farm and Food                                             BC CONSUMERS
well as relatively high grain and oilseed                                                  Imports (2005):
                                                                                             $3.3 billion
prices, have supported high farm market
receipts in recent years.
                                                           Agriculture
                                                       Sales (2005): $ 2.4 b
According to a 2010 study commissioned                 Jobs (2005): 36,300
                                                                                                                                                         Food Retail &
by Agriculture and Agri-food Canada,                                                      Food Processing
                                                                                         Sales (2005): $6.7 b
                                                                                                                        Food Wholesaling
                                                                                                                        Sales (2004): $49.9 b
                                                                                                                                                         Food Service
                                                                                                                                                            Industry
the main reason given for looking to                                                     Jobs (2005): 31,500            Jobs (2005): 13,500           Sales (2004): $16.1 b
                                                                                                                                                      Jobs (2005): 196,730
purchase locally-produced food was to
support the local economy. (p. 62)
                                                           Aquaculture
                                                       Sales (2005): $0.23 b
(Agriculture and Agri-food Canada, An                   Jobs (2005): 24,000

Overview of the Canadian Agriculture and                                                   Farm and Food
                                                                                                                                                           OTHER
                                                                                           Exports (2005):
Agri-Food System, April 2016)                                                                $2.4 billion                                                CONSUMERS

                                                           Commercial
                                                            Fisheries

                                                                               Source: BC Ministry of Agriculture Fast Stats, Agriculture, Aquaculture & Food, 2006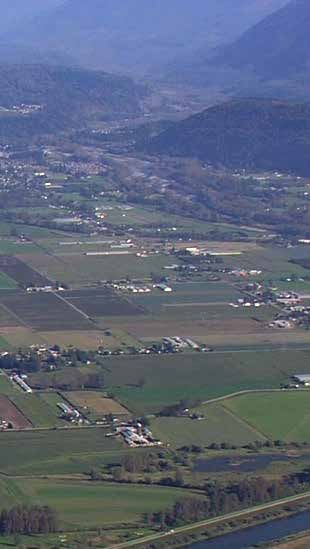
ECONOMICS OF AGRICULTURE BC in National Rankings
by Commodity
FVRD IN A PROVINCIAL CONTEXT Blueberries 1
Cranberries 1
Fraser Valley ranks #1 in BC based on gross farm receipts Raspberries 1
Appricots 1
British Columbia ranks number three or higher in Canada in relation to a wide range of Sweet Cherries 1
products, many of which are produced in the Lower Mainland. Collectively, the FVRD Grapes 2
and Metro Vancouver generate 65% of provincial gross farm receipts for a total of $2.4
Floriculture 2
billion. In 2015, the FVRD generated 39% of total provincial gross farm receipts and
was responsible for 44% of the total provincial increase from 2010 to 2015. Nursery Products 2
Gross farm receipts reflect only one aspect of the economic impact of agriculture in Tomatoes, greenhouse 2
the FVRD. Farm operators are significant consumers of goods and services, which are Sweet Peppers, greenhouse 2
embodied in agriculture’s operating expenses. In 2015, total farm operating expenses Mushrooms 2
totalled $1.2 billion, much of which flowed back into the local economy. Apples 3
Cucumbers, greenhouse 2
The broader agricultural economy, which includes food processors, transporters, Dairy Products 3
wholesalers, retailers and other food services industries adds yet another level of Hens and Chickens 3
economic activity.
Eggs 3
Provincial Gross Farm Receipts (2015)
Turkeys 3
Source: Statistics Canada, 2016 Census of Agriculture
Canola 4
$1,600,000,000
$1,468,505,390 Cattle 6
$1,400,000,000 $1,306,282,715
Hogs 6
Potatoes 7
$1,200,000,000
$954,575,981 Source: Statistics Canada, Census of Agriculture and
$1,000,000,000
BC Ministry of Agriculture Fast Stats, Agriculture,
Aquaculture & Food, 2014
$800,000,000
$600,000,000
$400,000,000
$200,000,000
BC Dairy, Egg, and Poultry
Industries
$-
Fraser Valley Metro Vancouver Rest of BC
BC Dairy, Egg, and Poultry Industries
FVRD Farm Business Operating Expenses (2010 and 2015) (BCDEPI) represents the supply managed
commodities that play an important role in
Dollar Amount both the FVRD’s and province’s economy.
Total farm business operating expenses (2015) $1,222,076,351
A 2011 PwC* analysis of the provincial
Total farm business operating expenses (2010) $950,128,254 economic impact of the BCDEPI value chain
Breakdown of Selected Components (2010)* Percentage found that it “...impacts the BC economy
through direct expenditures on goods and
Total feed, supplement and hay purchases 23.4%
services, the employment of workers and
Total wages and salaries 18.2% the generation of tax revenues for local,
Livestock and poultry purchases 13.4% provincial and federal governments.” (pg. 1)
Custom work, contract work and hired trucking 3.8%
“...Total value added generated by the
All fuel expenses (diesel, gasoline, natural gas etc.) 3.7% BCDEPI value chain in British Columbia is
Seed and plant purchases (excluding material purchased for resale) 3.4% estimated to be $1.6 billion. It is estimated
that the BCDEPI value chain generates
Fertilizer and lime purchases 3.2%
employment of 31,726 FTEs with associated
Repairs and maintenance to farm machinery, equipment and vehicles 2.7% salaries and wages of $917.8 million, a 3%
Electricity, telephone and all other telecommunications services 2.2% reduction from 2009.” (pg. 1)
Repairs and maintenance to farm buildings and fences 1.7%
“...Employment in the BCDEPI value chain
Rental and leasing of land and buildings 1.5% was slightly larger than the mining, quarry-
Veterinary services, drugs, semen, breeding fees, etc. 1.5% ing, and oil and gas extraction industry at
24,700 employed.” (pg. 1)
Purchases of herbicides, insecticides, fungicides, etc. 0.9%
Rental and leasing of farm machinery, equipment and vehicles 0.3% * PwC - PricewaterhouseCoopers
* Detail has been terminated in the 2016 Census of Agriculture. 2010 detail data is included to give context. Source: BC Dairy, Egg, and Poultry Industries (BCDEPI) , Economic
impact of British Columbia’s dairy, chicken, turkey, hatching egg
Source: Statistics Canada, 2011 Census of Agriculture & 2016 Census of Agriculture and table egg industries – 2011 update, PwC 2013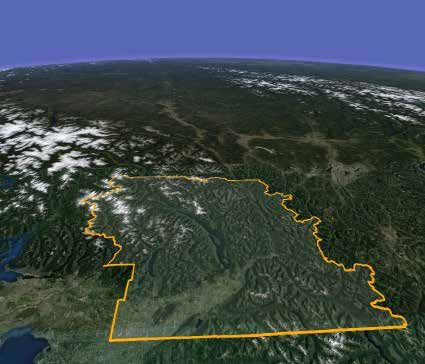
ECONOMICS OF AGRICULTURE
REGIONAL CONTEXT
BC Ministry of Agriculture
Agriculture is the foundation of the Region’s economy
The importance of the broader agri-industrial and agri-food system to the Region
as a whole can be difficult to determine, given that agricultural enterprises in the
region do business throughout the Lower Mainland and beyond. For example, food
processing plants in Abbotsford may process products grown in Delta or the Township
of Langley. This interdependence points to the importance of protecting the viability
of agriculture throughout the Lower Mainland, not just in the FVRD.
In 2015, the FVRD commissioned a study assessing the potential impacts of freshet
flooding on Fraser Valley agriculture, as well as options for resilience. Using 2011
census data, this study generated an estimate for the economic impact of agriculture
BC Ministry of Agriculture
in the FVRD, the results of which are presented below. As shown, agriculture drives
$3.1 billion in annual economic activity and supports 18,000 Full Time Employment
(FTE) jobs. Farm based production within the FVRD accounted for 11,700 FTE job and
$1.4 billion in expenditures. The value added sector provided and additional 3,300 FTE
jobs and $1.69 billion in expenditures. Farms outside the FVRD support 18% of the
agri-industrial and value-added sector. Within the FVRD, Abbotsford is a key node for
Food Processing food processing and other agriculture activities. Based on previous studies, it can be
estimated that around 70% of the region’s agri-industrial and value-added economic
An estimated 55% of all food processing activity comes out of Abbotsford, roughly $2.2 billion.
firms in British Columbia are located in the
Lower Mainland. According to the 2011
British Columbia Manufacturers’ directory, Estimated Economic Impact of Agriculture in the FVRD
there are more than 50 food and beverage
businesses in the FVRD, with the largest Farm Gate Sales Agri Business and Value Added*
employing over 200 workers. Major food $1,112 m $844 m
related manufacturers in the region include:
Lucerne Foods Ltd, Canadian Inovatec,
Abbotsford Growers Co-operative, Fraser Gross Income + Depreciation (Dpn)
$335 m
Operating Expenses
$777 m
Valley Duck and Goose, Johnston Packers Non Ag-specific Ag-specific Value Added from From Farms Outside
Farm income + Dpn Paid Wages
and Fraser Valley Meats. $162 m $173 m
purchases purchases FVRD Farms FVRD
$359 m $ mm
$415 $272 m $157 m
Small-scale food processing facilities also 1,168 FTE Jobs 6,102 FTE Jobs Payroll $178 m Operating Expenses $666 m
have a role to play. The development of 3,325 FTE Jobs
smaller food processing facilities in recent
years reflects a trend of farm enterprises
incorporating small food processing facilities Plus secondary impacts from wages Plus secondary impacts from
wages and revenues spent locally
and retail outlets into their business. This and revenues spent locally
trend is taking advantage of increasing $697 m in expenditures ($1,112-$415)
and 4,444 FTE Jobs
$844 m in expenditures and
3,325 FTE Jobs
consumer interest in organic produce and
demands for locally produced foods.
External competition, achieving economies
of scale, labour costs and supply and 18, 362 FTE Jobs $3.1 Billion in Expenditures
ensuring a long-term supply of agricultural
inputs are on-going challenges facing the Source: NHC, 2016. Data from Stats Can 2011 Census of Agriculture
food processing industry.
The other benefit of agriculture to the Region’s economy is its relative stability. Over
the economic ups and downs, agriculture has held its own. As discussed earlier in
a national context, the agriculture sector in the FVRD has stayed relatively stable at
a time when more economically sensitive sectors, such as construction and related
manufacturing sectors, have faltered.
This is not to say that the agriculture sector is not facing significant economic
challenges. As discussed elsewhere, the industry is facing challenges that need to be
addressed in such a way that preserves and strengthens the viability of agriculture in
BC Ministry of Agriculture
the FVRD and the Lower Mainland as a whole.
“The mission of the
                                                                                                       Agricultural Land
      AGRICULTURAL LAND RESERVE                                                                        Commission is to preserve
                                                                                                       agricultural land and
      PRESERVING AND PROTECTING A                                                                      encourage and enable farm
                                                                                                       businesses throughout
      VALUABLE RESOURCE                                                                                British Columbia .”
                                                                                                       Agricultural Land Commission

       The ALR has been a critical growth management tool in the
       Lower Mainland
                                                                                                    Land in the ALR as % of Total Area
       Protecting agricultural land, and the productivity that such lands represent, is essential
                                                                                                                                         ALR     % Total
       for not only maintaining, but growing the region’s agricultural economy. The Region
       recognizes that 21st century agriculture carries exciting opportunities in terms of                                               Ha       Area
       technology and innovation and that we are well positioned to capitalize on what is            Abbotsford                         27,459    70.6
       the competitive advantage of a strong and diverse agricultural economy.                       Chilliwack                         16,950    58.1
       The Agricultural Land Reserve (ALR) was established between 1974 and 1976 with                Mission                            1,530      5.8
       the purpose of protecting British Columbia’s agricultural land base. Although the             Hope                               357        7.6
       ALR makes up only 5.1% of the Region’s 14,000 sq kilometres, this small land base             Kent                               6,579     29.4
       supports one of the most diverse and productive agricultural areas in Canada.
                                                                                                     Harrison Hot Springs               134       18.7
       The ALR is administered by the Agricultural Land Commission, an administrative                Electoral Area A                   693        0.3
       tribunal at arm’s-length from the provincial government. The purposes of the
                                                                                                     Electoral Area B                   5,747      1.8
       Commission are:
                                                                                                     Electoral Area C                   1,171      0.3
       •    To preserve agricultural land;
       •    To encourage farming on agricultural land in collaboration with other communities        Electoral Area D                   823        3.5
            of interest; and                                                                         Electoral Area E                   1,225      1.9
       •    To encourage local governments, First Nations, the government and its agents to          Electoral Area F                   2,236      1.1
            enable and accommodate farm use of agricultural land and uses compatible with
                                                                                                     Electoral Area G                   5,172     44.9
            agriculture in their plans, bylaws and policies.
                                                                                                     Electoral Area H                   1,403     12.2
       The ALR has played an important growth management role in the Lower Mainland.                Source: BC Agricultural Land Commission
       There is little debate that without the ALR, the development trends that were in
       place in the early 1970’s would have continued and that the region today would be              Farm Practices Protection
       characterized by urban sprawl. Instead, the FVRD is characterized by increasingly              (Right to Farm) Act
       dense urban cores surrounded by active, highly productive and economically
       important agricultural lands.                                                                  In addition to the Agricultural Land
                                                                                                      Reserve, agricultural activities are
       Section 46 of the Agricultural Land Commission Act (ALC Act) requires that every               protected under the Farm Practices
       Official Community Plan or Regional Growth Strategy must be consistent with the                Protection (Right to Farm) Act. Farmers
       ALC Act, the regulations and the orders of the Commission; otherwise an inconsistent           have a right to farm in farming areas
       provision is of no force or effect. The ALC played an important role in the development        provided they use normal farm practices
       of the FVRD’s Choices for Our Future RGS and the establishment of the Region’s Urban           and follow other legislation listed in the
       Growth Boundaries.                                                                             Act. The Right to Farm suite of legislation
                                                                                                      provides a mechanism for the province
                         Primary Agricultural Land Reserve Areas in the FVRD                          to limit local government restrictions on
                                                                                                      agricultural activities.

                                                                                                      A “normal farm practice” is defined
                                                                                                      as an activity “that is conducted by a
                                                                                                      farm business in a manner consistent
                                                                                                      with proper and accepted customs and
                                                                                                      standards as established and followed
                                                                                                      by similar farm businesses under similar
                                                                                                      circumstances.”

                                                                                                      Where conflicts arise, the Farm Industry
                                                                                                      Review Board can review complaints
                                                                                                      about farm practices and have the ability
                                                                                                      to order a farmer to improve or to stop
                                                                                                      poor farm practices. The board employs
                                                                                                      a peer review process to investigate
                                                                                                      complaints and attempts to resolve
Source: BC Agricultural Land Commission
                                                                                                      disputes before hearings are held.
AGRICULTURAL DIVERSITY
BROAD RANGE OF INDUSTRY
BC Ministry of Agriculture
GROUPS REPRESENTED IN THE FVRD
Census of Agriculture A diverse agriculture sector provides a stable economic
Statistical Area Definitions base for the region
Census The Fraser Valley’s agricultural sector is one of the most diverse and resilient in Canada,
Consolidated with a broad range of commodity groups represented. The benefit of such diversity
Subdivision (CCS) Jurisdiction lies in the ability of farmers to quickly respond to market shifts or unexpected events
that cause disruptions, such as the 2004 outbreak of Avian Influenza that impacted the
Abbotsford Abbotsford
poultry sector.
Fraser Valley B Electoral Area A
Electoral Area B The diversity of agriculture in the FVRD is reflected in the range of industry groups (by
Electoral Area C NAICS classification) represented by farms in the FVRD. Most striking is the fact that,
in 2016, 53% of all dairy operations in British Columbia are based in this Region.
Hope
Fraser Valley D Kent
Harrison Hot Springs FVRD Farms Classified by Industry Group
Electoral Area D % of Classified Provincial Farms (NAICS classification*)
Source: Statistics Canada, 2016 Census of Agriculture
Fraser Valley E Chilliwack
Other Crops 6%
Electoral Area E
Beef 8%
Electoral Area H Other Animals 8%
Fraser Valley F Mission Oilseed & Grain 10%
Electoral Area F Vegetable & Melon 11%
Fraser Valley G Electoral Area G Sheep & Goat 14%
Fruit & Nut 18%
Source: Statistics Canada, 2016 Census of Agriculture
Hog & Pig 22%
2015 Gross Farm Receipts Greenhouse & Nursery 24%
Poultry & Egg Production 37%
Dairy 53%
Census
Total number of farms 15%
Consolidated Gross Farm
0% 10% 20% 30% 40% 50% 60%
Subdivision Receipts
* North American Industry Classification System (NAICS): Standard used by Statistics Canada in classifying business establishments for
FVRD (CD) $ 1,468,505,390 the purpose of collecting, analyzing, and publishing statistical data related to Canada’s business economy.
Abbotsford (CCS) $ 853,070,776
Fraser Valley B (CCS) $ 4,132,981
Fraser Valley D (CCS) $ 71,643,455 The type of agriculture practiced in the region varies between communities. As
Fraser Valley E (CCS) $ 461,756,656 represented by the number of farms, dairy, beef and greenhouse/nursery farms are
Fraser Valley F (CCS) $ 11,419,651 more numerous in the Chilliwack area, whereas poultry and fruit farms are more
Fraser Valley G (CCS) $ 66,481,871 numerous in Abbotsford.
Source: Statistics Canada, 2016 Census of Agriculture
Although data is not available at the Regional District level, the distribution of gross
farm receipts by commodity type
2015 Operating Expenses shows that for the Lower Mainland-
Southwest Census Agricultural Region
Census Operating (FVRD, Metro Vancouver, Sunshine
Consolidated Expenses Coast RD, and Squamish-Lillooet
Subdivision RD), the top three industries are
greenhouse, nursery, and floriculture;
FVRD (CD) $ 1,222,076,351.00 poultry and egg; and dairy cattle and
Abbotsford (CCS) $ 721,263,978.00 milk. Collectively, these three farm
BC Ministry of Agriculture
Fraser Valley B (CCS) $ 3,711,219.00 types account for around 75% of the
Fraser Valley D (CCS) $ 55,880,490.00 gross farm receipts in the region. In
the FVRD, greenhouse, dairy, and
Fraser Valley E (CCS) $ 379,496,384.00
poultry are prominent.
Fraser Valley F (CCS) $ 9,641,055.00
Fraser Valley G (CCS) $ 52,083,225.00
Source: Statistics Canada, 2016 Census of AgricultureFVRD in Provincial Rankings
Agriculture production continues to grow Commodity
% BC Rank
Total in BC
In spite of increased urbanization in the Fraser Valley, agricultural production has Brussels Sprouts (ha) 95.2% 1st
Other Poultry 91.5% 1st
continued to grow in terms of livestock, land under cultivation, and agriculture taking Pigs 84.2% 1st
place in greenhouses. Raspberries 82.2% 1st
Broccoli (ha) 79.3% 1st
Historical Trends 2006 to 2016 Laying Hens 19 wks + 69.5% 1st
Hens & Chickens 69.5% 1st
2006 2011 2016
Sweet Corn (ha) 61.5% 1st
Farmland Use Dairy Cows 59.7% 1st
Turkeys 55.7% 1st
Crops ha 33,394 36,309 37,214 Corn for Silage (ha) 54.6% 1st
Summerfallow ha 94 39 x Cauliflower (ha) 51.4% 1st
Sod (ha) 44.8% 1st
Pasture (managed) ha 2,925 3,440 x
Mushroom Growing Area (sq m) 42.4% 2nd
Pasture (unmanaged) ha 11,233 15,799 13,060 Blueberries (ha) 38.6% 2nd
Other* ha 8,957 8,170 7,993 Other Fruits Berries & Nuts (ha) 38.4% 1st
Green Peas (ha) 37.5% 2nd
Total ha 56,603 63,757 61,236 Nursery Area (ha) 37.3% 1st
Peppers (ha) 35.6% 2nd
Crops Total Area in Vegetables (ha) 33.4% 2nd
Field Crops** ha 24,410 26,348 26,574 Goats 23.2% 2nd
Organic Animals or Animal
Fruits, Berries & Nuts ha 4,219 5,381 5,470 21.4% 2nd
products (Farms)
Vegetables ha 2,311 2,199 1,927 Strawberries 18.7% 2nd
Other ha 2,454 119 3,243 Colonies of Bees 15.0% 3rd
Total ha 33,394 34,047 37,214 Source: BC Ministry of Agriculture, 2011 Census of
Agriculture
Mushrooms (farms) # 17 16 14
(area) m2 120,760 97,163 97,714
Greenhouses (farms) # 161 159 154
(area) m2 1,185,946 1,467,514 1,591,236
Nursery Products ha 1,773 1,703 1,438
Sod Grown for Sale ha 376 407 402 Lower Mainland-Southwest CAR*
Christmas Trees ha 252 203 168 Gross Farm Reciepts by
* ”Other”: includes ‘Unimproved Land’, ‘Other Improved Land’ and ‘Woodland’
** Field crop area does not include those crop areas not included for reasons of confidentiality
Commodity
*** “Other” Crops: also account for area figures not provided due to confidentiality in 2006 and 2011 data
Total Gross %
x data witheld for confidentiality Farm Type
Receipts Total
Source: BC Ministry of Agriculture, 2011 Census of Agriculture All Farms $1,920,747,557
Statistics Canada, 2016 Census of Agrilculture
Greenhouse, nursery, $615,276,903 32.0%
and floriculture
A significant increase, as shown below, is the number of farms reporting the raising Poultry and egg $515,555,689 26.8%
of honey bees. Between 2006 and 2016, the number of farms raising bees increased Dairy cattle and milk $387,563,011 20.2%
118% from 51 farms to 111. The honey bee is a keystone species for agriculture: Fruit and tree nut $172,237,983 9.0%
according to the B.C. Ministry of Agriculture, $200 million in agriculture production Vegetable and melon $100,741,187 5.2%
Other animal $58,610,476 3.1%
is dependent on honey bee pollination every year in the province. Recent trends
Hog and pig $30,868,997 1.6%
indicate that bee populations are struggling, as the data here suggests. It is important Other crop $19,766,012 1.0%
to do what we can to encourage this species to thrive. Beef cattle $16,016,244 0.8%
Historical Trends in Livestock 2006 to 2016 Sheep and goat $2,538,126 0.1%
Oilseed and grain $1,572,929 0.1%
2006 2011 2016
Source: BC Ministry of Agriculture, 2011 Census of
Livestock Farms Livestock Farms Livestock Farms Livestock Agriculture
Hens & Chickens 584 11,396,784 698 11,912,986 780 13,773,480 *Lower Mainland-Southwest Census Agricultural
Region (CAR): FVRD, Metro Vancouver, Sunshine
Turkeys 42 434,543 65 521,889 57 492,140 Coast RD, and Squamish-Lillooet RD
Total Other Poultry 111 371,172 114 428,848 130 x
Cattle & Calves 868 92,722 745 93,369 651 103,034
Dairy Cows 376 44,300 324 44,029 285 46,770
Beef Cows 305 4,297 241 3,038 200 2,826
Pigs 84 96,565 59 75,029 73 69,817
Sheep & Lambs 174 4,002 168 4,734 159 3,864
Horses & Ponies 456 2,634 420 2,493 334 1,589
Goats 121 3,822 121 3.399 140 4,139
Mink 6 104,700 7 35,648 6 x
Bison 2 x 2 x 3 x
Deer 4 x 4 x 4 x
Llamas & Alpacas 64 324 81 373 57 202
Rabbits na na 27 x 47 996
Colonies of Bees - Honey 51 5,459 70 5,047 111 14,110
x data witheld for confidentiality
Source: Statistics Canada, 2016 Census of AgricultureLower Mainland
Population Growth AGRICULTURE CHALLENGES
GROWTH AND OTHER PRESSURES
Source: FVRD, BC Stats
4,000,000
Farming at the edge of one of the fastest growing
3,500,000
metropolitan regions in Canada is a challenge
3,000,000 The FVRD is located on the periphery of one of the fastest growing metropolitan
regions in Canada. The lower mainland is expected to see an additional 1.1 million
2,500,000
people by 2036, the vast majority of which will locate in Metro Vancouver. This type
of growth will pressure lands in both Metro Vancouver and the FVRD in a number of
ways, including increasing land costs, water supply quantity and quality, air quality,
2,000,000
land use conflicts, pressures on the ALR, taxation and others.
1,500,000 The skyrocketing cost of land in the region is causing significant challenges for local
farms. According to Farm Credit Canada, the financial viability of farm businesses
1,000,000
becomes questionable when land prices reach $80,000 per acre. The table to the left,
taken from a 2016 VanCity study (www.vancity.com/AboutVancity/News/MediaReleases/
AgriculturalLandPricesIncrease-Apr6-2016), shows that farm land values in the Fraser Valley
500,000
are approaching this limit, with the viability of small scale farms already compromised.
In the FVRD, nearly 40% of all farms are below 10 acres. A consequence of high land
0 values is an increase in local food prices. In order to keep farming sustainable in
2006 2011 2016 2021 2026 2031 2036 our region and boost local food consumption, more needs to be done to protect
Metro Vancouver Fraser Valley agricultural land from speculative pressures.
A survey undertaken by Metro Vancouver in relation to its Regional Food Systems
Strategy (www.metrovancouver.org/planning/development/AgricultureAndFood) found that
93% of respondents believed that preserving agricultural land is at least “somewhat”
Farmland Price per Acre or “very” important, with 67% stating it was very important. But the survey also found
that 6% of respondents felt that protecting agricultural land was not important, based
Parcel Size Metro Van Fraser Valley
mainly on the belief that there are other areas of the province which can be used
5 acres $150,000-$350,000 $80,000-$110,000 for food production and therefore ALR land should be developed. The fact is that
20 acres $110,000-$120,000 $70,000-$80,000
the lower mainland is, in many cases, the only location in the province where certain
agricultural products can be produced.
40-60 acres $50,000-$80,000 $50,000-$70,000
Source: Home on the Range: Cost Pressures and the Price of Farmland,
VanCity Credit Union, 2016 Agriculture faces other challenges including: globalization, currency exchange rates,
achieving economies of scale, labour costs and labour supply, water supply, fuel costs,
and regulations/taxation from all levels of government.
Photo: Cheryl UphillAGRICULTURE OPPORTUNITIES
AN EXCITING FUTURE
Building on agricultural expertise and an entrepreneurial
spirit
BC Ministry of Agriculture
This region has been a centre for agricultural research and innovation for almost 125
years. Facilities such as the Pacific Agri-Food Research Centre, Abbotsford Agricultural
Centre, Animal Health Centre, UBC Dairy Education and Research Centre, and UFV’s
Agriculture Department are resources that benefit Fraser Valley farmers. The Region
is also home base for the BC Agriculture Council and other commodity-related
organizations that represent industry interests in BC.
Pacific Agri-Food Research Centre Abbotsford Agriculture Centre
Located in the District of Kent, the Agassiz Experimental Farm, now known as the
Pacific Agri-Food Research Centre, was founded in 1888 as one of the five original The FVRD’s agriculture industry
Experimental Farms in Canada. has the advantage of being able to
Today the Pacific Agri-Food Research Centre in Agassiz has a land base of 310 hectares access agriculture experts housed
(plus a 7.5 ha field site in Abbotsford) and includes poultry research facilities, a feed at the Abbotsford Agriculture Centre
mill, the Avian Research Centre, greenhouses, and a weather station that has been in Abbotsford. The facility is home
collecting data since 1889. to provincial Ministry of Agriculture
employees working in a variety of
The Centre houses a laboratory and office complex conducting research on a wide branches including the Sustainable
range of subjects including the preservation and conservation of poultry genetic Agriculture Management, Policy &
resources. Other areas of research include: healthier crops, livestock welfare and Industry Competitiveness, Business Risk
production, innovative solutions for health and wellness, and new and improved quality for Management, Plant & Animal Health,
food products. In addition, UBC’s Dairy Education and Research Centre is on site, leading Agri-Food Protection.
to increased collaboration between the Centre and University on dairy cattle research.
http://www4.agr.gc.ca/resources/prod/doc/science/pdf/PARC-CRAP_e.pdf The facility is also home to the Animal
Health Centre (AHC) which is a full-
service veterinary diagnostic laboratory.
UBC Dairy Education and Research Centre
The Animal Health Centre is one of only
The University of British Columbia Dairy Education and Research Centre operates in two laboratories in Canada accredited
conjunction with the Pacific Agri-Food Canada Research Centre. The Dairy Centre as a full service Veterinary Diagnostic
opened in 2000 with the goal of providing education and research programs in laboratory by the American Association
support of the dairy industry in BC and beyond. The Centre is unique in Canada and of Veterinary Laboratory Diagnosticians
is one of the largest in the world. (AAVLD).
The Centre’s mission is “to be a world-leading centre for dairy education, research and The mandate of the AHC is to diagnose,
technology transfer”. www.landfood.ubc.ca/dairycentre/ monitor, and assist in controlling and
preventing animal disease in British
University of the Fraser Valley (UFV) agriculture programs Columbia. The AHC provides a full range
of fee-for-service diagnostic testing,
The UFV Agriculture Department is located at UFVs Chilliwack campus where including Pathology, Bacteriology,
students access programs that combine theory and principles with practical training Virology, and Toxicology. In addition,
in horticulture, integrated pest management and livestock production. Given its laboratory staff is frequently involved
proximity to the region’s diverse agriculture sector, graduates are employed in in the development of new diagnostic
a broad range of agricultural occupations, including: lab technicians, integrated tests and the initiation of investigative
pest management monitors, nursery managers, farmhands, farm owner/operators, projects to address emerging disease
greenhouse managers, landscape technicians and many more. www.ufv.ca/agriculture. problems in production animals, poultry,
htm and fish.
BC Agriculture Council
Located in Abbotsford, the BC Agriculture Council’s (BCAC) mission is to “provide
leadership and to take initiative in representing, promoting and advocating the
collective interests of all agricultural producers in the Province of BC”. ARDCORP,
a wholly owned subsidiary of BCAC, delivers a range of programs, including the
Environmental Farm Plan program, to individual producers and the broader agriculture
sector across BC. www.bcac.bc.caREGIONAL FOOD SECURITY
IN THE FRASER VALLEY
Supporting a viable, sustainable and resilient industry
Food security is a broad term that encompasses such issues as protecting agricultural
land, creating an environment that supports a viable and resilient agri-food system,
public access to safe and affordable food and others.
A social and health perspective on food security
According to Canada’s Action Plan on Food Security (1998), food security “exists when
Community gardens: Supporting all people, at all times, have physical and economic access to sufficient, safe and
agricultural education and nutritious food to meet their dietary needs and food preferences for an active and
awareness healthy life”.
Community gardens promote learning In comparison to other countries,
and participation in growing food. food security in Canada is quite
Gardeners experience the process of high, nevertheless, food insecurity
planning, planting, tending and harvesting in Canada does exist for certain
the benefits of their labour. Community segments of the population.
gardens facilitate the gathering of a wide A 2007/2008 Health Canada
range of community members to come household food security survey
together and learn about agriculture in found that food insecurity is more
their communities. There are many other prevalent among households
led by female lone parents,
BC Ministry of Agriculture
benefits beyond education. They also
promote physical activity and healthy families with more than three
eating, reduce greenhouse gas emissions, children, low-income families
beautify neighbourhoods, and more. and aboriginal households. Low
income households are often
There are several organizations in the faced with making a choice between healthy food and rent. In the FVRD, more than
region that promote gardening. The 11,000 households spend 50% or more of their income on housing, leaving little left
Chilliwack Schools Garden Program is one over for spending on food.
of the oldest school garden programs in
Canada, and aims to increase awareness As discussed in the Health and Active Living in the FVRD Snapshot, there are health
of food production among children. The implications of not eating healthy foods. Increasingly sedentary lifestyles, an aging
Valley Permaculture Guild operates several population, the threat of decreasing air quality and lack of access to healthy food
community gardens in the region as well options are all factors that have increased the rate and costs of chronic disease over
as other local food related initiatives. Here time. Statistics Canada’s 2007/08 Canadian Community Health Survey found that
at the FVRD, we operate a small, rooftop despite this region having one of the most diverse and productive agricultural areas in
garden which raises agriculture awareness Canada, less than half the residents of the FVRD consume the recommended minimum
in our organization. of five fruits and vegetables daily.
Although income can be a barrier, it is important to recognize that personal preferences
of people who choose not to eat healthy foods also plays a role. Efforts aimed at
supporting farmers, farmers’ markets and other initiatives that encourage people to
eat healthier can ultimately benefit both the healthcare and agricultural sectors.REGIONAL CLIMATE CHANGE
IN THE FRASER VALLEY
What is Climate Change
Climate change is not a new
occurrence. The Climate has
fluctuated continuously over eons
as part of a natural cycle. However,
it is recognized that the increase
in the consumption of fossil fuels
over the last century has begun to
alter the natural cycle by raising the
temperature at a higher rate than
would normally be the case. Fossil
fuels release Greenhouse Gases
such as carbon dioxide and carbon
Global warming is
monoxide into the atmosphere the challenge of our
which then trap the sun’s heat, generation . How we
resulting in rising temperatures. respond will shape
The levels of carbon dioxide in the future of not just our
the atmosphere have increased environment, but also
approximately 30% since pre-
industrial times. Further aggravating the problem, the loss of forest cover reduces
our economy, our society,
the amount of carbon which can be reabsorbed by the earth. (Changes in concentration of our communities, and
atmospheric carbon dioxide, other greenhouse gases, and aerosols, B. Geerts and E. Linacre, 2002) our way of life .
Climate change and Energy are indelibly intertwined. When we consume energy BC Climate Action Plan
derived from fossil fuels we contribute to Climate Change. The FVRD is no exception.
In 2010, residents and businesses in the Fraser Valley Regional District produced about
1.9 million tonnes of carbon. (CEEI report, 2007)
In coming years, a changing climate is expected to impact
the agriculture system in a number of ways
The FVRD and the BC Agriculture Council’s Climate Action Initiative completed a
climate adaptation strategy for the Fraser Valley Regional District in 2015. Analysis
showed that while small variations in weather are expected, and managed, on a year-
to-year basis, the scope and scale of climate change is anticipated to exceed all other
experiences. It is imperative for the agriculture system to plan for, and adapt to, a
changing climate before the impacts start to materialize.
BC Ministry of Agriculture
BC Ministry of Agriculture
The Mission Demonstration ProjectREGIONAL CLIMATE CHANGE
UNDERSTANDING THE IMPACTS
Climate predictions in the Fraser Valley
There are several climate trends expected to affect agriculture in the Fraser Valley. The
first is changes in temperature. Temperature projections call for an increasing trend in
all seasons, with summer warming slightly more. By the 2020s, an annual average of
Nicomen Slough Dike E
1°C warmer is expected to be the norm.
Also expected are 15 more frost-free
days and 184 more growing degree-days
Dikes in the Fraser Valley
annually, which may in some cases be a
benefit to for some agriculture (Regional
The Lower Mainland has been exposed
Adaptation Strategy, 2015, p.6-7).
to historic flooding both from the Fraser
River as well as its subsidiaries. As such,
Changing precipitation is also a
much of the land in the region is protected
concern. The overall annual trend for
by a system of dikes over 100km long
precipitation is for an increase of 4% by
and built over a period of decades and
2020, which will grow to 7% by 2050.
to varying standards. Dikes protect
During the summer months, a decrease
agricultural and urban land alike. In 2015,
in precipitation is expected while winter
The Ministry of Forests, Lands, and Natural
months will experience an increase.
Resources commissioned an overview
Also, a marked decrease in the amount
assessment of 74 major dykes in the
of falling snow is projected (Regional
Lower Mainland to evaluate the level of
Adaptation Strategy, 2015, p. 7).
protection and identify deficiencies.
Extreme weather patterns are also
expected to change. In the next several
Of particular relevance to the FVRD is
years, projections show an increase in
that upgrading dikes is a major challenge.
the magnitude, frequency, and intensity
Such an undertaking requires significant
of extreme weather events. Abnormally
collaboration and investment to reduce
high temperatures are likely to occur more often, while low temperature events will
flood risk in the Fraser Valley. A worse case
occur less frequently. Models predict that we will see 2.6 times the number of summer
flood scenario for the Valley could see
warm days (days in the summer months that are warmer than the 90th percentile
farm losses in excess of $830 million which
could translate into a broader community
impact of $1.1 billion.
DRIER, WARMER SUMMERS
• Increased drought risk
• Disrupts flowering and pollination
• Increased pest and disease pressures
historic baseline temperature for that day), and 3.8 times the number of extremely
hot days (days so hot they used to occur only once every 10 years). The intensity and
magnitude of extreme rainfall events are also projected to increase. In fact, we can
expect 1.6 times the number of extremely wet days (days so wet that in the past they
would occur once every 10 years) (Regional Adaptation Strategy, 2015, p. 7).
WETTER WINTERS
• Flood risk
• Erosion and nutrient leeching
• Crop damage
A heavy winter rainfall brings Marshall Creek
over its banks - Abbotsford, January 2006.Climate change impacts on agriculture Projected Annual Average
Temperature Change (2029-
There are five main impact areas associated with the previous climate projections (see 2099)
Regional Adaptation Strategy, 2015, p. 13-32). Source: PCIC Regional Analysis Tool, 2016
Impact 1: Warmer, drier summers
4.0
Agriculture relies on water, consuming both surface and groundwater for irrigation.
Water sources in the region are already stretched and demand is only going to 3.5
increase as temperatures rise. Without adequate irrigation, crop yields and quality
will be impacted, as well as livestock health and productivity. On the other hand, 3.0
increased temperature may present better harvesting conditions.
Temperature
2.5
change
(degrees
Impact 2: Increased precipitation and extreme events celcius)
Large amounts of precipitation can cause site specific flooding, causing crop loss and 2.0
other damages. Heavy precipitation can also cause erosion and nutrient leaching,
1.5
which impact both plant health and productivity.
1.0
Impact 3: Increased Freshet Flood Risk 2039 2069 2099
Freshet flooding is a seasonal event which is the result of spring/summer snowmelt Year
upstream. With climate change, it is expected that the magnitude and frequency of
large floods on the Fraser River will increase. It is estimated that a worst case flood
will cause over $800 million in damage to farmers’ assets and have an impact of
$1.1 billion on the FVRD’s economy as a whole (Freshet Flooding and Fraser Valley Projected Increase in Extreme
Agriculture: Evaluating Impacts and Options for Resilience Study, 2016, p.15). Precipitation Events
Source: PCIC Regional Analysis Tool, 2016
Impact 4: Changes to pests and pollinators
Warming temperatures are already introducing Present day 2050s
pests to the region. Spotted wing drosophilia is a
new pest that has moved into BC due to warming
and causes damage to berry crops. Extreme
temperatures also increase the prevalence of plant
and livestock diseases, and reduce the effectiveness
of pollinators.
Impact 5: Greater frequency and intensity of
extreme heat events.
High temperature early in the season can
affect germination and establishment rates
for some vegetables and sudden increases in 1.6 times the number of extremely wet days
temperature can cause damage to berry crops.
For some commodities, such as mushrooms, rising
temperatures can increase climate control costs.
Also, early ripening creates pressure to harvest quickly and difficulty in preventing
spoilage. Farmers are already experiencing labour force challenges as crops that used Lower Mainland Flood
to ripen sequentially, are now ripening at the same time making it difficult to find Management Strategy
available labour. Livestock can also be impacted by high temperatures resulting in
reduced growth and high stress. The Lower Mainland Flood Management
Strategy is a collaborative, regional
Worst case freshet flood scenario (NHC, 2016) initiative commissioned by the Fraser
Basin Council. It aims to protect the Lower
Harrison Hot Springs
Mainland from Fraser River and other
flood risk. The initiative brings together
43 funding partners including the federal
and provincial government, 27 local
Chilliwack
governments, and 12 other organizations.
Phase 1 of the strategy was completed
in 2016, and will be followed by phase 2
Abbotsford (development of an action agenda) over
2016-2018 and phase 3 (implementation
of the strategy) in 2018.
See: http://www.fraserbasin.bc.ca/water_
flood.htmlSUPPORTING AGRICULTURE
GOVERNMENT INITIATIVES
Supporting a viable, sustainable and resilient industry
Governments provide support to agriculture through a wide variety of policy measures.
These range from municipal and regional initiatives to federal programs.
British Columbia Agriculture Plan: Growing a Healthy Future for BC
Families
Road Map to 2020 - B.C.
Agrifood and Seafood Strategic BC’s Agriculture Plan Vision is: “Continued development and growth of an economically
Growth Plan viable and resilient agriculture and food sector which contributes significantly to:
• The health of British Columbians;
Launched in 2015 by the Provincial • Climate change mitigation;
government, Road Map to 2020 is a • Environmental sustainability; and
comprehensive plan to increase overall • A growing B.C. economy.”
sector revenues to $15 billion per year by
2020. This will be achieved by provincial agencies, local/regional governments and
community and industry groups implementing strategies linked to:
The plan aims to provide direction to the • Producing Local Food for a Changing World;
agrifood sector to help: • Meeting Environmental and Climate Challenges;
• Achieve economic growth; • Building Innovative and Profitable Family Farm Businesses;
• Adapt to climate change; and, • Building First Nations Agricultural Capacity; and
• Maintain food security. • Bridging the Urban/Agricultural Divide.
http://www.agf.gov.bc.ca/Agriculture_Plan/Agriculture_Plan.pdf
Included in this strategy are 20 new
actions including policies that will drive
growth in the sector by: Agriculture planning at the regional and municipal level
• Increasing production;
• Driving competitiveness; and, The FVRD and our member municipalities are keenly aware of the importance of
• Building markets. agriculture to this Region. Over the past decade the FVRD has partnered with Metro
Vancouver to develop an Economic Strategy for Agriculture in the Lower Mainland and
The plan was developed in collaboration the Cities of Abbotsford and Chilliwack, and the District of Kent have completed or
with the Minister’s Agricfood Advisory are in the process of developing Agriculture Plans. In 2016, the City of Abbotsford is
Committee comprised of leaders from undertaking an extensive review of agriculture through the “AgRefresh” initiative.
the agrifood and seafood sector, business
community, local food movement, and In addition, the Ministry of Agriculture has worked with local governments to undertake
agriculture post-secondary institutions. agricultural land use inventories to help the province and local governments better
understand the nature of agriculture in the region.
http://www2.gov.bc.ca/assets/gov/farming-
natural-resources-and-industry/agriculture-
and-seafood/strategic-growth-plan.pdfEnvironmental Farm Plans (EFP)
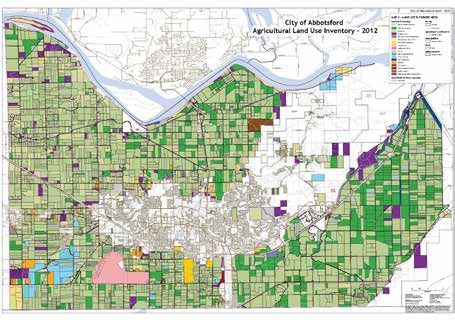
The most recent inventory took place in the agricultural areas of FVRD in the summers The B.C. Environmental Farm Plan
of 2011-2013. These windshield surveys take place during the growing months Program is administered by the BC
when the land cover characteristics, agricultural activities and irrigation systems are Agricultural Research & Development
most apparent. The resulting Geographic Information System (GIS) coverages are a Corporation (ARDCORP) a wholly
valuable planning tool for both local governments and the province. owned subsidiary of the BC Agriculture
Council. The program is funded
Agricultural land use inventories support municipal and regional efforts toward by Growing Forward, a federal
developing agricultural plans and other agricultural initiatives. As an example, the and provincial initiative aimed at
results of this most recent survey and others in the region was fed into the province’s encouraging producers from across
Agriculture Water Demand Model (AWDM) to determine current and future water the province to adopt Beneficial
demands for agriculture in the FVRD. Management Practices (BMP) to
enhance agricultural sustainability and
contribute to a cleaner and healthier
environment.
Fraser Valley ALR Land Use The program is voluntary, involves
no cost to the producer and is
confidential.
The EFP program involves conducting
a risk assessment to identify potential
areas of concern in relation to a farm’s
environmental health. This is achieved
through the use of a specifically
designed workbook provided by EFP
planning advisors (PA). Once issues
have been identified, the producer can
67% - Actively farmed or 15% - 18% - work with a PA to develop an action
supporting farming Unavailable Available land plan to manage identified risks and
or limited with potential identify priority action items.
potential for for farming
farming Once an EFP has been approved,
producers are eligible for cost sharing
incentives under the Growing Forward
BMP Program to undertake projects
that will address environmental issues
identified through the risk assessment
Regional Growth Strategy (RGS)
process.
The Choices for our Future Regional Growth Strategy, adopted in 2004, recognizes
the importance of agriculture to the region’s past, present and future. Since the Once all of the priority items have
strategy was adopted, the region has undertaken a number of initiatives in support been achieved, the plan is considered
of agriculture. These include: implemented and a certificate and
• Collaborated with the Ministry of Agriculture to model potential impacts gate sign can be issued.
potential impacts of climate change on water demand in the region;
• Working with the Ministry of Agriculture to model potential impacts of The gate signs allow the public to see
climate change on water demand in the region; that the agriculture sector is doing
• Regional Growth Strategy Update its part in supporting environmental
• Fraser Valley Regional Adaptation Strategy sustainability. This is important as
• With AGRI, 2011-13 Agricultural Land Use Inventory consumers are paying increasing
• With AGRI, Agricultural Water Demand Model attention on where their food comes
• Freshet Flooding and Fraser Valley Agriculture: Evaluating Impacts and from and how it is produced.
Options for Resilience Study
Upcoming:
• Support implementation of Cimate Action initiatives
• Continue to work with the Fraser Basin Council on a Regional Flood
Management Strategy
The Mission Demonstration ProjectYou can also read