Material flow analysis & City Blueprint Framework of Singapore - KWR 2021.010 | January 2021
←
→
Page content transcription
If your browser does not render page correctly, please read the page content below
KWR 2021.010 | January 2021

Material flow analysis
& City Blueprint
Framework of
Singapore
KWR 2021.010 | January 2021 Material flow analysis & City Blueprint Framework of Singapore 1
KWR 2021.010 | January 2021                       Material flow analysis & City Blueprint Framework of Singapore                             2

Report

Material flow analysis & City Blueprint Framework of Singapore

KWR 2021.010 | January 2021

Project number
403285-001

Project manager
Kees Roest

Client
RVO

Author(s)
Johann Poinapen, Stef Koop and Kees Roest

Quality Assurance
Prof Dr Kees van Leeuwen

This report is not a public document and is only provided to the client. KWR will refrain from distributing this report outside the client
organisation and will therefore not provide the report to third parties, unless KWR and the client agree otherwise. The client is entitled
to distribute the report subject to KWR's prior consent. KWR may attach conditions to consent to the dissemination of (parts of) the
report.
Procedures, calculation models, techniques, designs of trial installations, prototypes and proposals and ideas put forward by KWR, as
well as instruments, including software, that are included in research results are and remain the property of KWR.

Keywords
Resource recovery - Water in the Circular Economy - City Blueprint – ReCirc Singapore

Year of publishing                             PO Box 1072
2021                                           3430 BB Nieuwegein
                                               The Netherlands
More information
                                                                                  January 2021 ©
Dr Johann Poinapen, Dr Stef Koop, Dr Kees      T +31 (0)30 60 69 511
Roest & Prof. Kees van Leeuwen                 E info@kwrwater.nl                 All rights reserved by KWR. No part of this publication may be
T +31611728983                                 I www.kwrwater.nl                  reproduced, stored in an automatic database, or transmitted
E johann.poinapen@kwrwater.nl                                                     in any form or by any means, be it electronic, mechanical, by
                                                                                  photocopying, recording, or otherwise, without the prior
                                                                                  written permission of KWR.
KWR 2021.010 | January 2021           Material flow analysis & City Blueprint Framework of Singapore                3

Acknowledgements
The completion of this study would not have been possible without the support and contributions of many people
and stakeholders. First and foremost, we wish to thank the Netherlands Enterprise Agency (RVO) for the grant that
has enabled this work. We extend our thanks to the Dutch Embassy in Singapore for their support in connecting us
with the relevant organisations to obtain the data for the study. In addition, our thanks go to ReCirc Singapore
whose members have generously contributed to obtaining the information needed for the material flow analysis
both in the Netherlands and Singapore. Participants in the ReCirc Consortium are water utility Waternet, national
public work authority Rijkswaterstaat, companies Witteveen+Bos, Nijhuis Industries, Blue Phoenix Group, Paques,
CirTec, Asia Pacific Breweries, Heineken, Organic Village and Upp! UpCycling Plastic. Research institutes that
participate are AMS institute with Delft University of Technology & WUR and KWR Water Research Institute.
KWR 2021.010 | January 2021 Material flow analysis & City Blueprint Framework of Singapore 4
Summary
This report describes the desktop study aimed to identify opportunities for enhancing the circular economy, which
is already developing in promising ways in the Netherlands, allowing for demonstration and implementation
opportunities in Singapore, as well as generating a mutual learning between the two countries.
Singaporean Ministries and governmental agencies are currently developing a shared vision about the best way
forward for a zero waste nation and circular economy in Singapore in addition to the Sustainable Singapore Blueprint.
They are looking for support from the Netherlands because of our internationally recognised position as a frontrunner
in this field. Moreover, there are clear similarities between Singapore and the Netherlands. Both countries have
limited natural resources and land space, they are densely built, and have ageing populations. There is therefore
pressure on liveability and productivity. A systematic understanding of water resources and waste flows constitutes
an important step towards a circular economy.
Accordingly, in order to better understand both the Singaporean and Dutch approach to integrated water resources
management (IWRM), waste streams and the potential for circularity, KWR Water Research Institute was engaged
by the Netherlands Enterprise Agency (rvo.nl) as part of the Knowledge to Knowledge (K2K) project under the
Partners for International Business (PIB) programme to produce an updated Trends and Pressures Framework (TPF)
and a City Blueprint Framework (CBF) and to perform a material flow analysis (MFA) for both Singapore and the
Netherlands. These three tools (TPF, CBF and MFA) will be instrumental for the identification of opportunities in the
area of the circular economy. They will also be helpful in identifying challenges that could be tackled in Singapore
by businesses, governmental organisations and knowledge institutes from the Netherlands.
From the assessment of the TPF, it was observed that both Singapore and Dutch cities face pressures related to flood
risk and have relatively little concern with respect to social, financial or governance aspects. This means that in term
of policy measures and urban planning, the similarity in required technologies and management solutions is high and
exchange of the best practices can therefore be lucrative and meaningful.
The CBF’s assessment of urban IWRM found that the largest learning potential that Dutch cities can offer Singapore
may be with respect to recovery and reuse of resources from solid waste and wastewater. In the light of Covid-19 as
well as trafficking and production of illicit drugs, sewer epidemiology also plays an increasingly important role in the
Netherlands in addressing both issues. This forms another promising learning opportunity that Dutch cities can offer
Singapore.
The development and application of material flows for four selected waste streams - namely incinerator bottom ash,
food waste, plastics and materials in the water cycle – provided valuable insights into business opportunities in
Singapore, the Netherlands and Singaporean-Dutch collaboration’s that can foster the circular economy. The MFA
identified challenges and opportunities that need to be addressed by businesses, governmental organisations and
knowledge institutes.
A significant amount of waste either in stock (landfilled) or converted as waste to energy that could be
(profitably) recycled and reused. The Netherlands is leading in many respect when it comes to waste
recycling and could offer support in the form of knowledge and expertise. This is particularly the case for
food waste and plastic recycling and materials recovery in the water cycle.
Similarly, Singapore is initiating some recycling efforts in its transition to a circular economy that could very
well benefit the Netherlands, namely in water recycling and Incinerator Bottom Ash. Establishing a platform
where the knowledge, learning and experiences can be shared could facilitate such exchange.
KWR 2021.010 | January 2021 Material flow analysis & City Blueprint Framework of Singapore 5
Finally, Singapore is well poised to use the international playing field to give momentum to the circular
economy transition, namely in Asia. With the results of this study, Dutch businesses, including Knowledge
Institutes, are able to identify future business opportunities related to the Zero Waste objectives (circular
economy) in Singapore. There is Singaporean interest in the Green Deal approach of the Netherlands. A
starting point could be the Green Deal Circular Procurement and expanding the Material Flow Analysis
conducted in this research by expanding waste flow monitoring in Singapore. In this way, conducting a
detailed MFA for Singapore to adequately quantify the economic value of waste that can potentially be
recycled and/or exported as raw materials for other products.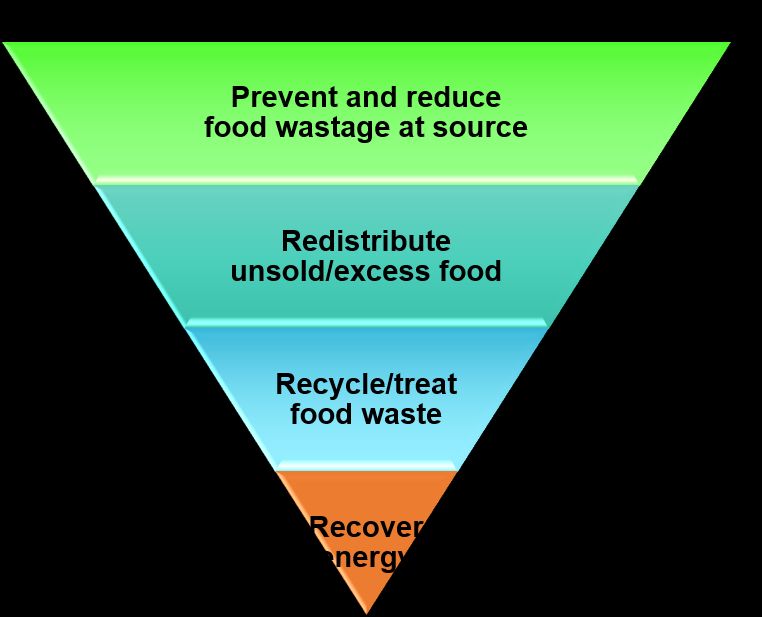
KWR 2021.010 | January 2021    Material flow analysis & City Blueprint Framework of Singapore          6

List of acronyms

 BCI                          Blue City Index
 CBF                          City Blueprint Framework
 GL/a                         Giga litres per annum
 IBA                          Incinerator Bottom Ash
 IWRM                         Integrated Water Resources Management
 K2K                          Knowledge to Knowledge
 MFA                          Material flow analysis
 NEA                          National Environment Agency
 PIB                          Partners for International Business
 ReCirc Singapore             Joint development of resource recovery technology for circular economy
 RVO                          Netherlands Enterprise Agency
 t/a                          Tons per annum
 TPF                          Trends and Pressures Framework
KWR 2021.010 | January 2021             Material flow analysis & City Blueprint Framework of Singapore   7

Contents

Acknowledgements                                                            3
Summary                                                                     4
List of acronyms                                                            6
Contents                                                                    7

1       Introduction                                                        8
1.1     Project objective                                                   8
1.2     Approach to meet the project objective                              9
1.3     Key result areas                                                    9

2     Identifying the learning potential for improved water
      management                                                            10
2.1   Brief introduction City Blueprint Approach                            10
2.2   Results: comparing Singapore and the Netherlands                      11
2.3   Key recommendations                                                   15
2.3.1 Wastewater resource recovery and reuse                                15
2.3.2 Solid waste management                                                16

3       Material flow analysis Singapore & the Netherlands                  17
3.1     Material flow analysis                                              17
3.2     Development of a material flow analysis for Singapore
        and the Netherlands                                                 17
3.3     Results                                                             18
3.3.1   Material Flow Analysis of Food waste                                18
3.3.2   Material Flow Analysis of plastic                                   21
3.3.3   Material Flow Analysis of Incinerator Bottom Ash (IBA)              24
3.3.4   Material Flow Analysis in the water cycle                           26

4       Business opportunities derived from the Material
        Flow Analyses                                                       31
4.1     Exploration of business opportunities in Singapore and
        the Netherlands                                                     32
4.2     Other business opportunities to explore using the
        circularity ladder                                                  35

5       Conclusion                                                          38

6       References                                                          39
KWR 2021.010 | January 2021 Material flow analysis & City Blueprint Framework of Singapore 8
1 Introduction
KWR Water Research Institute was engaged by the Netherlands Enterprise Agency (rvo.nl) as part of the Knowledge
to Knowledge (K2K) project under the Partners for International Business (PIB) programme.
Singaporean Ministries and governmental agencies are currently developing a shared vision about the best way
forward for a circular economy in Singapore in addition to the Sustainable Singapore Blueprint. They are looking for
support from the Netherlands because of our internationally recognised position as a frontrunner in this field.
Moreover, there are clear similarities between Singapore and the Netherlands. Both countries have limited natural
resources and land space, they are densely built, and have ageing populations. As a consequence, there is great
pressure on liveability and productivity. A systematic understanding of water resources and waste flows constitutes
an important step towards a circular economy.
However, a clear picture of Integrated Water Resources Management (IWRM) performance and material/waste flows
(food and plastic), and a comparison with the Dutch situation, is not yet available. Information of this kind will help
Singapore to address its challenges in relation to the circular economy and waste management. Furthermore, this
information will also help to identify business opportunities for Dutch companies. ReCirc Singapore focuses on a few
circular-economy pillars. A material flow analysis (MFA) is currently missing and it will help to determine potential
projects. Dutch governmental agencies, knowledge institutes and companies have established a unique partnership
to work on creating circular solutions in the PIB programme ReCirc Singapore. Participants in the ReCirc Consortium
are water utility Waternet, national public work authority Rijkswaterstaat, companies Witteveen+Bos, Nijhuis
Industries, Blue Phoenix Group, Paques, CirTec, Asia Pacific Breweries, Heineken, Organic Village and Upp! UpCycling
Plastic. Research institutes that participate are AMS institute with Delft University of Technology & WUR and KWR.
1.1 Project objective
The project provides clear insights into the performance and bottlenecks, main social, environmental and financial
aspects, and material flows related to food waste, plastic, the water cycle and incinerator bottom ash in Singapore
by comparison with the Netherlands.
The aim is to develop a single integrated, sustainable zero-waste solution with Singaporean partners. The ReCirc
partnership aims to further the transition from a linear to a circular economy, not just in Singapore and the
Netherlands but also worldwide. The objective is to promote innovative entrepreneurship and business opportunities
for Singaporean and Dutch companies, targeting topics related to resource recovery from waste and used water,
namely for the following streams.
food waste systems
plastic waste
incinerator bottom ash
resource recovery from the water cycle
In fulfilling this objective, this report provides a fully updated Trends and Pressures Framework (TPF) and a City
Blueprint Framework (CBF) of Singapore and several Dutch cities. The TPF will summarise the main social,
environmental, financial and governance aspects that form boundary conditions in which cities have to operate. The
CBF on the other hand, provides an overview of a city’s IWRM performance and its bottlenecks. The CBF indicators
break down into the following seven categories: water quality, solid waste treatment, basic water services,
wastewater treatment, infrastructure, climate robustness and governance.KWR 2021.010 | January 2021 Material flow analysis & City Blueprint Framework of Singapore 9
Expanding on this baseline assessment, a systematic overview of material flows will be instrumental for the
identification of opportunities in the area of the circular economy, which is already developing in promising ways in
the Netherlands, allowing for demonstration and implementation opportunities in Singapore. These tools will also be
helpful in identifying challenges that could be tackled in Singapore by businesses, governmental organisations and
knowledge institutes from the Netherlands.
1.2 Approach to meet the project objective
A desktop research was undertaken to achieve the project objective. The existing Trends and Pressures Framework
(TPF) and the City Blueprint Framework (CBF) have been fully updated and applied to better understand the
Singaporean approach to IWRM, waste streams and the potential for circularity. Data for the CBF have been obtained
from KWR as well as from Singaporean organisation using the questionnaires that are part of the City Blueprint
Approach (Koop and Van Leeuwen 2020 a,b,c). Singaporean and Dutch organisations and partners have also provided
available data on the relevant streams, namely food waste, plastic, incinerator bottom ash and resources in the water
cycle. This approach has also enhanced the cooperative situation and stimulate further knowledge exchange and
prospective future collaboration. KWR collected and processed the data and made a comparison of the results from
both countries.
For the MFA data, KWR developed the mass flow Excel spreadsheets with the flow diagrams to illustrate the flow of
the four waste streams investigated in this study. These mass flow spreadsheets were sent to the relevant key
partners including the ReCirc partners to seek their collaboration and input into collecting the data needed for the
MFA. This was followed up by several meetings with the key partners to discuss and confirm the data set. In addition,
some data were obtained from the literature, from both the Netherlands and Singapore government websites, and
public reports released. Although a lot of the data needed could be obtained, there are some data gaps especially in
Singapore where the individual values making up the total were not available. Several attempts were made to access
and obtain these individual data but in vain. This could due to the fact that these data are not available or not yet
collected to that level of detail. There could therefore be an opportunity to develop future projects to collect these
missing data. These future studies could be jointly conducted by research institutes both in the Netherlands and
Singapore.
1.3 Key result areas
Three key result areas have been identified in this project. They are:
1. An insight into the TPF and CBF comparing Singapore and several cities in the Netherlands, material flows related
to food waste, plastic, incinerator bottom ash and the resources in the water cycle in Singapore by comparison
with the Netherlands, and the performance and bottlenecks, the main social, environmental and financial
aspects based on the TPF analysis of Singapore.
2. Business opportunities and recommendations for the Dutch sector will be derived from the research.
3. A final public report with all results will be published and presented to the Dutch and Singapore sectors.KWR 2021.010 | January 2021 Material flow analysis & City Blueprint Framework of Singapore 10
2 Identifying the learning potential for
improved water management
2.1 Brief introduction City Blueprint Approach
In order to identify specific opportunities to exchange best practices, technologies, policies and management
experiences between Singapore and cities in the Netherlands, the City Blueprint indicator assessment methodology
results are compared. The City Blueprint Approach consists of three complementary frameworks (Figure 1). This
report will make use of the first two frameworks: the Trends and Pressures Framework and the City Blueprint
performance Framework.
Figure 1 The City Blueprint Approach consisting of three complementary frameworks (Koop and Van Leeuwen,
2020a,b,c). This report makes use of the Trends and Pressures Framework and City Blueprint performance
Framework to identify opportunities to exchange best practices, technologies, policies and management
experiences between Singapore and cities in the Netherlands.
The TPF provides a baseline overview of the key social, environmental, financial and governance challenges that these
cities may face. The framework consists of 24 indicators that are scored from 0 (no concern) to 10 (great concern).
The indicators are scored in a transparent, simple and intelligible fashion through an online available questionnaire:
https://library.kwrwater.nl/publication/61396712/. The indicators are scored in a transparent, simple and
intelligible fashion through an online available questionnaire: The CBF consists also of 24 indicators and provides a
comprehensive overview of integrated urban water management in a city. As such, the indicators are divided over
seven broad categories: I basic water services, II water quality, III wastewater treatment, IV water infrastructure, V
solid waste, VI climate adaptation and VII management and action plans. The indicators are scored from 0 (poor
performance) to 10 (high performance) through the use of publicly available data and information validated and
acquired with local authorities including water utilities, municipalities, flood risk authorities, waste companies and
others. The geometric mean of the indicators is the Blue City Index (BCI). The indicators are scored in a transparent,
simple and intelligible fashion through an online available questionnaire:
https://library.kwrwater.nl/publication/61397318/.KWR 2021.010 | January 2021 Material flow analysis & City Blueprint Framework of Singapore 11 The assessment has been widely accredited through the assessment of 125 cities in 53 countries across the globe (Figure 2) which are published in over 25 peer-reviewed publications (for a publication overview see: https://www.ipr.northwestern.edu/our-work/research-tools-apps/water-insecurity/). Recently, the methodology has been revised and as such this report provides updated assessments of Singapore in comparison with the Dutch cities. Based on this assessment it aims to identify the most viable opportunities for mutual learning between Singapore and the Netherlands in the area of urban water management. The most recent publications comprise the cities of Bandung (Rahmasari et al., 2021) and Antwerp (Huyghe et al., 2021). Figure 2 The overall score of the 24 water management indicators is the Blue City Index which is scored from 0 (poor performance) to 10 (high performance). A total of 125 cities have been assessed across the globe. In total, 10 Dutch cities have been assessed by the City Blueprint methodology: Amsterdam (BCI= 8.7), Groningen (BCI= 7.2), Dordrecht (BCI= 7.1), Leeuwarden (BCI= 5.9), Nieuwegein (BCI= 6.8), Rotterdam (BCI= 6.7), Maastricht (BCI= 6.6), Utrecht (BCI= 6.1), Venlo (BCI= 5.9) and Eindhoven (BCI= 5.8). Singapore’s BCI is 8.1 points. In order to identify the learning potential between Singapore and Dutch cities, the Dutch cities of Amsterdam, Groningen, Dordrecht and Rotterdam are included in this assessment because they have comparable scores and are not too small in terms of number of inhabitants. Both aspects are considered important for successful exchange of best practices, technologies, policies and management experiences that are reasonably compatible. 2.2 Results: comparing Singapore and the Netherlands Trends and pressures In cities across the globe, local water managers can face social, environmental, financial or governance pressures that may hamper an optimal performance in terms of water management performances. When comparing water management performances of cities, it is essential to take into account the challenges that are imposed on water managers. First of all, it may affect their level of performances. Second and perhaps most importantly, cities that face similar challenges are more likely to require similar solutions and therefore have a more meaningful exchange of knowledge, experiences and have higher chances of forming mutual business opportunities. Therefore, the TPF has been developed to provide a baseline overview of the key challenges that these cities face. The TPF framework consists of 24 indicators that are scored from 0 (no concern) to 10 (great concern). Figure 3 provides the indicator
KWR 2021.010 | January 2021             Material flow analysis & City Blueprint Framework of Singapore               12

results for Singapore (red) and the Dutch cities (outlined in black). Because the trends and pressures affecting water
management are very similar for Dutch cities, the figure provides an average indicator score of the previously
mentioned 10 Dutch cities.

Figure 3 The social, environmental, financial and governance pressures that may affect urban water management.
The more red the more concern. In red the scores of the TPF indicators for Singapore. Outlined in black the TPF
scores for the Dutch cities.

Remarkably, the scores of the Trends and Pressures Index is 2.9 points both for Singapore and the Dutch cities.
Overall, this indicates that most pressures are of little concern. Surface water biodiversity in the Netherlands is a
major issue (indicator 12) due to the many modified water courses and pollution from agriculture, industry and the
domestic sector in this densely populated country, as well as from pollution entering from neighbouring countries
via the rivers Rhine and Meuse. As such biodiversity issues are rather different compared to Singapore where they
predominantly involve coastline disturbance, nature conservation and more localised water pollution issues. Due to
a lack of natural water resources, Singapore is particularly water-stressed (indicator 9) whereas water demand is
expected to double by 2060. Singapore is already heavily vested in highly treated reclaimed wastewater (NEWater)
and seawater desalinisation for its water supply and is also rather advanced in water-use efficiency, particularly for
large water consumers. Although the more recent water-scarcity episodes in the Netherlands are far less severe,
good practices in reuse of treated wastewater (for non-potable purposes) and water-use efficiency regulations and
compliance of industry both provides extensive learning opportunities for the Netherlands. Apart from surface water
biodiversity which is a major concern in the Netherlands and the concern of freshwater scarcity in Singapore, the
pressures are rather similar. Both Singapore and Dutch cities face pressures related to flood risk (indicators 5, 6 & 7)
and have relatively little concern with respect to social, financial or governance aspects. This means that in term of
policy measures and urban planning, the similarity in required technologies and management solutions is high and
exchange of the best practices can be lucrative and meaningful.

City Blueprint results Singapore
Singapore is the second highest scoring city of the 125 cities that have been assessed with the City Blueprint
Approach so far.
KWR 2021.010 | January 2021             Material flow analysis & City Blueprint Framework of Singapore              13

Figure 4 provides the assessment results for Singapore (a web link for a detailed bibliography of the indicator scores
including the calculations and justifications can be provided on request).

Figure 4 Updated City Blueprint results of the city of Singapore (1-10-2020). The message is simple: the bluer the
better. Indicators are scored from 0 (poor performance) to 10 (high performance). Singapore with an overall BCI
score of 8.1 points, is the second best performing city of the 125 cities that have been assessed.

Singapore is an absolute frontrunner in many aspects of urban water management and scores exceptionally high for
indicators related to infrastructure management (indicators 10 – 13) and climate adaptation and urban planning
(indicators 18 – 24). With respect to these aspects of integrated urban water management Singapore forms the lead
example. Nevertheless, three points of improved can be identified:
     1. Wastewater treatment and the recovery of energy and nutrients from wastewater (indicators 7 – 10) are all
         operating to the maximum, except nutrient recovery (indicator 7) and in particular the recovery of
         phosphorous from wastewater scores 0 points. Although the capacity is there to recover phosphorous, there
         is not yet a market where the recovered nutrient can be used as a fertilizer (application possibilities may
         include fertilizing public parks, sport fields or agricultural purposes). Hence, in terms of circular economy
         these nutrients are not being reused and therefore the system is not yet circular. Would these nutrients be
         applied in new markets, the indicator score would go from 0 to a score of 10 points. This would mean that
         Singapore’s overall score, the Blue City Index, would increase from 8.1 points to 9.0 points, making Singapore
         the highest scoring city of the 125 cities assessed so far. It should be noted that other techniques are
         available to cover more materials from wastewater (Van Leeuwen et al., 2018).
     2. The recycling of solid waste still provides room for improvement (indicator 16). The amount of solid waste
         that is collected (indicator 13) is 313.9 kg/day/person which is moderate for a wealthy city. The Dutch cities
         as well as most other wealthy cities produce more solid waste. Nevertheless, this indicators still shows room
         for improvement.
     3. The operating cost recovery ratio for water services is 1.2. A ratio higher than 1 implies that there are more
         operational revenues than operational costs. Although this ratio is positive for Singapore, many other cities
         including Copenhagen, London, Shanghai and Toronto have more reserves (i.e., higher ratio’s) to anticipate
         increases in infrastructure expenditures without being overly dependent on (sometimes irregular)
         government investments.
KWR 2021.010 | January 2021 Material flow analysis & City Blueprint Framework of Singapore 14 Learning potential between Singapore & Dutch cities Figure 5 illustrates the learning potential if Singapore would adopt the best practices from Dutch cities and especially best practices of the city of Amsterdam. Figure 5 Score for the Singapore in blue. The green line shows the improvement potential if best practices from the Netherlands, and in particular Amsterdam, are being adopted. The recovery and application of nutrients from wastewater for new markets such as fertilising public parks (indicator 7) as well as solid waste treatment (indicator 16 & 17) are areas where Singapore can learn from Dutch practices. Dutch cities can improve by adopting Singapore’s best practices related to green space, infrastructure planning and stormwater separation (indicator 18, 12 & 11). The amount of solid waste that is collected (indicator 15) is moderately high for both Singapore and the Netherlands. The Dutch cities as well as most other developed cities produce more solid waste. Chinese cities such as Chongqing, Harbin, Nanning, Shijiazhuang and Tianjin score particularly well for this indicator (i.e., they produce very little waste). With respect to operation cost recovery (indicator 14), cities like Copenhagen, London, Shanghai and Toronto fully recover their operational cost for water services. If Singapore would adopt the best practices for these cities as well, it would have a Blue City Index of 10.0 points. Figure 5 provides a general overview of mutual learning, while Table 1 provides an overview of the indicator scores specified according to two Dutch cities that were included as suitable partners for mutual learning.
KWR 2021.010 | January 2021 Material flow analysis & City Blueprint Framework of Singapore 15
Table 1 City Blueprint scores of Singapore (Si) compared with the Dutch cities of Amsterdam (Am) and Rotterdam
(Ro). In dark green indicators where Singapore scores higher than the Dutch cities. In light green indicators where
one or more Dutch cities score higher than Singapore.
Score
Category Indicator
Si Am Ro
1 Access to drinking water 10.0 10.0 10.0
I Basic water
2 Access to sanitation 10.0 10.0 9.7
services
3 Drinking water quality 10.0 10.0 9.9
4 Secondary WWT 10.0 9.9 9.9
II Water quality 5 Tertiary WWT 10.0 9.8 9.8
6 Groundwater quality 9.1 6.1 6.1
7 Nutrient recovery 0.0 9.9 0.0
III Wastewater 8 Energy recovery 10.0 9.9 5.0
treatment 9 Sewage sludge recycling 8.7 9.9 9.9
10 WWT energy efficiency 9.0 10.0 7.0
11 Stormwater separation 10.0 8.3 0.5
IV Water 12 Average age sewer 8.9 6.4 5.4
infrastructure 13 Water system leakages 9.1 9.4 8.8
14 Operation cost recovery 4.3 8.5 8.5
15 Solid waste collected 6.8 3.1 3.1
V Solid waste 16 Solid waste recycled 6.8 9.8 9.8
17 Solid waste energy recovered 8.7 9.7 9.7
18 Green space 9.7 5.9 5.5
VI Climate
19 Climate adaptation 10.0 10.0 10.0
adaptation
20 Climate-robust buildings 10.0 10.0 9.0
21 Management & action plans 10.0 9.0 8.0
VII Plans & 22 Water efficiency measures 10.0 10.0 10.0
actions 23 Drinking water consumption 9.7 9.8 10.0
24 Attractiveness 10.0 9.0 8.0
Blue City Index 8.1 8.7 6.7
2.3 Key recommendations
The largest learning potential that Dutch cities can offer Singapore may be with respect to recovery and reuse of
resources from solid waste and wastewater. Another option is sewer epidemiology. Wastewater is a reliable source
of information, i.e., “a fingerprint” of the use of chemicals as well as human health biomarkers as demonstrated in
the Netherlands for Covid-19 as well as for the use of pharmaceuticals and trafficking and production of illicit drugs.
This forms another promising learning opportunity that the Netherlands can offer Singapore.
2.3.1 Wastewater resource recovery and reuse
The use of recovered nutrients from wastewater (Indicator 7) is a clear best practice that Singapore can adopt from
the Netherlands and particularly from Amsterdam. Amsterdam has been in a similar situation as Singapore is right
now. Amsterdam was already able to recover the nutrients but was by law not allowed to sell the hygienically product
to agricultural buyers because the law considers this a waste product with potential danger to public health. In this
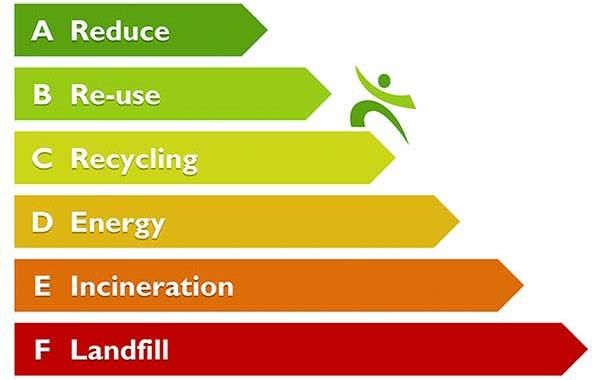
context, a new market was created within the municipality. That is, processing the struvite as a fertilizer for non-KWR 2021.010 | January 2021 Material flow analysis & City Blueprint Framework of Singapore 16 agricultural purposes such as maintaining public parks and sporting fields. Beyond struvite, the reuse of recovered resources such cellulose, bioplastics, Kaumera (alginate-like exopolymers from aerobic granular sludge (bio-ALE)) and biomass is being explored in the Netherlands through public-private partnerships and green deals that are now being effectuated. A prime example is the Energy and Resources Factory initiative. This initiative consists of the joint force of 21 Dutch water authorities and the Foundation for Applied Water Research (STOWA). The Energy and Resources Factory specifically focusses beyond merely technological development by working closely with various businesses in order to ensure market opportunities of recovered resources from wastewater: https://www.efgf.nl/english. For an early market analysis of various resources that can already be (partially) commercially recovered from wastewater, we refer to the following link: https://link.springer.com/article/10.1007/s00267-018-0995-8. One of the earliest commercially applicable products is the recovered phosphorus (i.e., struvite) from wastewater in Amsterdam. The wastewater treatment plant in Amsterdam treats about 2000 m 3 sludge each day. The investment costs are about €4 million and the expected savings are €400,000 per year (Van der Hoek et al. 2017). Accordingly, the return on investments is roughly 10 years. The savings of this process consists of selling the struvite, lowering the maintenance costs of wastewater treatment and better sludge dewatering. The struvite is processed into a fertilizer that is used for maintaining public parks and sport fields. 2.3.2 Solid waste management The recycling of solid waste (indicator 16) is an interesting learning opportunity that the Netherlands has to offer. Recycling rates in the Netherlands are amongst the highest in the world. Waste recycling is more environmentally friendly than burning waste with energy recovery. In this respect, the ‘’ladder van Lansink” has been embedded in Dutch law since 1993 (Figure 6). Figure 6 Dutch waste management adopted the principles outlined in this “ladder van Lansink” embedded in Dutch law since 1993. It provides a priority ladder for solid waste management. Although the amount of solid waste that is produced in the Netherlands is rather high (due to a lack of applying principles A and B), the amount that is recycling is also one of the highest in the world (application of principle C). The main reason for this is the waste separation and collection system which is tailored to different material flows. More details are provided in the material flow analysis in chapter 3.
KWR 2021.010 | January 2021             Material flow analysis & City Blueprint Framework of Singapore             17

   3 Material flow analysis Singapore & the
     Netherlands
3.1    Material flow analysis

Material flow analysis (MFA) is a systematic assessment of the flows and stocks of materials within a system defined
in space and time (Brunner and Rechberger 2004). It has been widely applied to material systems in providing useful
information regarding the patterns of resource use and the losses of materials entering the environment. MFA allows
cities to make smart decisions by clearly understanding where their greatest environmental impacts are taking place.
In many ways, cities function very much like human bodies – they have an ‘urban metabolism’ that stocks up on
resources, consumes, and then disposes of what is ‘leftover’ in the form of waste. Moreover, material flow analysis
provides a solid basis for identifying where meaningful impacts can be made when implementing solutions. In
addition, a MFA allows cities to monitor long-term goals and generating insights and evidence on which solutions are
most effective in delivering the desired results.

MFA is widely applied for environmental education, particularly in waste management. More importantly, MFA has
been used as analytics to support decisions-making on waste management policy and identify potential business
opportunities.

As illustrated in Figure 7, an MFA visualises inflow and outflow of materials. In this example, the flows in and out
related to water, food and energy consumption and their interconnection with the respective emissions and waste
streams within the system are shown. By gaining this overview, it is possible to discern where it is most effective to
put sustainability efforts.

Figure 7 Illustration of inflow and outflow of materials in a city (Metabolic 2020).

3.2    Development of a material flow analysis for Singapore and the Netherlands

Recognising the importance of a Material Flow Analysis (MFA), an MFA related to food waste, plastic, incinerator
bottom ash and the water cycle was conducted to identify opportunities in the area of the circular economy in
Singapore based on the already promising ways observed in the Netherlands. This analysis allowed for demonstration
and implementation opportunities in Singapore. The MFA identified and qualified the flow and stock of these four
streams in both the Netherlands and Singapore. The results can support decision-making of the relevant authorities
who need to carefully plan and implement waste management policies.
KWR 2021.010 | January 2021 Material flow analysis & City Blueprint Framework of Singapore 18
3.3 Results
3.3.1 Material Flow Analysis of Food waste
(i) The Netherlands
In the Netherlands, the amount of good food that is wasted per year counts up to billions of euros. Food waste is not
only a waste of money, but also a waste of valuable resources (such as water, soil and energy) that is needed to
produce and transport the food. A Material Flow Analysis (MFA) was conducted to quantify the flow of food waste
from generation to disposal in the Netherlands. The food waste flows and mass balance are shown in Figure 8 and
Table 2 respectively.
Import = 5,111,000 t/a dStock = 6,000 t/a Export = 5,105,000 t/a
2,550,000 t/a
Waste to Energy 1,058,000 t/a
Consumers waste
Recycling and Reuse 1,492,000 t/a
Landfill
Mass of
materials out of
Total food waste the system 5,105,000 t/a
5,111,000 t/a 2,561,000 t/a
Energy recovery 170,000 t/a
Recycling 2,380,000 t/a
Agricultural waste
Other reuse 5,000 t/a
0 t/a
Disposal in
landfills
Landfill 6,000 t/a
Figure 8 Material flow of food waste (tons per annum (t/a) in the Netherlands. Data retrieved from:
https://afvalmonitor.databank.nl//Jive/. (Year 2018 data).KWR 2021.010 | January 2021 Material flow analysis & City Blueprint Framework of Singapore 19
Table 2 Material flow balance of food waste (tons per annum (t/a)) in the Netherlands. Data retrieved from:
https://afvalmonitor.databank.nl//Jive/. (Year 2018 data).
Food waste flow Mass flow in Mass flow out Mass flow internal
(t/a) (t/a) (t/a)
Total food and agricultural waste 5,111,000
Consumers food waste 2,550,000
Agriculture waste 2,561,000
Consumers waste to landfill 0
Consumers waste energy recovery 1,058,000
Consumers waste recycling and reuse 1,492,000
Agriculture waste to landfill 6,000
Agriculture waste energy recovery 170,000
Agriculture waste recycling 2,380,000
Other agricultural waste reuse 5,000
Total mass flow (t/a) 5,111,000 5,105,000 6,000
Mass in stock (t/a) 6,000
Percentage mass flow out 99.9%
% Food and agricultural waste recycled 75.9%
As shown in Table 2 above, 75.9% of the total food waste is recycled mainly to animal feed, biomass and composting
(Ministry of Agriculture, Nature and Food Quality, 2020). Although, only 6,000 t/a of food waste mass is in stock,
meaning stored in landfill, a significant amount (~ 1,228,000 t/a combining consumers and agriculture waste) is lost
in incineration and waste to energy recovery. Incineration of food waste to energy is not considered a desirable
practice in the transition to a circular economy as the reliance and dependency on primary resources and raw
materials remains the same. There is clearly a challenge and an opportunity to reduce this volume of food waste that
is both incinerated (and the small amount landfilled) by practices of food recycling and increasing reuse in feeding
livestock for example.
(ii) Singapore
According to the National Environment Agency (NEA) of Singapore, only 18% of food waste is recycled accounting for
about 10% of the total waste generated in Singapore. The balance of the food waste is disposed at the waste-to-
energy plants for incineration (NEA 2019). The MFA for Singapore’s food waste is illustrated below in Figure 9 and
Table 3, respectively.KWR 2021.010 | January 2021 Material flow analysis & City Blueprint Framework of Singapore 20
Figure 9 Material flow of food waste in Singapore. Data retrieved from: https://www.nea.gov.sg/our-services/waste-
management/3r-programmes-and-resources/food-waste-management. (Year 2019 data)
Table 3 Material flow balance of food waste in Singapore. Data retrieved from: https://www.nea.gov.sg/our-
services/waste-management/3r-programmes-and-resources/food-waste-management. (Year 2019 data)
Food waste flow Mass flow in Mass flow out Mass flow
(t/a) (t/a) internal (t/a)
Total food and agricultural waste 744,340
Consumers food waste 744,000
Agriculture waste 340
Agricultural waste energy recovery 340
Consumers waste energy recovery 608,000
Consumers waste recycling 136,000
Total mass flow (t/a) 744,340 744,340 0
Mass in stock (t/a) 0
Percentage mass flow out 100.0%
% Food waste recycled 18.3%KWR 2021.010 | January 2021 Material flow analysis & City Blueprint Framework of Singapore 21 As shown in Table 3, about 136,000 t/a (18.3%) of the food waste flows out of the system (i.e. is recycled), the rest (608,000 t/a) is sent to the waste-to-energy plants where it is incinerated, hence not recovered. Currently, food waste is converted into useful products like compost for landscaping purposes, and several composting systems making use of worms, larvae or yeast are currently in use in Singapore. Nevertheless, a significant amount of food waste is still being incinerated, and although not considered as a mass flow in-stock (i.e. mass accumulated) this is considered very high when it comes to promoting the circular economy and the Singapore food waste management hierarchy shown in Figure 10. Figure 10 Food waste management hierarchy in Singapore (NEA, 2019). Singapore currently has a small agricultural sector and therefore generates only 340 t/a of agricultural waste. However, with Singapore’s “30 by 30” goal which aims to develop the capacity in its agri-food industry to produce 30% of the nation’s nutritional needs locally by 2030. This is likely to increase the amount of agricultural waste which could be minimised by promoting circular economy practices and opportunities in Singapore. For instance, the anticipated increase in agricultural waste can be converted into compost and charcoal. 3.3.2 Material Flow Analysis of plastic Plastic packaging is important for extending the shelf life of food and protects new products from damage during transportation. The issue with plastics is excessive packaging. The use of plastics is widespread in daily lives. For instance, grocery bags, beverage bottles and food containers are made of plastics and often used in excess and discarded in significant amounts. (i) The Netherlands In the Netherlands, there are initiatives to accelerate the transition to a circular plastic economy, where plastic remains of value and is made from recycled or renewable bio-based plastics of guaranteed quality. In order to close the plastics chain and reduce the incineration of plastics, producers, retailers and consumers need to ensure that macro and micro-plastics no longer leak into the environment. Understanding the plastics material flow is therefore important in realising this goal. The plastic mass flows and mass balance are shown below in Figure 11 and Table 4 respectively.
KWR 2021.010 | January 2021                               Material flow analysis & City Blueprint Framework of Singapore                              22

    Import =       2,060,000 t/a                                     dStock =        307,000 t/a                           Export =   1,753,000 t/a
                                 Other (incl. export)
                                      155,000 t/a
                                                                                Incineration    1,253,000 t/a           1,318,000 t/a

                                                                                                                 Energy recovery

                Virgin (fossil
               raw materials)                                            7,000 t/a                 Landfill

                   1,700,000 t/a
                                            Total plastic            300,000 t/a
                                             consumed                                              Leakage
               Bio-based
                        20,000 t/a                                   285,000 t/a

                                 Mechanically
                                  recycled          280,000 t/a

               Waste import                             Mechanical Recycling                   Incineration
                        60,000 t/a                                                                  65,000 t/a

Figure 11 Material flow of plastics in the Netherlands. The data source is from the Transition Agenda – Circular
Economy 2018 report (https://hollandcircularhotspot.nl/wp-content/uploads/2018/06/TRANSITION-AGENDA-
PLASTICS_EN.pdf). (Year 2016 data).

Table 4 Material flow balance of plastics in the Netherlands.
                                                                           Mass internal
                                      Mass flow in Mass flow out           distribution
Plastic flow                             (t/a)         (t/a)                   (t/a)
Total raw plastic generated               1,720,000
Virgin (fossil raw materials)             1,700,000
Bio-based                                     20,000
Waste import                                  60,000
Mechanically recycling                      280,000

Total plastic consumed                    2,060,000
Disposal                                  1,700,000
Sorting for recycling                       874,000
No sorting                                  826,000
Exported product                                               155,000
Mechanically recycling                                         280,000
Energy recovery (incineration)                               1,318,000

Landfill                                                                              7,000
Leakage                                                                           300,000
Total mass flow                           2,060,000          1,753,000            307,000
Mass in stock (t/a)                               307,000

Percentage mass flow out                           85.1%
% Plastics recycled and
exported                                           21.1%
KWR 2021.010 | January 2021 Material flow analysis & City Blueprint Framework of Singapore 23
As listed in Table 4, presently only around 280,000 t/a of plastic is recycled in the Netherlands, while the total plastic
consumed is around 2,060,000 t/a. When comparing this total utilisation with the amount of plastic mass flow out of
1,753,000 t/a, this means that 307,000 tons will remain in use annually (i.e. in stock). In addition, it is important to
highlight that only 16% of the total mass flow of plastics is recycled, which is about 20% the mass that is currently
being sent to waste incinerators (1,318,000 t/a).
(ii) Singapore
The National Environment Agency (NEA) of Singapore reported the 2019 waste and recycling statistics. Data for
plastics mass flows were obtained from this report (NEA 2019). The plastic mass flows and mass balance for Singapore
are shown in Figure 12 and Table 5 respectively.
Import = 930,000 t/a dStock = 893,000 t/a Export = 37,000 t/a
Raw materials (plastics)
Total plastic Landfill and
893,000 t/a 930,000 t/a
consumed incineration
893,000 t/a
37,000 t/a
Mechanical Recycling
Figure 12 Material flow of plastics in Singapore. Data retrieved from NEA 2019.
Table 5 Material flow balance of plastics in Singapore (Year 2019 data).
Mass internal
Mass flow in Mass flow out distribution
Plastic flow (t/a) (t/a) (t/a)
Total raw plastic generated 893,000
Virgin (fossil raw materials) 893,000
Bio-based -
Waste import -
Mechanically recycling 37,000
Total plastic consumed 930,000
Disposal 930,000
Sorting for recycling -
No sorting -
Exported product -
Mechanically recycling 37,000
Energy recovery (incineration) -
Landfill and Incineration 893,000
Leakage -
Total mass flow 930,000 37,000 893,000
Mass in stock (t/a) 893,000
Percentage mass flow out
(through recycling) 4.0%KWR 2021.010 | January 2021 Material flow analysis & City Blueprint Framework of Singapore 24
Contrary to the plastic data from the Netherlands, Singapore’s individual data (making up the total) were not
available to compare the pathways of the plastic waste. As listed in Table 5, only 4.0% of the total raw plastic
consumed (930,000 t/a) is recycled. Singapore therefore incinerates the majority (893,000 t/a) of the plastics
consumed, although there is a push to adopt the circular economy approach through sustainable production and
design, and establishing best practices in the 3Rs (reduce, reuse and recycle).
3.3.3 Material Flow Analysis of Incinerator Bottom Ash (IBA)
(i) The Netherlands
Incinerator Bottom Ash (IBA) from municipal solid waste incineration contains important raw materials, such as
metals, that can be recovered by various treatment processes. The use of IBA fits very well in a circular economy. The
Netherlands IBA mass flows and mass balance are shown below in Figure 13 and Table 6 respectively.
Import = 1,855,000 t/a dStock = 97,000 t/a Export = 1,758,000 t/a
Air Pollution Control residues
0 t/a
1,758,000 t/a
Fly ash
99,000 t/a Ferrous metal 126,000 t/a
Non-ferrous metal concentrates Recoverable materials
Incinerator 34,000 t/a 1,758,000 t/a
Bottom Ash Treatment of
Processing and
Solid waste Incineration 1,855,000 incinerator
utilisation of
7,478,000 t/a t/a bottom ash
recoverable
and material Leftover IBA 1,598,000 t/a
materials
recovery
5,524,000
Heat Sludge suitable for landfill
42,000 t/a
Disposal in
landfill
42,000 t/a
Figure 13 Material flow of incinerator bottom ash in the Netherlands. Data on incinerator bottom ash were
obtained from the Ministry of Infrastructure and Water Management
(https://www.afvalcirculair.nl/publish/pages/172856/afvalverwerking-in-nederland-gegevens-2018-def-09-03-
2020.pdf). (Year 2018 data).KWR 2021.010 | January 2021 Material flow analysis & City Blueprint Framework of Singapore 25
Table 6 Material flow balance of incinerator bottom ash in the Netherlands.
Flow in Flow out Flow internal
Incineration mass flow
(t/a) (t/a) (t/a) %/t IBA
Solid waste incinerated 7,478,000
Fly ash 99,000
APC residues
Heat and Energy 5,524,000
Incinerated bottom ash 1,855,000 24.8%
Incinerator bottom ash 1,855,000
Bottom ash production processed 1,758,000 94.8%
Ferrous metal 126,000 6.8%
Non-ferrous metal concentrates 34,000 1.8%
Bottom ash processed leftover 1,598,000 86.1%
Bottom ash landfilled (incl. support
layer) 42,000 2.3%
Recycling of IBA 1,758,000 94.8%
Total IBA mass flow 1,855,000 1,758,000
Mass IBA in stock 97,000
(ii) Singapore
Figure 14 and Table 7 show the IBA mass flows and mass balance for Singapore.
Import = 730,000 t/a dStock = 649,700 t/a Export = 80,300 t/a
Air Pollution Control residues
36,500 t/a
80,300 t/a
Fly ash
36,500 t/a
Ferrous metal 51,100 t/a
Processing
Recoverable materials
Treatment of and utilisation
Incinerator incinerator 80,300 t/a
of recoverable
Bottom Ash bottom ash and materials
Solid waste 730,000 material recovery Non-ferrous metal concentrates
Incineration
3,000,000 t/a t/a 29,200 t/a
Sludge suitable for landfill (wet)
Disposal in
2,197,000 landfill
Heat 649,700 t/a (Semakau)
649,700 t/a
Figure 14 Material flow of incinerator bottom ash in Singapore. Source: https://www.nea.gov.sg/our-services/waste-
management/waste-statistics-and-overall-recycling. (Year 2019 data).KWR 2021.010 | January 2021 Material flow analysis & City Blueprint Framework of Singapore 26
Table 7 Material flow balance of incinerator bottom ash in Singapore (Year 2019 data).
Flow
Flow in Flow out internal
Incineration mass flow
(t/a) (t/a) (t/a) %/t IBA
Solid waste incinerated 3,000,000
Fly ash 36,500
APC residues 36,500
Heat and Energy 2,197,000
Incinerator bottom ash 730,000 24.3%
Incinerator Bottom Ash (IBA) 730,000
Ferrous metal 51,100 7.0%
Non-ferrous metal concentrates 29,200 4.0%
Sludge suitable for landfill at Semakau
(wet) 649,700 89.0%
Recycling of IBA 80,300 11.0%
Total IBA mass flow 730,000 80,300
Mass IBA in stock 649,700
The Netherlands is quite advanced when it comes to recycling of Incinerator Bottom Ash (IBA). The Netherlands
recycles 95% of its IBA while Singapore is recycling 11%. Both countries are recovering metals and construction
material. In the Netherlands, most of the bottom ash is processed after separation from ferrous metals. The non-
ferrous metals are used as construction material often applied in large projects since the efficient demands and
supply logistics in larger projects permit the viable application of these materials. Although IBA recycling in the
Netherlands is high, it is currently only used as a secondary construction material in situations where there is no risk
of leaching into the soil or groundwater. There are serious questions raised about the control of toxicity in public
works, and as such future research should consider the environmental and public health related to the application of
IBA in public works, roads and other uses. Consequently, there is a need to ensure that hazardous substances do not
leak out of concrete of other building materials containing bottom ash.
It is expected that by 2035, Singapore’s one and only landfill, on Semakau Island, will run out of space and that
alternative approaches to manage the country’s waste are necessary. The use of incinerator bottom ash instead of
sand and stone has been investigated with the creation of NEWSand (materials generated from IBA recycling) and is
planned to become a reality in the coming years. As such, there is potential to recycle more IBA in Singapore to
minimise the amount that is sent to the landfill. Clearly both the Netherlands and Singapore can learn from each
other on how to further improve the management and recycling of IBA.
3.3.4 Material Flow Analysis in the water cycle
An attempt to develop an MFA in the water cycle was also made based on the data available both in the Netherlands
and Singapore. Conducting the analysis over the entire water cycle offers a complete overview of the flows of
materials and water both in the drinking water and wastewater sector.
(i) The Netherlands
In the Netherlands, water data for the various modules of the entire water cycle are available. Figure 15 below
illustrates the various components contributing to the water and material flows. The water flow and material mass
balances are shown in Table 8. The various materials in and out of the water cycle are available in the Netherlands to
follow the pathway of what is recovered and in what form. The Netherlands do not recycle a lot of wastewater as
the demand is not there yet. On the other hand, several resources are recovered from the sludge. Increasingly sludge
is being dealt with a more holistic view particularly in relation to the potential of recovering resources, namely biogas,
struvite, cellulose and sand.KWR 2021.010 | January 2021 Material flow analysis & City Blueprint Framework of Singapore 27
Import (W) = 1,247 GL/a dStock (W) = 1,225 GL/a Materials in Export (W) = 22 GL/a
Import (M) = 1,850,811 t/a dStock (M) = 1,391,638 t/a 67,215 t/a 1,068 GL/a Export (M) = 459,173 t/a
(incl. metal salts and Discharge
polymers)
1,000 GL/a Domestic
Agriculture
Production industry 1,090 GL/a
Wastewater Reuse
Sewer system Treatment
Raw water Servicing business 22 GL/a
2,247 GL/a
1,247 GL/a Potable water Administration 1,170 GL/a Resource recovery and residuals
Materials in treatment and
Digested sludge 569330 t/a
supply
(Chemicals and metal salts added) Biogas 228677 t/a
114,670 t/a Undigested sludge 724615 t/a
Materials (incl. metal Wastewater Struvite 863 t/a
sludge and calcium 41 GL/a Cellulose 5000 t/a
pellets) in sludge Losses Losses Sand 15741 t/a
208,892 t/a
77 GL/a 80 GL/a
Figure 15 Material flow in the water cycle in the Netherlands. Data retrieved from KWR BTO 2020 report (https://library.kwrwater.nl/publication/61558390/)KWR 2021.010 | January 2021 Material flow analysis & City Blueprint Framework of Singapore 28
Table 8 Material and water flow balances in the water cycle in the Netherlands. (Year 2018 data).
Netherlands data for the Water Cycle
Water flow (GL/a) Materials flow (t/a)
Water cycle Flow Flow
Flow in Flow out internal Flow in Flow out internal
(GL/a) (GL/a) (GL/a) (t/a) (t/a) (t/a)
Raw water 2,247
Agriculture 1,000
Potable water treatment 1,247
Wastewater from production 41
Losses in potable water network 77
Potable water supply 1,129
Domestic 565
Production Industry 339
Servicing business 113
Administration 113
Sewer system 1,170
Sewer water loss 80
Wastewater Treatment 1,090
Water reuse 22
Discharge 1,068
Total potable water flow in (GL/a) 1,247
Total water flow recycled (GL/a) 22
Flow in stock (GL/a) 1,225
% Recycled 1.7%
Materials (solids) in raw potable
water 124,700
Chemicals (incl. metal salts added to
potable water production 114,670
Materials (incl. Metal sludge and
calcium pellets) in sludge recovered
from potable water production 208,892
Materials stored in potable water
production 30,478
Materials (incl. metal salts and
polymers) added for wastewater
treatment 67,215
Sludge from wastewater treatment 1,544,226
Digested sludge 569,330
Biogas production 228,677
Undigested sludge 724,615
Struvite 863
Cellulose 5,000
Sand 15,741
Total materials (t/a) 1,850,811
Total materials recycled (t/a) 459,173
Flow in stock (t/a) 1,391,638
% Recycled 25%
Biogas production from WWTP 115,222,000 m3/a
(ii) Singapore
In Singapore, water data for the various modules of the entire water cycle were not fully available. Data on the water
use and recycling were available while data on the materials and their flows in the water cycle were not available.
Figure 16 below illustrates the various components contributing to the water flows. The water flow and water mass
balances are shown in Table 9.You can also read