NETHERLANDS INTEGRAL CIRCULAR ECONOMY REPORT 2021 - English Summary Aldert Hanemaaijer and Maikel Kishna, Hester Brink, Julia Koch, Anne Gerdien ...
←
→
Page content transcription
If your browser does not render page correctly, please read the page content below
NETHERLANDS INTEGRAL CIRCULAR
ECONOMY REPORT 2021

English Summary

Aldert Hanemaaijer and Maikel Kishna, Hester Brink, Julia
Koch, Anne Gerdien Prins and Trudy Rood

January 2021
This report has been produced in the context of the Work Programme on Monitoring and
Evaluation C ircular Economy 2019–2023. This programme is a collaboration, under
supervision of PBL Netherlands Environmental Assessment Agency, between:

    •   C opernicus Institute of Sustainable Development (Utrecht University)
    •   C PB Netherlands Bureau for Economic Policy Analysis (C PB)
    •   Institute of Environmental Sciences (C ML, Leiden University)
    •   National Institute for Public Health and the Environment (RIVM)
    •   Netherlands Enterprise Agency (RVO.nl)
    •   Netherlands Organisation for Applied Scientific Research (TNO)
    •   Rijkswaterstaat (Government Service for Roads and Waterways)
    •   Statistics Netherlands (C BS)

The Dutch Government aims to achieve a fully circular economy by 2050. The purpose of the
Work Programme is to monitor and evaluate the progress made towards that objective and
to provide the necessary knowledge for an informed policy process. For more information on
this Work Programme, please see www.pbl.nl/en.

2
Netherlands Integral Circular Economy Report 2021. English summary © PBL Netherlands Environmental Assessment Agency The Hague, 2021 PBL publication number: 4228 Contact circulaire_economie@pbl.nl Authors Aldert Hanemaaijer and Maikel Kishna (project management), Hester Brink, Julia Koch, Anne Gerdien Prins and Trudy Rood Programme secretary Marjon Kooke Supervisor Frank Dietz Graphics PBL Beeldredactie Production coordination PBL Publishers This publication can be downloaded from: www.pbl.nl/en. Parts of this publication may be reproduced, providing the source is stated, in the form Hanemaaijer, A. et al. (2021), Netherlands Integral C ircular Economy Report 2021, English summary. PBL Netherlands Environmental Assessment Agency, The Hague. An English translation of the Dutch full report is expected to be published later this year. PBL Netherlands Environmental Assessment Agency is the national institute for strategic policy analysis in the fields of the environment, nature and spatial planning. We contribute to improving the quality of political and administrative decision-making by conducting outlook studies, analyses and evaluations in which an integrated approach is considered paramount. Policy relevance is the prime concern in all of our studies. We conduct solicited and unsolicited research that is both independent and scientifically sound. 3
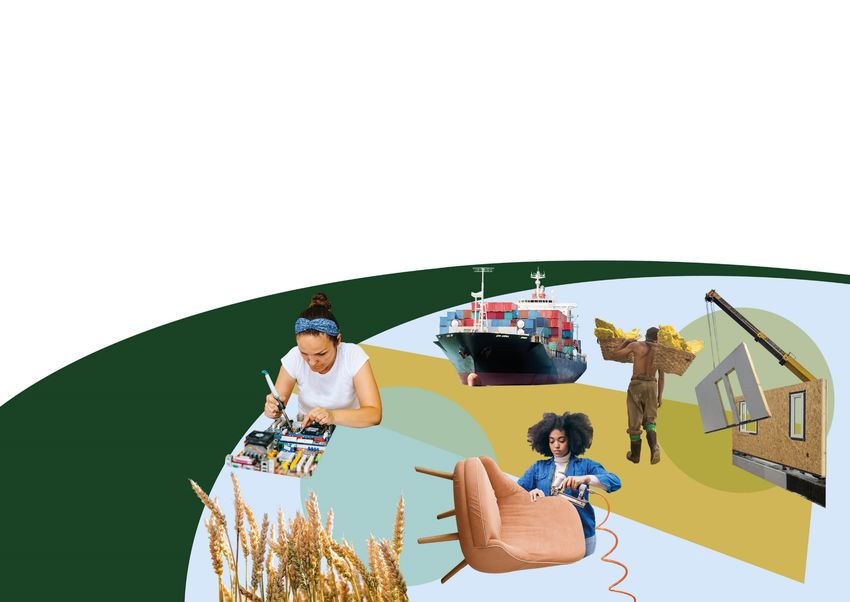
Main messages
The importance of a circular economy
Many of today’s nature- and environment-related problems can be traced back to the
wasteful use of natural resources. This leads to pollutants being emitted to air, water and
soil, which in turn have undesirable effects such as plastic soup in the sea, ecosystem
degradation from mining, large mountains of waste and loss of biodiversity, among other
things, due to monocultural farming and nitrogen deposition. These problems will become
more pressing in the coming decades, due to the increase in global demand and utilisation of
material resources (e.g. minerals, metals, fossil fuels, biomass). The increasing use of such
resources and the interdependencies in the long international production chains will also
increase the risks for supply and price volatility. Considerably more efficient use of the
available material resources — using them more often and more intensively and increasing
their lifespan — generally reduces the environmental problems and will improve security of
supply.

Several trends for material resource use not moving in the right direction
Looking at how material resources are being used in the Netherlands and the effects related
to this use, we found that various trends are going in the wrong direction. Although it is true
that resource efficiency has increased, this has not led to a sharp reduction in the use of raw
materials. Since 2010, the total use has hardly changed in the Netherlands. Moreover, Dutch
consumption also requires more and more land in the production chain. In addition, the
amount of landfilled waste has increased since 2014, 6 of the 7 overall national targets for
waste are not expected to be achieved, and the supply risks for the Dutch economy have
also increased. Manufacturers are running the largest supply risks because of their
dependence on rare earth metals, cobalt, tungsten, tantalum, tin and indium. These critical
metals are used, for example, in machines, in vehicle parts and electronics, and are
important for the energy transition.

Together with other parties, the Dutch Government has created a basis and
structure for achieving a circular economy in the Netherlands.
In recent years, the transition towards a circular economy has been on the agenda of
government authorities, businesses, citizens, NGOs and knowledge institutes in the
Netherlands. The Dutch Cabinet’s ambition to achieve a circular economy by 2050 has since
been included in the Dutch Raw Materials Agreement co-signed by over 400 parties and
elaborated in 5 transition agendas for the priority themes of Biomass and Food, Construction,
Plastics, Manufacturing and Consumer Goods. Cabinet has indicated which clusters of policy
instruments it intends to use to accelerate the circular economy transition. These clusters
include legislation and regulations, market incentives, monitoring, knowledge and innovation,
and producer responsibility. In doing so, a basis and structure has been created for the
transition towards a circular economy with a public-private approach.

For many years, recycling and repair have already been part of the Dutch economy
which, for the most part, still functions rather linearly.
The number of companies focusing on circular activities is increasing. In recent years,
substantial financial resources have been used in circular activities or innovations in various
support instruments of the national government, such as the R&D tax credit (Wet
Bevordering Speur- en Ontwikkelingswerk (WBSO)) and the Arbitrary depreciation of
environmental investments (Regeling Willekeurige afschrijving milieu-investeringen (Vamil)).
However, the number of companies using a 'circularity strategy' has grown less rapidly than
the total number of companies in the Dutch economy. In addition, the vast majority of these

4
so-called circular companies are focusing on repair, recycling and reuse. This type of activity
already existed before there was any talk of a transition towards a circular economy.
Examples include garages, waste collection facilities and thrift shops. Most innovative circular
companies and circular projects are mainly technological and focus on recycling. There is less
attention for innovations that could radically change the use of material resources. As a
result, the economy still functions largely according to linear principles. This does not alter
the fact that, throughout society, there are experiments and entrepreneurs focused on
circular product designs, alternative revenue models and online platforms. These show that
radically different methods of production and consumption are possible — as, for example, in
the case of Auping's fully recyclable mattresses, LENA the fashion library's clothing and
Camptoo's online platform for motorhomes.

More attention needed for socio-economic renewal in combination with conversion
and phasing out of existing system
Recycling is an essential part of any circular economy. But recycling alone is not enough to
realise the transition towards such an economy. Making production and consumption chains
circular requires, for example, new circular business models, online platforms and changes in
consumer behaviour. At their core, these are socio-economic innovations for which, to date,
there has been little attention from either society or government. This also requires
adjustments to or conversion of existing institutions, such as accounting regulations that
hinder product-as-a-service companies. In addition to the development of circular production
and consumption processes, the transition calls for the phasing out of linear chains and of
products with a very short lifespan that place a relatively heavy burden on nature and the
environment. Such phasing out could be achieved, for example, by increasing environmental
taxes over time or by issuing a ban on disposable products.

The Netherlands, as one of the front runners, has an interest in EU circular
economy policy
The Netherlands recycles 80% of its waste. This makes it one of the front runners in Europe,
although it should be noted that this 80% often involves low-grade recycling. The use of raw
materials for Dutch consumption is also a fifth lower than the EU average. EU circular
economy policy is of great importance for the Netherlands, when it comes to taking further
steps towards a circular economy. Setting requirements for the use of material resources in
product design or the prevention of harmful substances in products particularly requires an
EU approach. And if the EU elaborates its plans for producer responsibility and requirements
for product design and repair, this will ensure a more level playing field between Member
States. The Netherlands would benefit more than average from this, because of its very open
economy and ambitious waste policy of recent decades, which has recently been further
developed into a circular economy policy.

Stronger policy is needed to realise ambitions
National policy, to date, has mainly focused on the formation of a broad coalition of
stakeholders within society and on facilitating circular initiatives — for example, by
promoting knowledge development and bringing parties together on the basis of voluntary
agreements such as the Concrete Agreement Netherlands and the Plastics Pact NL. This fits
in with the initial phase of circular economy policy. However, voluntary and non-committal
approaches will ultimately be insufficient to meet Cabinet’s firm ambition to switch to a fully
circular economy by 2050. We make the following recommendations for achieving the
transition towards a circular economy:

1. Ensure that environmental damage is factored into the prices of products and services and
that legislation and regulations no longer cause disadvantages for circular initiatives
compared to the already established linear practices. For example, new raw materials,

5
currently, are cheaper than recyclates, and buyers are wary of circular products for which no
quality standards have been set.

2. Make more use of coercive measures in circular economy policy, such as taxation and
regulation, including standardisation. Important in this respect is the awareness that
elaboration and implementation of regulating or guiding economic and legal instruments
often take a long time, as shown by the long history of the introduction of a deposit refund
system for small bottles. It is therefore important to start the process early.

3. Implement stepwise increases in the circularity requirements used in government
purchasing and procurement, including those in the context of producer responsibility.
Examples include a minimum recycling rate that is subsequently adjusted upwards, over
time, and setting preconditions on purchasing and procurement that go beyond recycling. In
this way, the quality of recyclates and high-quality reuse of material resources become
benchmarks for designing production processes.

4. Develop an elaborated vision on the circular economy that is widely supported by
companies and civil society organisations, and turn this vision into concrete goals. These
goals can differ per transition theme, chain or product group, which calls for a differentiated
approach. At the end of 2020, the national government started to develop such differentiated
goals.

5. Ensure a clear division of roles between the various stakeholder involved in the
implementation of circular economy policy. For example, what are the responsibilities and
powers of the various transition teams and what is the role of the national government in
these teams? These questions are currently being debated.

Circular economy is relevant to several societal objectives
A circular economy is about making far more efficient use of all the material resources
available in the economy, both abiotic (minerals, metals and fossil raw materials) and bio-
based resources (biomass and food), and contributes to several goals, such as combating
climate change, halting biodiversity loss caused, among other things, by nitrogen deposits
and plastic soup in the sea, and reducing supply risks. Currently, Dutch policy on the circular
economy falls under climate policy in the Coalition Agreement of the 3rd Rutte Cabinet
(2017–2021). Rather remarkably, the budget includes hardly any additional resources with
respect to the circular economy. In addition to the fact that a circular economy could
contribute substantially to CO2 emission reductions, a more efficient use of material
resources would also help to address other societal challenges.

A circular economy requires a cabinet-wide approach
A Cabinet-wide approach is important for a policy that promotes the circular economy. After
all, such policy would cover various production chains, sectors and spatial scales, from
agriculture to product design and from global to local levels. In addition to climate policy, for
example, this includes policies aimed at improving the security of supply of material
resources, green fiscal reform, making international trade more sustainable, promoting
environmentally friendly innovations, aligning educational standards with circular production
processes, and actively encouraging circular purchasing and procurement. Finally, a circular
economy requires different rules that would balance safety, health, environment, economy
and innovation. All this is not a matter for one ministry, but requires a cabinet-wide coherent
approach in which each ministry has its own role to play. Although several ministries are
currently involved in the circular economy policy, their individual packages of policy
instruments are not all focused on achieving a more circular economy.

6
Findings
Dutch C abinet intends to achieve a fully circular economy by 2050. It has asked PBL to
report on the progress that is being made in this respect, in cooperation with other
knowledge institutes. This request has resulted in this first integral circular economy report
(IC ER). It presents the state of affairs of the transition towards a circular economy in the
Netherlands and describes potential starting points and next steps with which this transition
could be achieved. This biennial report provides insight into the trends in material resource
use and related environmental and socio-economic effects. The report also describes current
activities within society, as well as the government's interventions that promote the
transition towards a circular economy.

The importance of switching to a circular economy

Industrial processes convert natural resources into materials (steel, concrete, plastics) and
finished and semi-finished products, which are used in consumption processes and eventually
end up in waste streams. All these phases produce emissions to air, water and soil, resulting
in undesirable effects such as plastic soup in the sea, accelerated climate change, large
mountains of waste and loss of biodiversity due to nitrogen deposition, open mining and
monoculture farming, just to name a few. (IRP, 2019; OEC D, 2019).

Without additional policy, this pressure on nature and the environment will continue to
increase over the coming decades. The OEC D (2019) and the International Resource Panel
(2019) expect the use of raw materials to double by 2060, compared to 2017 levels,
particularly due to the growing global population and the amount of consumption per world
citizen. Under a scenario in which historical trends continue, and taking into account climate
policies such as those applied up to 2015, greenhouse gas emissions are expected to
increase by 49%, by 2060, compared to 2010 (IIASA, 2018; McC ollum et al., 2018; Rao et
al., 2017). The increasing demand for food and biomass is also projected to lead to an
expansion of the agricultural area. This will be at the expense of natural ecosystems, such as
forests and other habitats (Popp et al., 2017; IIASA, 2018; IRP, 2019), in turn leading to
biodiversity loss and a further acceleration of climate change.

These nature and environmental problems would decrease if material resources would be
used considerably more efficiently. This increased efficiency could consist of repairing
products more often to extend their lifespan, rejecting certain types of products, improving
both product design and production processes so that fewer raw materials are needed,
people sharing things so that fewer products need to be produced, and reusing materials to
reduce the amount of waste and reduce the demand for new raw materials. These forms of
circular production and consumption, in principle, would reduce the demand for materials
and thus also reduce the processing of material resources. The resulting decrease in
environmental pressure would be more in keeping with the carrying capacity of the planet.

Although, for now, material resource use is likely to continue to increase, we will not
immediately run out of most of the raw materials used. However, the supply risks of certain
material resources will increase. This is of particular concern in the case of critical materials
— those that are both economically important and have major supply risks — which include
rare earth metals, cobalt, tungsten, tantalum, tin and indium. C ritical materials are crucial,

7
for example, in producing electronic devices and generating sustainable energy, such as wind
turbines and solar panels. In recent years, there has been a growing concern among
companies and policymakers about the security of supply of specific material resources and
the economic vulnerability of long international supply chains. C onsiderably more efficient
use of the available material resources, in principle, would reduce such vulnerability,
although this may be not the only solution strategy to follow.

C ompared to the current practice of incremental efficiency improvements in the use of
material resources, a circular economy means a radically more efficient use of those
materials. This is not an end in itself, but a means to achieve the underlying goals of
reducing the pressure on the environment and nature associated with resource use and
reducing the supply risks of raw materials.

At the core of a circular economy

Circularity strategies for a more efficient use of material resources
In essence, a circular economy uses as few material resources as possible and generates as
little waste as possible. It is aimed at the optimal use and reuse of such resources, materials
and finished and semi-finished products; which means applying them with the highest value
for the economy while causing the least damage to the environment (Rood and Hanemaaijer,
2017).

A significantly more efficient use of material resources can be achieved through various
circularity strategies, or ‘R-strategies’. These strategies include rejecting certain products or
using them more intensively by sharing them with others (refuse & rethink), manufacturing
products more efficiently (reduce), reusing products (reuse) and repairing them (repair &
remanufacture) to extend their lifespan, reusing materials (recycle) so that less waste is
generated and fewer new material resources are needed, and recovering energy from
materials (recover).

The R-strategies can be combined to form a circularity ladder (‘R-ladder’). For several years
now, PBL has been using such a ladder with six circular strategies and this was also used for
this report (Figure 1). As a rule of thumb, a strategy that is higher up the ladder (and
therefore has a lower number), generally, requires fewer material resources or processing
steps and therefore causes less environmental pressure. The R-strategies at the top of the
ladder (refuse & rethink; reduce) decrease the total use of material resources (narrowing the
loop). Those halfway down the ladder (reuse & remanufacturing; repair) postpone the
demand for new material resources (slowing the loop). Finally, recycling is aimed at closing
the cycle of materials (closing the loop). All R-strategies are needed to achieve a circular
economy.

8
The rationale for this report

In 2018, the Dutch C abinet explicitly requested an integral report on the circular economy
(IC ER) (IenW, 2018). It did so from the conviction that the transition towards a circular
economy requires changes throughout society. To enable a more radically efficient use of
material resources in the long term, production techniques need to change, requiring new
product designs and production methods, as well as different legislation and regulations, tax
reforms and new ways of consuming (IenM and EZK, 2016). These coherent and
fundamental changes are what the national government refers to as 'the transition towards a
circular economy'. (IenW et al., 2019).

The integral circular economy reports (IC ER) are to provide the knowledge base for
government policy to achieve the transition towards a circular economy. The government
intends to realise a fully circular economy in the Netherlands by 2050 and, as an
intermediate goal, to halve the use of primary abiotic raw materials by 2030 (IenM and EZK,
2016). On the way to achieving these goals, the government is committed to the more
efficient use of material resources, increased use of renewable raw materials and new ways
of producing and consuming that are appropriate in a circular economy.

PBL has been asked 'to further develop the monitoring system, together with other
knowledge institutes, to achieve a fully fledged measurement and control system. The
purpose of this system is to monitor government policy and the efforts of parties in society,
and to provide insight into the progress made on achieving the circular objectives, to
determine whether policy adjustments are necessary' (IenW, 2019). In order to fulfil this role
of analyst and manager of knowledge development, PBL will be publishing an integral report
on the circular economy (IC ER) every two years, with the help of other knowledge institutes.

9
Purpose and set-up of this report

The aim of the Integral C ircular Economy Report (IC ER, 2021) is to present the state of
affairs of the transition towards a circular economy in the Netherlands and to make
recommendations for achieving said transition. Much of the required knowledge is generated
from the Work Programme Monitoring and Steering C ircular Economy 2019–2023 (PBL,
2019; 2020), which PBL is implementing in collaboration with the following knowledge
institutes: Statistics Netherlands (C BS), Leiden University's Institute of Environmental
Sciences (C ML), C PB Netherlands Bureau for Economic Policy Analysis, Utrecht University's
C opernicus Institute of Sustainable Development, the National Institute for Public Health and
the Environment (RIVM), the Netherlands Enterprise Agency (RVO.nl), Rijkswaterstaat (the
Dutch Government’s service for roads and waterways (RWS)), and the Netherlands
Organisation for Applied Scientific Research (TNO). For more information on the organisation
and results of this Work Programme, see https://www.pbl.nl/monitoring-circulaire-economie.

This report is part of the cycle of circular economic policy in the Netherlands. This report
aims to bring together the best available knowledge on material resource use, activities and
policy to accelerate the circular economy in the Netherlands. In this way, the Integral
C ircular Economy Report will be providing input for consultations between the parties
involved in the Dutch Raw Materials Agreement and the five transition teams, as well as
offering support for choices to be made on circular economy policy and the debate on these
choices in the Dutch House of Representatives.

The Integral Circular Economy Report considers material resource use, its effects
and the transition process
The first proposal for monitoring the Dutch transition towards a circular economy by PBL,
C BS and RIVM indicates that this requires two elements (Potting et al., 2018). The Integral
C ircular Economy Report further elaborates on this proposal.

The first element is to provide insight into trends in material resource use and the related
impact on nature and the environment as well as on socio-economic processes. Material
resource use refers to the amounts of raw materials needed for production and consumption
in the Netherlands, and involves insights into the use phase of products, the amount of
waste generated and waste treatment processes. Determining the related effects on the
environment and nature requires knowledge about, for example, climate change, loss of
biodiversity and the presence of toxic substances. Relevant socio-economic effects include
the supply risks of materials and the labour market effects of structural changes in the
economy as more circular production and consumption become leading. This report is
integral in the sense that its scope includes the total use of raw materials in the Netherlands
and the related impact. This includes both bio-based resources (biomass and food) and
abiotic raw materials (minerals, such as sand and gravel, and metal and fossil resources,
such as oil, natural gas and coal). Another integral aspect of the report is that it also looks at
relevant global and European developments with respect to material resource flows, stocks
and uses. After all, the use of material resources in production and consumption processes in
the Netherlands cannot be seen in isolation from the international chains within which
products are both used and produced.

The second element of the Integral C ircular Economy Report concerns the monitoring of the
transition process and describes the activities, means and interventions by social parties and
government authorities in the transition towards a circular economy. Think of pilot projects,
subsidy measures for circular innovations and removing obstructive legislation on waste. The
transition towards a circular economy is a lengthy process, evokes resistance and is hindered
by behaviour, regulations and interests, as a result of which the effects of more circular

10
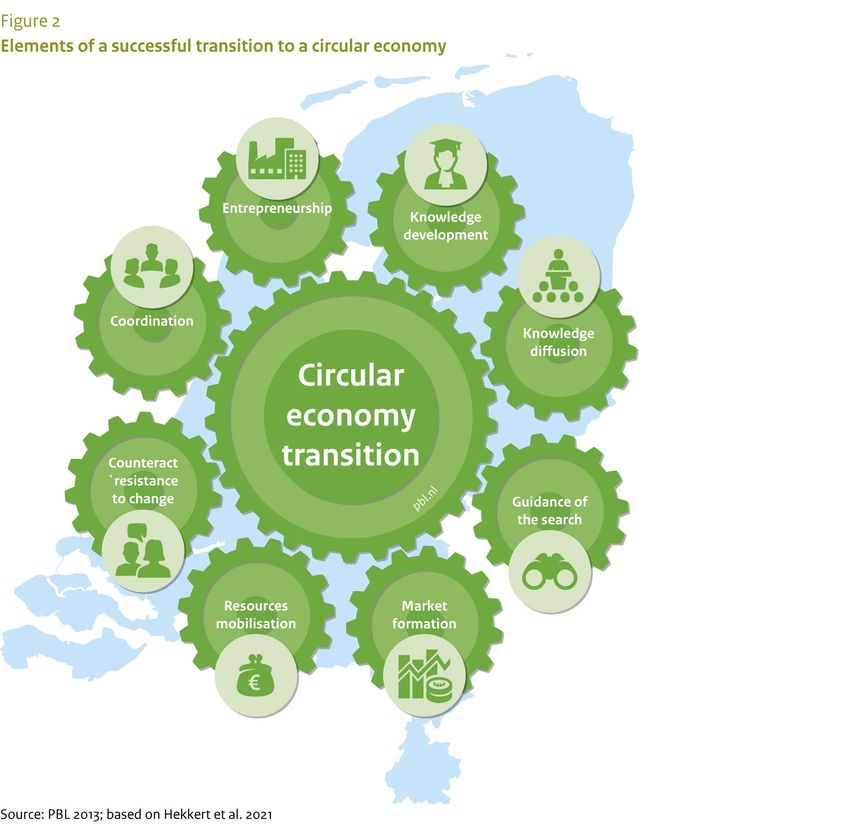
production and consumption will only become visible in due course. This does not alter the
fact that a variety of social parties are already making efforts to make their production and
consumption processes more circular. Because the transition process precedes its result,
knowledge about the process is indispensable in order to be able to assess, at an early stage,
whether the desired effects of more circular production and consumption can be expected in
the long term and — if this is not the case or effects lag behind — what the causes may be.
C hanges, for example, in the behaviour of companies and consumers or in official regulations
(EU, national government, regional government authorities) provide information about the
direction of the circular economy and the pace at which it is currently taking shape.

The knowledge base for the circular economy is being constructed
The knowledge base for the circular economy is still under development. Although this report
contains the best available, scientifically sound knowledge and the most recent data, this
does not preclude further improvements. In the coming years, it is expected that changes in
methods, more and better data and new scientific insights will lead to an increasingly better
understanding of material resource use and its effects, as well as of the processes that
should bring the transition towards a circular economy within reach.

This first Integral C ircular Economy Report largely has an inventorying and indicative
character. In this way, the report provides insight for accelerating the transition. Although
the ambition for this report is to provide an integral picture, the knowledge about a circular
economy is still being developed, at least partially, and therefore not yet complete. For
example, there is still only limited insight into the effects of possible measures taken by
companies to produce more circularly. This is part of the reason why this report evaluates
only to a certain extent. However, it does contain conclusions on trends in the use of
material resources, on specific developments in society that promote or hinder a more
circular economy, and on policy interventions that aim to promote the transition towards a
circular economy. The Integral C ircular Economy Report also identifies a number of
possibilities for adjusting social change processes that can bring a circular economy closer
within reach.

Progress on the transition process in the Netherlands

Monitoring the transition process in order to make timely adjustments
Process monitoring enables timely adjustments in the transition towards a circular economy,
even before its effects can be registered. However, such monitoring is complex. Businesses,
government authorities, citizens, knowledge institutes, networks and NGOs all play a role in
the transition, without any of these parties dominating the others. In addition, the transition
is not only about new technology, but also about other rules of the game (institutions) and
new products, services and knowledge, such as products-as-a-service and online platforms.
Finally, the transition towards a circular economy is actually a collection of change processes.
This transition covers everything from plant-based proteins in food, to chemical recycling of
plastics and appliances-as-a-service. Per theme, the transition process can vary in rate of
change and solution direction. In order to monitor this complex whole, this report builds on
two long-standing perspectives or frameworks: those of the innovation ecosystem (Hekkert
et al., 2007; 2020) and those of transition management (Loorbach, 2007). Figure 2 and Text
box 1 describe the elements that were combined in this report, which focuses on the national
level, but where possible also shows insights derived from specific themes.

11
The perspective on the transition towards a circular economy

The transition combines processes that create circular production and consumption with
those that transform or phase out linear production and consumption. The transition goes
through several phases, each with dominant dynamics — often presented in a so-called X-
curve (Bode et al., 2019). The framework for transition monitoring in this report focuses on
various key functions that are crucial to the transition pathway. The cogs in Figure 2 show
the various key functions. They are linked to actions that parties can take to speed up the
change process and provide direct starting points for monitoring.

This report’s monitoring approach looks at various key processes that are crucial for the
development and rollout of circular innovations and for the phase-out and transformation of
existing linear systems. Think, for example, of entrepreneurs experimenting with circular
products, developing and exchanging knowledge, changes in legislation and regulations that
remove obstacles to more circular production and consumption, breaking resistance (by
creating legitimacy and increasing the pressure to change on the existing linear system) and
the coordinating role of government (Figure 2).

12
A great deal of attention for the transition towards a circular economy
In the Netherlands, there is relatively much attention for the circular economy. C ompanies,
research and educational institutions, citizens, regional government authorities and other
parties undertake a variety of actions aimed at circularity. Although this report does not
show how far the transition has progressed for all relevant sectors and product chains in the
Netherlands, it does provide an overall picture of the efforts made by stakeholders within
society. For example, there are more than 100,000 circular companies (i.e. those that apply
one or more of the R-strategies in practice (RHDHV, 2020a)). And, in 2019, over 100
conferences on the circular economy were organised (RHDHV, 2020b). At several companies,
for example from the textile sector and various branches of the manufacturing industry, the
theme of circular economy has been put on the strategic agenda.

Growth can be seen in various elements that are important for a successful transition (Figure
2). For example, the number of circular companies has increased by approximately 8% in
the past two years (RHDHV, 2020a). The number of scientific publications on circular
economy worldwide has increased from approximately 70 in 2014 to over 1,600 in 2019
(Türkeli, 2020). Since mid 2018, there have been increasing numbers of national and
regional initiatives aimed at circular procurement, such as the Green Deal C ircular
Procurement 2.0, the Green Deal Biobased, the academy for circular procurement and over
200 pilot projects for climate-neutral and circular procurement (Zijp et al., 2020).
Educational programmes and courses on the circular economy have also increased in the
Netherlands. Almost half of the institutes of higher vocational education (HBO) and 80% of
universities are paying attention to circularity in their curricula (RVO.nl, 2021).

Circular is not 'the new normal' yet
In spite of all these activities and deployment of resources, circularity is still far from
mainstream. C ircular companies make up only 6% of companies in the Netherlands (RHDHV,
2020a). The vast majority of circular companies already existed before the Dutch circular
economy policy was implemented. Think of traditional businesses such as garages, waste
collection facilities and bicycle repair shops. Furthermore, a small part of the budget of
various policy instruments goes towards circular projects (RVO.nl, 2020). For example, the
R&D tax credit (WBSO) supports companies by means of a tax deduction on employers' wage
tax. Of the WBSO budget, 3.2% goes to circular economy projects. C onsumer attitudes and
behaviour also make it clear that the transition towards a circular economy is still in an early
stage. Less than 40% of Dutch consumers is open to purchasing products that have been
refurbished, and less than 15% to long-term leasing and borrowing via sharing platforms
(ABN AMRO, 2018; Kantar, 2019).

Many actions and resources are focused on recycling
Much research and innovation is in line with the current system. For example, the majority
(66%) of the 1,900 innovative circular companies in the Netherlands focuses on recycling
(RHDHV, 2020a). Over half of Dutch scientific articles mention recycling (or recover) in their
subject description, but none of the other circularity strategies (Türkeli, 2020). Many of the
innovation projects supported by RVO.nl's instruments also have a technological character
and focus on recycling. For example, 60% of projects from the MIT Scheme (SME Innovation
Promoting Region and Top sectors) focus on recycling, two thirds of which are bio-based
projects, and 90% of projects from the public-private partnership allowance focus on
secondary raw materials (RVO.nl, 2020). Recycling is a crucial and indispensable part of a
circular economy, where many technological challenges still lie ahead. Nevertheless,
recycling has been an established and successful industry in the Netherlands for years.

13
High-grade recycling is a point of attention
The success of the Dutch recycling industry results from decades of waste policy with a
strong focus on reducing waste volumes and minimising the amount of landfill. However, a
circular economy also requires the application of high-grade recyclate, which means that
plastic from bottles is more often reused to make new bottles and not immediately
downcycled and processed, for instance, into recycled plastic bollards, and that demolition
waste in construction is reused in new housing instead of being used as subgrade in road
construction. It is, therefore, important to pay attention to high-grade recycling.

Little attention for socio-economic reform and phasing out of the existing system
Taking significant steps in making production and consumption chains circular, requires
circularity strategies that are higher up the R-ladder than recycling. This involves, for
example, rejecting products or using products more intensively, such as by sharing them
(‘narrowing the loop’). In addition, it is also about extending the lifespan of products, for
example through second-hand use, repair, remanufacturing or modular design (‘slowing the
loop’).

Such strategies require new circular business models, the organisation of sharing platforms
and a change in consumer behaviour. At their core, these are socio-economic reforms for
which little attention has yet been paid by either society or government. This also requires
adjustments or conversions of existing institutions, such as existing accounting rules that
hinder product-as-a-service companies if the assets on their balance sheet (e.g. the washing
machines that are leased out) and slow cash flow (rental income) are seen by financiers as
an increase in risk compared to the traditional sales model.

In addition to the development of innovative strategies, the transition also requires that
attention is paid to the phasing out of linear chains and products that have a very short
lifespan and a relatively high impact on nature and the environment. Means to achieve this,
for example, include increasing environmental taxes over time and a ban on disposable
products, as is already the case for free plastic bags. However, there is currently no broad,
fundamental change from the existing linear system to a circular economy.

Transition is still in its initial phase
Overall, these signs indicate that the transition towards a circular economy is still in its initial
phase. Although growth can be seen in certain areas, it cannot be concluded that the
transition towards a circular economy is spreading across all sections of society and/or is
accelerating to any substantial degree. There are also, as yet, few signs that the existing
linear system is coming under pressure. This pressure is necessary if the government is to
realise its ambition to accelerate and scale up the transition towards a circular economy
(IenW, 2019). In Box 2, we examine the difficult question of how to recognise the start of
the next phase in this transition.

Indications of the next phase in the transition

There is no instruction manual for what is needed to reach the next phase of the transition
towards a circular economy. However, there are signs that would indicate whether the
transition is moving into the next phase.

Larger scale innovation is such a sign, with existing circular activities connecting and being
scaled up, and a critical mass of those involved is being created. Also consider the
emergence of a larger market demand for several types of innovative circular products and
services. Such processes of acceleration, scale-ups and connections form a prelude to a
phase of institutionalisation, i.e. accepting and establishing new official and unofficial rules of

14
play that are in line with more circular production and consumption.

Another sign of the arrival of the subsequent phase is that of an elaborated vision on and
direction of the transition. Such a vision not only relates to the desired developments but
particularly also to those elements of the system that no longer fit within a circular economy.
This creates a sense of urgency and pressure for change on the part of established parties. It
may shake up the current system and create space for the targeted adaptation and phasing
out of existing linear practices.

At the same time, the established interests may feel increasingly threatened and develop a
resistance towards more circular production and consumption. Increasing resistance may be
a prelude to fundamental changes in production and consumption processes that are or will
be taking place on a large scale, and is therefore also an important indication that the next
phase has been reached.

Trends in Dutch material resource use and its impact

Measuring the use of material resources and their effects
In order to provide insight into the degree of circularity of an economy, indicators are needed
to show the development in the use of material resources and the related impact. These
indicators cover both the input of materials, their use in finished and semi-finished products,
and the output of materials in the form of waste. But the indicators must also provide insight
into the effects that a circular economy aims to achieve, namely the reduction in various
forms of environmental pressure and the improvement of the security of supply of crucial
materials and finished and semi-finished products (Figure 3).

Below, the main trends in the use of material resources and their impact are discussed. Table
1 provides the most up-to-date overview of indicators that are important for a circular
economy. These trends and related effects are discussed in more detail, further along the
text.

15
The Netherlands is one of the front runners in Europe
With its 80% waste recycling rate, the Netherlands is one of the front runners in Europe,
mainly because its waste policy has been strongly focused on recycling for decades. In
addition, the Netherlands uses fewer material resources for consumption, compared to other
European countries. These resources are therefore used more efficiently in the Dutch
economy. In this respect, the Netherlands benefits from its high population density, which
means that the large quantities of raw materials needed for infrastructure (e.g. roads,
railroad embankments, pipelines) are used relatively efficiently. In addition, the Netherlands
has a service economy that adds much value using relatively few material resources.

Because the Netherlands is already one of Europe’s recycling front runners, its circular
objective differs from that of most other European countries. In Italy and Eastern Europe, for
example, substantial progress can still be achieved by reducing landfill and increasing
recycling. For the Netherlands, the main challenge is that of applying high-grade quality
recyclate in new products and to focus on other circularity strategies, such as reuse, design,
refurbishing, sharing, and repair.

16
Table 1 Overview of material resource use and its impact
     Indicator                                                                          Magnitude                           Trend                 Compared
                                                                                                                                                  with EU-27
                                                                                        2010        2016        2018        2010–       2016–     per capita in
                                                                                                                            2018        2018      2018
     Natural resources required
     Material resources for domestic use, DMC1 (Mt)                                     195         193         195         0%          1%        -22%
     Material resource footprint domestic use, RMC 2 (Mt)**                             -           -           -           -           -         -
     Resource efficiency (GDP in EUR/kilo DMC)                                          3           4           4           12%         5%        +125%
     Material resources for the economy, DMI3 (Mt)                                      401         402         397         -1%         -1%       +95%
     Material resource footprint of the economy, RMI4 (Mt)                              597         627         647         8%          3%        +89% (2017)
     Share bio-based resources (kilo/DMI, in %)                                         24          25          26          8%          5%        +5%
     Total sustainable renewable material resources (kilo/DMI)                          -           -           -           -           -         -
     Share secondary materials, CMUR (kilo secondary/DMI, in %)                         -           13          14          -           6%        +167% (2017)
     Use phase
     Lifespan                                                                           -           -           -           -           -         -
     Value retention                                                                    -           -           -           -           -         -
     Waste processing and recovering
     Dutch waste (Mt)                                                                   60          60          61          2%          2%        +44% (2016)
     Share recycled waste in processed waste (recycled waste/waste, in %)               81 (2012)   79 (2012)   80          -1%*        +1%       +31%
     Recycled waste in the Netherlands (Mt)                                             54 (2012)   52          53          -1%*        3%        +111% (2016)
     Incinerated waste in the Netherlands (Mt)                                          10 (2012)   10          11          11%*        6%        +74% (2016)
     Waste disposal in the Netherlands (Mt)                                             2           3           3           51%         14%       -81% (2016)
     Effects
     Environmental impact
     National greenhouse gas emissions (MtCO2 eq)                                       214         195         188         -12%       -4%        +33%
     Greenhouse gas emission footprint of consumption (MtCO2 eq)                        300         252         282         -6%        12%        +35% (2015)
     Greenhouse gas emission footprint of production (MtCO2 eq)                         462         432         -           -7% (2016) -          +54% (2015)
     Emissions to air, water and soil, such as nitrogen and particulate matter          -           -           -           -           -         -
     Land-use footprint of consumption (million ha)                                     10          -           10 (2017)   3% (2017)   -         -15% (2015)
     Land-use footprint of production (million ha)                                      11          12 (2015)   -           9% (2015)   -         -28% (2015)
     Water abstraction                                                                  -           -           -           -           -         -
     Water footprint consumption (km3)                                                  52 (2008)   -           -           -           -         +21% (2008)
     Biodiversity footprint of consumption (million MSA loss ha/year)                   19          -           -           -           -         +1% (2010)
     Biodiversity footprint of production (million MSA loss ha/year)                    20          -           -           -           -         +2% (2010)
     Toxicity                                                                           -           -           -           -           -         -
     Socio-eco nomic impact
     Supply risks (indicator being developed)                                           -           -           -           -           -         -
     Added value of circular activities (EUR billion)                                   28          31          34          23%         9%        -
     Share circular activities (added value circular / GDP in %)                        4           4           4           1%          0%        -
     Circular employment (no. of circular jobs in FTEs) (*1,000)                        311         318         326         5%          2%        -
     Share circular employment (no. of jobs/total no. of jobs in %)                     4           4           4           -2%         -2%       -

 _______________________________________________________________________
Legend

 Tre nds                                                      Co mpared with EU-2 7                        De via ting ye a rs are provide d betwe e n brackets
     tre nd is moving in the right directio n                    NL scores bette r tha n EU                * 2 012–2018, no data ava ilable for 2010
     tre nd is moving in the wrong dire ctio n                   NL scores worse tha n EU                  ** RMC require s a new calculatio n
     tre nd is sta ble; hardly a ny diffe rences (up to 5%)      ha rdly a ny diffe rences (up to 5%)      - No data availa ble
 1
   Do mestic Materia l Consumption
 2
   Ra w Ma te rial Consumptio n
 3
   Do mestic Materia l input
 4
   Ra w Ma te rial Input

17
Various trends are not moving towards a circular economy Looking at the entire use of material resources in the Netherlands and the related effects, various trends are not going in the right direction. It is true that, in the Netherlands, resources are used more efficiently than before, but this has not led to a sharp, absolute reduction in use. The total use of material resources in the Netherlands has hardly changed since 2010, with respect to both domestic consumption and the economy as a whole (see Table 1). This does not mean that the policy of promoting more circular production and consumption is failing. After all, the government-wide programme was not started until in 2016 and major shifts cannot be expected to be visible this soon. However, the transition towards a circular economy does require a reversal of these trends. Dutch economy requires many more material resources than are needed for Dutch consumption In 2018, the Dutch economy used nearly 450 Mt in material resources and, in addition, over 140 Mt in transshipment (see Figure 4). These numbers include raw materials as well as parts and products. Over two thirds of these resources are imported. Almost half of all the material resources used in the Netherlands is for domestic use; the other half is exported. This shows that the Dutch economy requires far more materials than are need for domestic use. 18
The amount of material resources used in the Dutch economy is more or less
constant
The total use of material resources in the Netherlands has hardly changed since 2010, with
respect to both domestic consumption and the economy as a whole. However, the amount of
abiotic resources (i.e. minerals, metals and fossil raw materials) has declined, by 0.5% to
1%, annually. Resource efficiency has increased by 12% since 2010, but this improvement
has not led to a significant change in the use of these materials in the economy. The material
resource footprint of the Dutch economy increased by 8%, between 2010 and 2018 (see
Table 1). This footprint also includes the resources used in the production processes of
materials, parts and products abroad.

More recycling will not substantially increase the share of secondary resources
In 2018, secondary materials made up 14% of the total use of material resources in the
Dutch economy. Over the 2016–2018 period, this share increased from 13% to 14%. As
much as 80% of the waste is already being recycled. More recycling will therefore only be a
limited contribution to further increasing the share of secondary resources. In addition,
challenges in the housing sector and the energy transition will require more material
resources in the coming years. This increase in demand cannot be met using secondary
resources alone. However, gains can still be achieved through a higher quality use of
available secondary resources (to which better recycling techniques also contribute).
C urrently, a large part of the collected plastics is either burned or processed into bollards
instead of being turned into new bottles, and not many of the discarded textiles are being
reused to make clothing.

Many general national waste targets will not be achieved
There are many targets related to waste, on both EU and national levels. The Netherlands is
achieving most of the EU waste targets and has set additional further-reaching targets for
many of its domestic waste streams. However, six of the seven national waste targets of the
National Waste Management Plan will not be achieved. These targets relate to the amount of
Dutch waste, the total of which is within the target range of no more than 61 Mt by 2023.

However, in order to achieve the target of 85% recycling by 2023, additional efforts are
likely needed. Various other waste targets will almost certainly not be achieved. For
example, the amount of household waste is still 200 kilograms above the target of 400
kilograms per inhabitant by 2020, and the amount of residual waste is even 80% above the
target of 100 kilograms per inhabitant by 2020. Furthermore, also the target of halving the
amount of waste in incineration and landfill by 2022 is not expected to be achieved. Although
the percentage of the household waste that is sorted has increased in recent years (61% in
2018) after years of remaining stable, it is still a long way from the 2020 target of 75%.
Furthermore, the amount of residual waste from companies, organisations and government
authorities in 2018 was still twice the amount targeted for 2022.

More progress has been made on specific waste streams. The targets for waste from
construction and demolition and that for various packaging materials have been achieved,
while other targets are within reach. Only in the case of food waste has there, as yet, been
no progress on the desired halving by 2030.

Impact of Dutch use of material resources
The impacts on nature and the environment from material resource use in the Netherlands,
to a large extent, take place in certain parts of the production chain outside the Netherlands,
especially in Europe, but also in other parts of the world. Nature and environmental effects
include greenhouse gases and loss of biodiversity due to land-use change, nitrogen
deposition and mining. In order to reduce the environmental impact of Dutch material
resource use, it is therefore essential to consider the effects of the entire production chain.
Between 2010 and 2016, there was a slight decrease in the footprints of greenhouse gas

19
emissions for both production and consumption. Land use for the Dutch economy (i.e. the
production footprint) increased by 9% between 2010 and 2015 (see Table 1). This concerns
mainly land use outside the Netherlands related to imported products, rather than land use
within the Netherlands.

Dutch material resource use leads to both positive and negative socio-economic
developments abroad. Employment in the exporting country is one of the positive effects.
Negative effects also occur regularly, in the form of poor working conditions, child labour and
human rights violations. This happens, for instance, in the mining industry and the
production of cacao, coffee, palm oil and soya beans. In order to provide a detailed picture of
these effects, it is crucial that companies are transparent about their work processes and
their product information.

Supply risks mainly affect the manufacturing industry and are increasing
In the Netherlands, supply risks mainly relate to manufacturing, particularly because many
companies depend on rare earth metals, cobalt, tungsten, tantalum, tin and indium. These
are the so-called critical metals, because their supply carries the relatively high risk of
disruption and because they are of great economic importance. They are used, for example,
in machines, machine parts for certain modes of transportation and in electronics. C ertain
sectors are particularly dependent on them, such as the electronics industry, electrical
appliance industry, transport manufacturing industry, the sector ‘other industry’, metal
products and the equipment manufacturing industry. Since 2012, the supply risks for the
Dutch economy have increased.

Supply risks are expected to increase further, as a result of the energy transition in the
Netherlands. Achieving the energy transition will require an unprecedented acceleration of
the increase in the annual production levels of many materials. Some critical metals, such as
rare earth metals, silver, cobalt and iridium, are crucial in the production of solar panels,
green hydrogen and batteries for electric vehicles. C urrent global production of a number of
critical metals is insufficient to produce all the products needed for the desired energy
transition, both for the Netherlands and for other countries. This applies in particular to the
envisaged sustainable electrification. Added to this is the fact that the production capacity
cannot rapidly be expanded — as opening a new mine, for example, would take at least 10
years.

Information about material resources and products facilitates their reuse
Many material resources are used in products that have a long lifespan, such as buildings,
machinery and motorised vehicles. The materials stored in such products are also called
stocks for future use or urban mines. In order to be able to reuse products and materials, it
is crucial to have more information about the quality of secondary materials, second-hand
parts and products. Good insight is needed into their amounts and location, as well as into
the time at which they would become available for high-grade reuse, both now and in the
future.

If companies and government authorities would have more and better data on the use of
material resources, it would become easier to reuse materials, parts and products. At the
moment, there is no such overview. First steps are currently being taken under the
responsibility of the national government to create the Dutch Raw Materials Information
System (GRIS). The development of this system will take a fair amount of time. In addition
to the lack of a system that systematically maps material resource flows and stocks, there is
also a lack of systematic information about higher circularity strategies, such as sharing,
reuse, repair and refurbishing.

20
Circular economy policy in the Netherlands

The Netherlands has an interest in circular economy policy on an EU level
In order to take further steps towards a circular economy in the Netherlands, EU policy is of
great importance. This applies particularly to those areas where the EU has far-reaching
powers, such as in trade, product and waste policies. Setting requirements for the use of raw
materials in the design or repairability of products or concerning the presence of harmful
substances in products particularly requires an EU approach. The European Union is also
working on expanding producer responsibility, whereby producers remain responsible for
what happens to their products after they are discarded by consumers. An EU approach
would create a more level playing field for the Member States. This is to the benefit of the
Netherlands, more so than is the case for other Member States, because the Netherlands has
been pursuing an ambitious waste policy for decades and, more recently, a circular economy.
As various Dutch companies have already developed innovative products and services, this
can strengthen their competitive position on global markets.

The Dutch Government, in cooperation with other parties, has created a structure
and basis on which a circular economy can be achieved
The circular economy is prominent on the agenda of government authorities, companies and
civil society organisations. The Dutch Government's ambition to achieve a circular economy
has now been endorsed by more than 400 parties under the Raw Materials Agreement. One
of the things they agreed on is that teams of representatives from businesses, national
government, government authorities, NGOs and scientific institutions have drawn up
agendas for five priority transition themes: Biomass and food, C onstruction, Plastics,
Manufacturing and C onsumer Goods. Since 2018, C abinet has concentrated policy efforts in
10 intersecting clusters of policy instruments. In doing so, it aims to accelerate the transition
towards a circular economy. These clusters are: (1) producer responsibility, (2) legislation
and regulations, (3) circular design, (4) circular purchasing, (5) market incentives, (6)
financing instruments, (7) monitoring, knowledge and innovation, (8) behaviour and
communication, education and the labour market, (9) international commitment and (10)
Versnellingshuis Nederland Circulair (organisation to accelerate the Dutch circular economy).

The C ircular Economy Implementation Programme 2019–2023 (IenW et al., 2019) elaborates
on these intersecting clusters of instruments and includes concrete actions and projects for
the five priority transition themes. The Netherlands has a public–private approach to the
transition towards a circular economy, and focuses on 5 priority transition themes (societal
domains) and 10 clusters of policy instruments. This policy approach, together with social
stakeholders, has created a good basis for initiating the transition towards a circular
economy.

The transition themes cover most of the environmental impacts
The five transition themes cover most waste flows, the use of material resources, land use
and the loss of biodiversity. The transition themes are less focused on greenhouse gas
emissions; together, they cover 35% of greenhouse gas emissions in the Netherlands, 42%
of the greenhouse gas footprint of consumption and 56% of the greenhouse gas footprint of
production. This reason for this lesser focus is that a significant proportion of greenhouse gas
emissions originate from refineries, energy supply and transport. These sectors are not
directly included in the priority transition themes. In contrast, however, these subjects are
given ample attention in the energy transition and in climate policy. Distinguishing what does
and does not fall under the priority transition themes is relevant, but calls for certain
assumptions. For example, not all sectors clearly fall under a particular transition theme.

21
You can also read