Cost Benefit Analysis Amendments to the Renewable Transport Fuel Obligations Order - Moving Britain Ahead - Legislation.gov.uk
←
→
Page content transcription
If your browser does not render page correctly, please read the page content below
Cost Benefit Analysis
Amendments to the Renewable
Transport Fuel Obligations Order

Moving Britain Ahead

September 17
The Department for Transport has actively considered the needs of blind and partially sighted people in accessing this document. The text will be made available in full on the Department’s website. The text may be freely downloaded and translated by individuals or organisations for conversion into other accessible formats. If you have other needs in this regard please contact the Department. Department for Transport Great Minster House 33 Horseferry Road London SW1P 4DR Telephone 0300 330 3000 General enquiries https://forms.dft.gov.uk Website www.gov.uk/dft Crown copyright 2017 Copyright in the typographical arrangement rests with the Crown. You may re-use this information (not including logos or third-party material) free of charge in any format or medium, under the terms of the Open Government Licence v3.0. To view this licence visit http://www.nationalarchives.gov.uk/doc/open-government- licence/version/3 or write to the Information Policy Team, The National Archives, Kew, London TW9 4DU, or e-mail: psi@nationalarchives.gsi.gov.uk. Where we have identified any third-party copyright information you will need to obtain permission from the copyright holders concerned.
Contents

1. Executive summary                                                       4
2. Problem under consideration and rationale for intervention              7
3. Policy                                                                  8
  Policy options considered for consultation                               8
  Policy changes which are reflected in this cost benefit analysis         9
4. Analytical approach, evidence, uncertainties and sensitivities          12
  Analytical approach                                                      12
  Evidence and assumptions                                                 15
  Key uncertainties and sensitivity analysis                               15
5. Impacts of the policy on fuels supplied and GHG emissions               20
  Baseline fuel supply                                                     20
  Fuel supply under the policy                                             21
  Sensitivity analysis                                                     25
6. Costs and benefits of the policy                                        29
  Summary of costs and benefits                                            29
  i - Quantified impacts                                                   30
  ii - Non-quantified impacts                                              31
7. Appendices                                                              33
  Appendix 1 - Details of analytical evidence and assumptions              33
  Appendix 2 - Share of renewable fuels supplied by volume and by energy   52
  Appendix 3 - Total volumes of renewable fuels supplied                   53
  Appendix 4 - NPVs sensitivity analysis scenarios                         54
  Appendix 5 - Summary of consultation responses                           59

                                        3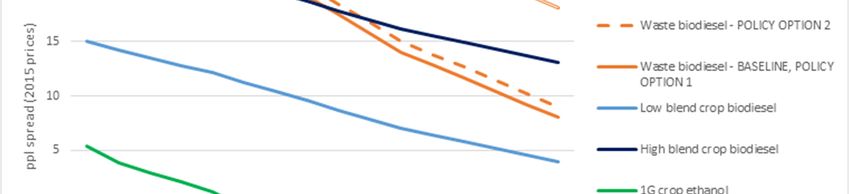
1. Executive summary

        1.1 Following the recent consultation on the future of the Renewable Transport Fuel
            Obligation, the resulting policy is illustrated in detail in the Government
            Response. For the purposes of this Cost Benefit Analysis, we focus on the
            policy changes with the highest expected impacts, namely the increase in the
            RTFO obligation, the level of the crop cap and the level of the development fuel
            sub-target. To illustrate the expected impacts of these, we compare the central
            policy scenario to a do-nothing baseline.
        1.2 To ensure long-term carbon savings, investor certainty and a link to carbon
            budgets, new RTFO obligation levels will be set from 2018 to 2032 and the
            costs and benefits are estimated for this time period. Increasing the RTFO
            obligation for this period contributes the UK's Carbon Budgets 3 to 5 (2018-
            2032) and ensures compliance with the EU Renewable Energy Directive and
            makes significant contributions to Fuel Quality Directive compliance.

        Table 1: summary of options consulted on

                                       sub-target                      Approach to crop-based renewable
                                                                       fuels (% total fuel volume)
         Option 1                      Broad definition                Increase use of crops (up to 7%)
         Option 2                      Fuel-specific                   Maintain current crop use (up to 2%)
         (preferred)
         Option 3                      Fuel-specific                   Phase out crop use (0%)

        1.3 The final policy is an amended version of Option 2 with a fuel specific
            development sub-target and a revised limit to crop-derived fuels. To estimate
            the impacts of the policy for this CBA, we have developed a central scenario of
            the fuels we consider most likely to be delivered under the new policy. Later in
            the CBA, we show sensitivity analysis of how these impacts may vary. The
            proposed measures are expected to add slightly to fuel pump prices, though
            any increase is more than offset by improvements in vehicle efficiency in recent
            years, which has been supported by government regulations1. The total cost in
            2020 is estimated to be £351m (0.9ppl). This cost estimate is driven by the
            expected price spreads between fossil fuels and renewable fuels in global
            markets. However, as these cost projections are inherently uncertain,
            alternative market price scenarios have been modelled which provide a wider
            range of cost estimates (0.3 to 1.9 pence per litre (ppl) or £127m to £725m in
            total, in 2020).

1
  We estimate that the average petrol car on the road is around 8% more fuel efficient in 2016 than the average in 2009. Given petrol
prices around 110ppl at the pump this fuel saving reduces driving costs by the equivalent of 9ppl.

                                                                   4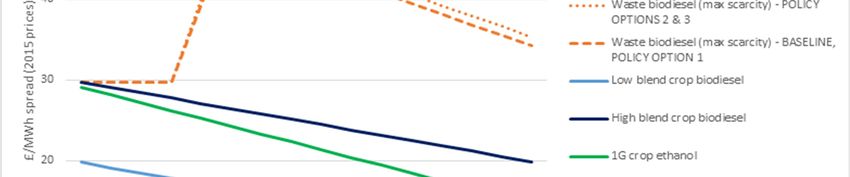
1.4 We expect that the development sub-target will support the development of a
         new industry supplying advanced transport fuels and playing an important role
         in decarbonising road transport in the longer term. The overall obligation also
         maintains a market for current suppliers of the most sustainable fuels, the waste
         biodiesel industry, and existing UK ethanol producers.
     1.5 There is an absolute increase in the demand for biofuels, which will contribute
         to meeting ambitious carbon budgets and will also ensure stable demand for
         renewable suppliers while the demand for fossil fuels is expected to decline.
         Currently, the majority of biofuels used in the UK are also processed in the UK
         and we estimate that this adds at least £60 million per year to the UK economy
         (net value added). We would expect the proposed policy to increase this
         contribution and estimates are included in table 3 below under "Present value
         benefits".

     Table 2: 2020 pump price impact, carbon abatement cost, renewable energy

                                  2020
                                  Pump
                                  price                   Total
Costs are              2020       impact    Additional    pump       2020                              TWh
additional to          Cost       minus     VAT           price      Crop                 Abatement    renewable
baseline in            impact,    VAT,      revenues,     impact,    share     GHG        cost ¹       Energy
2020, 2015             £m         ppl       ppl           ppl        (% by     savings¹   (£/TCO2e)    (incl.
prices                 (range)    (range)   (range)       (range)    volume)   (MTCO2e)   in 2020      baseline)
                       351        0.72      0.18          0.9
                       (127-      (0.24-    (0.06 –       (0.3 –     1.7%                 123          23.1
Central                725)       1.52)     0.38)         1.9)       (0-4%)    2.8        (44-256)

Option 2               366        0.72      0.18          0.9
for                    (143-      (0.24-    (0.06 –       (0.3 –     2%                   137          22.5
comparison             729)       1.52)     0.38)         1.9)       (0-2%)    2.7        (53-273)

      Table 3: summary of present value estimates (2018-2032):
                                                         Average
                                                         abatement                                      Net
Additional      Total                       Present      cost                                           present
to              additional       Present    value        present                                        value
baseline,       carbon           value      costs        value¹        Present value   Net present      (£m)
2015            savings¹         benefits   estimate     (£/TCO2e)     costs (£m)      value (£m)       central
prices          (MTCO2e)         (£m)       (£m)         2018-32       range           range            estimate

Central         52               3567       4276         119           1534 to 9313    2033 to -5746    -709
Option 2        33.6             2303       3107         95            1213 to 6313    1090 to -4011    -804

     1.6 The central net present value estimates are negative, since we expect the cost
         of renewable fuels to exceed the value of the carbon saved plus the net value
         added to the UK economy. This holds true under BEIS's central and low non-
         traded carbon value projections. When we use BEIS's high carbon value
         projections for sensitivity analysis, the NPVs are positive. NPVs are also
         positive if we apply carbon budget methodology instead of lifecycle carbon
         accounting.

                                                               5
1.7 The central scenario assumes high levels of waste availability. It also assumes
             that E102 will be introduced and will make up 40% of retailed petrol with 60%
             remaining E5. Sensitivity analysis was carried out to show impacts for "noE10"
             and "HighE10". It is important to note that the high crop cap in the early years
             allows a much higher uptake of crop derived fuels than we have in the central
             scenario, and especially crop biodiesel. We have also undertaken a sensitivity
             to show impacts for high crop biodiesel uptake.
         1.8 Table 3 above shows the expected impacts over the duration of the policy. The
             range of net present value estimates is based on three different long-term price
             scenarios (driven by global markets).

         Chart 1: summary of renewable fuels supplied over the duration of the policy,
         central scenario

2
    A blend of petrol and ethanol with up to 10% ethanol.

                                                            6
2. Problem under consideration and
   rationale for intervention

  2.1 The Climate Change Act set a target of an 80% reduction in greenhouse gas
      emissions by 2050 compared to 1990 levels. As around one quarter of UK
      carbon emissions are from transport, decarbonisation of the transport sector is
      vital to achieving this long term goal. Renewable fuels are expected to have an
      important role to play in delivering this long-term decarbonisation. Despite
      increased uptake of electric vehicles, a significant share of road vehicles and
      virtually all planes and ships are expected to still use liquid or gaseous fuels
      well into the 2030s, showing the need for further low-carbon options and for a
      strategy beyond meeting the 2020 targets. Advanced renewable fuels could be
      key to this long-term decarbonisation, as they may provide a means to
      decarbonise heavy goods vehicles (HGVs), ships and aircraft, where
      electrification is difficult or impractical, few alternatives to liquid or gaseous fuels
      are available and increased supply of first generation biofuels is either
      unavailable or unsustainable.
  2.2 Currently, UK fuel suppliers are obligated to provide 4.75% (by volume) of road
      transport fuel from renewable sources, under the Renewable Transport Fuel
      Obligation (RTFO). However, this falls short of what is required to meet carbon
      budgets and also falls short of the Renewable Energy Directive's transport sub-
      target, which requires 10% of road transport fuel by energy to be from
      renewable sources in 2020.
  2.3 Current supply of renewable fuels under the RTFO is 3.3% by volume (4.75% if
      you include double reward of waste derived fuels) and 2.6% by energy (4% with
      double rewarding.

                                            7
3. Policy

  3.1 The consultation put forward three policy options and we still refer to those
      options for comparison in this CBA. To quantify the impacts of the final policy,
      we compare estimated impacts against a 'Do-nothing' baseline, which assumes
      the RTFO remains as it is with an obligation level of 4.75% by volume, with
      double rewarding of waste-derived fuels, no sub-target for development fuels
      and no crop cap. The policy options were partly informed by the requirements of
      meeting the Renewable Energy Directive in 2020 as well as the requirements of
      carbon budgets. The baseline is not considered as a viable policy option
      because it does not ensure compliance with carbon budgets or with the
      minimum requirements of the RED.

  Policy options considered for consultation
  3.2 The three policy options all required an increased uptake of biofuels, however
      they put a different emphasis on the source and the sustainability of those
      biofuels. A brief summary of what differed between policy options is in Table 4
      below.

  Table 4: summary of differences between options

                       sub-target             Approach to crop-based renewable
                                              fuels (% total fuel volume)
   Option 1            Broad definition       Increase use of crops (up to 7%)
   Option 2            Fuel-specific          Maintain current crop use (up to 2%)
   (preferred)
   Option 3            Fuel-specific          Phase out crop use (0%)

  3.3 All policy options incorporated the following aspects:
     a. Increase obligation to 2020
     b. Continue obligation to 2030
     c. Introduce development fuel sub-target
     d. Set a cap on crop-derived renewable fuels
     e. Introduce a number of operational amendments

                                          8
Policy changes which are reflected in this cost benefit analysis
        1) Increase the obligation level and continue obligation to 2032
        3.4 Currently the RTFO requires obligated suppliers to blend 4.75% of renewable
            fuels by volume into fossil petrol and diesel. Waste-derived fuels count twice
            towards this obligation. The proposed obligation level for 2020 is 9.75% by
            volume, which will contribute to meeting the third Carbon Budget (2018-2022). It
            also complies with the Renewable Energy Directive when combined with the
            1.1% of renewable electricity used in electric vehicles and trains.3 Post-
            consultation, we have decided to increase the obligation level further post-2020
            as below, while still awarding double certificates to waste-derived fuels.

        Table 5: Proposed obligation levels to 2032
          Obligation period                       PRE CONSULTATION                             POST CONSULTATION
                                                  Target (obligation) level, as                Target (obligation) level,
                                                  share of total liquid fuel by                as share of total liquid
                                                  volume, may include                          fuel by volume, may
                                                  double rewarding                             include double rewarding
          15.4.2017-14.4.2018                     6.00%                                        4.75%
          15.4.2018-31.12.2018*                   7.25%                                        7.25%
          2019                                    8.50%                                        8.50%
          2020                                    9.75%                                        9.75%
          2021                                    9.75%                                        10.1%
          2022                                    9.75%                                        10.4%
          2023                                    9.75%                                        10.6%
          2024                                    9.75%                                        10.8%
          2025                                    9.75%                                        11.0%
          2026                                    9.75%                                        11.2%
          2027                                    9.75%                                        11.4%
          2028                                    9.75%                                        11.6%
          2029                                    9.75%                                        11.8%
          2030                                    9.75%                                        12.0%
          2031                                    9.75%                                        12.2%
          2032                                    9.75%                                        12.4%
        *note 2018 is a short obligation period so that we can switch to a calendar year from 2019.

3
  The renewable portion of electricity used in rail and road transport can be counted towards the RED transport sub-target, with
multipliers of 2.5x and 5x respectively. The proportion of electricity that is renewable has been assumed at the RED accounting default
of 30%. The net result is that 1.1% of the 10% transport sub-target is met through renewable electricity in transport.

                                                                   9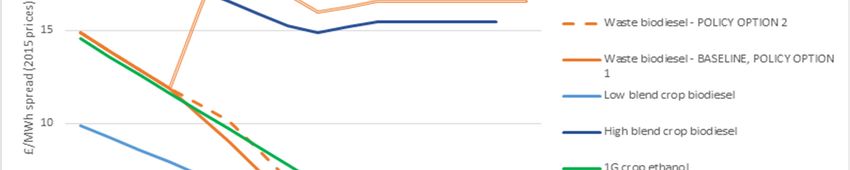
2) Introduce a sub-target for particular 'development' fuels
3.5 To take advantage of the commercial opportunities and environmental benefits
    of advanced renewable fuels we propose the introduction of a 'development
    fuels sub-target' to incentivise the production of new, more sustainable
    advanced fuels from waste feedstocks. We have decided to focus this sub-
    target on specific fuels that are most consistent with the UK’s long term
    strategic needs, namely those suited for aviation and road freight where
    electrification options are most limited. In addition we seek to incentivise fuels
    that broaden the base of waste feedstocks beyond those currently processed.
    To give industry time to ramp up supply, the proposal is to require 0.05% of
    fuels (by volume) to come from 'development' fuels in 2019, increasing
    gradually to 1.4% in 2032. There will be separate certificates awarded for
    development fuels under the RTFO, dRTFCs. These will be used to meet the
    development fuels sub-target, or alternatively can be used to meet the main
    obligation. The development sub-target will have its own buy-out price, which
    will be set at 80 pence per certificate (up to £1.60 per litre of fuel).

Table 6: the volume requirements of the development fuels sub-target are:
Obligation period      PRE                   POST                  Resultant
                       CONSULTATION          CONSULTATION          "development"
                       Sub target            Sub target            renewable fuel
                       (obligation) level,   (obligation) level,   supply
                       includes double       includes double       as proportion of
                       rewarding             rewarding             total fuel supply
                                                                   (by volume)*
15.4.2017-             0.1%
14.4.2018
15.4.2018-             0.2%
31.12.2018*
2019                   0.3%                    0.1%                 0.05%
2020                   0.4%                    0.15%                0.075%
2021                   0.6%                    0.5%                 0.25%
2022                   0.8%                    0.8%                 0.4%
2023                   1%                      1%                   0.5%
2024                   1.2%                    1.2%                 0.6%
2025                   1.4%                    1.4%                 0.7%
2026                   1.6%                    1.6%                 0.8%
2027                   1.8%                    1.8%                 0.9%
2028                   2%                      2%                   1%
2029                   2.2%                    2.2%                 1.1%
2030                   2.4%                    2.4%                 1.2%
2031                   2.4%                    2.6%                 1.3%
2032                   2.4%                    2.8%                 1.4%
Post-2032              2.4%                    Review obligation
                                               in line with Carbon
                                               Budget 6
* As development fuels will be eligible for double reward, the resultant development
fuel supply is calculated as half of the sub-target. However, the actual development

                                       10
fuel supply may be lower where gaseous fuels are supplied under the sub-target (as
these will attract more than two RTFCs per kg).
3) Limit crop-derived renewable fuels
3.6 To ensure that an increase in the RTFO obligation leads to the use of
sustainable fuels, we are capping the amount of crop-derived fuels that can be
awarded RTFCs. The cap is intended to reduce the risk of additional carbon
emissions from Indirect Land Use Change (ILUC), which can occur in the
production of crop-based biofuels. We are putting in place a declining crop cap:
Table 7: maximum share of crop derived fuels (by volume)
Maximum share of crop derived
fuels rewarded RTFCs (volume)
2018 4.00%
2019 4.00%
2020 4.00%
2021 3.83%
2022 3.67%
2023 3.50%
2024 3.33%
2025 3.17%
2026 3.00%
2027 2.83%
2028 2.67%
2029 2.50%
2030 2.33%
2031 2.17%
2032 2.00%
3.7 The CBA does not estimate the costs or benefits associated with operational
changes to the RTFO, beyond the impacts of the development sub-target, the
increased obligation and the limit to crop-derived fuels.
114. Analytical approach, evidence,
uncertainties and sensitivities
Analytical approach
Estimating changes in fuel use, resource cost and carbon savings
4.1 The impacts of policy amendments are estimated in four steps:
1 Determine the volume of different fuels supplied under the baseline
2 Quantify the expected change in fuels used relative to the baseline once the new
policy has been implemented (i.e. less fossil, more renewable, and a changing
share of feedstocks)
3 Based on this change, estimate carbon saved/emitted through the increased use
of renewable fuels (benefit estimate) and change in resource cost (cost estimate).
In addition, we have estimated net value added to the UK economy as a benefit
4 Use cost and benefit estimates to generate a range of net present value estimates
4.2 The flow chart below shows the four steps and highlights where there is
considerable uncertainty around key inputs:
Demand uncertainty is low
(dieselisation, total demand)
1) Baseline - expected fuel use in
do-nothing scenario Market price uncertainty is high
addressed through low/central/high
resource cost scenarios
2) Projected change in fuel use As above plus additional uncertainty
under policy scenario associated with fuel uptake and
impact of policy on market prices
As above plus additional uncertainty
3) Projected change in resource cost
and carbon emissions around quantification and valuation
of carbon benefits
4) Net Present Value estimates
124.3 To estimate the quantity of different renewable fuels supplied under the
baseline and new policy (steps 1 and 2), we assume that fuel suppliers meet
the obligation at least cost subject to certain constraints. The estimated supply
of fuels under the baseline and new policy is based on assumptions about
overall demand for road transport fuel, the petrol/diesel split, blending limits and
projections of the relative costs of supplying different types of fuel.
4.4 The calculation of fuel costs and carbon benefits for the central scenario (step
3) draws on the estimated fuels supplied, estimated in steps 1 and 2. To
estimate the costs we combine the estimated fuels supplied under the baseline
and new policy with estimates of the resource cost differential between
renewable fuels and fossil fuels.4 (This uses resource cost estimates in £/MWh,
to account for the different energy density of different fuels.)
4.5 To estimate the benefits of each option, we combine the estimated fuels
supplied under the baseline and new policy with estimates of the greenhouse
gas intensity of renewable and fossil fuels. This allows us to calculate the
change in carbon emissions relative to the baseline. We then value the changes
in emissions in each year following guidance published by BEIS.
Estimating Net Value Added to the UK economy
Estimating economic value added per litre:
4.6 We calculate an average cost of the inputs to each fuel (UCO for biodiesel,
wheat for ethanol). We then look at the corresponding price data for the outputs
(biodiesel, ethanol and the by-product "distillers grains" (DDGS), which is used
as animal feed), to calculate gross value added per litre of biofuel.
Estimating share of RTFO supply coming from UK sources:
4.7 We then estimate what share of additional biofuel feedstocks come from UK
sources. Combined with our processing assumptions, this gives us the total
additional biofuels supply processed in the UK. To calculate this, we looked at
the total of each biofuel supplied in year 7 of the RTFO, calculated the share
that came from UK sources, and developed three scenarios for sources of
additional future supply:
• Optimistic: Same proportions UK/abroad as present
• Pessimistic: All additional biofuel comes from abroad
• Central: Halfway between optimistic and pessimistic
Estimating share of biofuels processed in UK:
4.8 For this, we assume that all biofuels that come from UK feedstocks and that are
supplied into the UK are also processed here. For biofuels that are sourced
from abroad, we first calculate the current share of UK-processed biofuels that
come from non-UK feedstocks, by taking total production of that biofuel and the
total quantity of that biofuel supplied into the UK that also uses a UK feedstock.
4
Please note that the cost of blending renewable fuels and generating RTFCs depends on the difference in market prices between
fossil fuels and renewable fuels, which is why we use the terms "price projections" and "cost projections" interchangeably in this CBA.
13Once this share is calculated, we again create three scenarios that match up
with those above:
• Optimistic: 50% increase in current proportion of imported biofuel feedstocks
processed in UK
• Pessimistic: 50% decrease in current proportion of imported biofuel feedstocks
processed in UK
• Central: Processing - same proportion of imported biofuel feedstocks processed
in UK as present
Estimating Gross Value Added
4.9 To calculate the gross value added to the UK economy by the biofuels industry,
we use the figures outlined above to calculate what proportion of the additional
biofuels supplied under the RTFO CBA scenarios are produced in the UK in
each year, and then multiply this by our economic value added per litre
estimates.
Factoring in additionality
4.10 Gross value added, however, does not provide a full picture of the economic
impacts. It is very likely that at least some of the capital investment and jobs
created in this industry will simply be diverted from other uses and are therefore
not really additional. We must therefore estimate how much of this impact is
additional to a ‘do-nothing’ baseline.
4.11 To do so, we have calculated three ‘additionality’ percentages, which estimate
what proportion of the gross impacts are additional to the baseline and therefore
a benefit attributable to the policy. These are based on information given to us
by the biofuels industry, and match up to the three scenarios outlined above.
These are then multiplied by their respective gross value-added estimates to
give us a range of net value-added estimates.
4.12 We consider that some of the value which is not additional and which would
have been generated in the UK economy in the absence of this policy would
have come from the fossil fuel industry. Hence some of the value lost to the
fossil fuel industry is indirectly taken into account here. However, we appreciate
that this may not fully reflect the impact of the policy on the fossil fuel industry.
Converting to Net Present Values (NPVs)
4.13 Once we have net value-added figures for each year, we time-discount these
according to the standard Green Book guidance, using an annual discount rate
of 3.5% and taking 2015 as the base year. This gives us the final monetised
impacts that can be compared and combined with the rest of the RTFO CBA
analysis.
Assumptions
4.14 Profit and spending on capital and labour are considered additional to the
baseline; feedstock and operating costs are not. All biofuels supplied under the
RTFO and with feedstocks sourced from the UK are assumed to have been
14processed/produced in the UK. The value-added per litre of biofuel remains
constant in real terms until 2030.
4.15 Due to limited information, at present we assume that the share of advanced
biofuels processed in the UK is equivalent to that of waste biodiesel. This
assumption may be revised if further information comes to light.
4.16 There are a range of other economic benefits that are extremely difficult to
quantify. These include the potential benefits for energy security from
associated UK production and reduced reliance on imported animal feed. We
have not attempted to quantify these.
4.17 The final step in the analysis is to combine all the estimated costs and benefits
of each option, and discount them to produce net present value estimates.
Evidence and assumptions
4.18 The evidence and assumptions we use to model impacts build on the evidence
agreed by Working Group 1 of the Transport Energy Taskforce in early 20155
and have more recently been shared and tested with stakeholders, at a
workshop in December 2015. Some aspects of these have been updated post-
consultation. They are explained in detail in Appendix 1 and include:
• Projections for road transport energy demand from BEIS's Energy Projections
• Projections for petrol/diesel split from DfT scenarios and BEIS's Energy
Projections
• Price projections for the different types of renewable fuels supplied under the
RTFO
• Different scenarios for E10 uptake: No E10, High E10 and central E10
• Contribution of electricity to meeting the RED sub-target
• Availability of waste-derived fuels
• Assumed carbon intensity of different fuels
• Value of carbon savings
Key uncertainties and sensitivity analysis
4.19 Below, we explain what we consider to be the main uncertainties in the
modelling, by order of impact/importance, and how we have addressed the
uncertainty:
• Difference in costs of supplying renewable fuels and fossil fuels
• Uptake of E10 fuel
• Use of crop biodiesel
• Dieselisation of the vehicle fleet
• Waste biodiesel price/availability
• Valuing carbon savings
5
http://www.lowcvp.org.uk/projects/transport-energy-task-force.htm
15• ILUC factors
• 'Development' renewable fuels availability
• Biomethane uptake
• The uncertainties around blending of biofuels into NRMM (fuels used for non-
road mobile machinery)
Difference in costs of supplying renewable fuels and fossil fuels
4.20 The uncertainty around the policy costs is driven by a range of factors. The key
single factor we have identified is uncertainty around market price
developments, i.e. how renewable fuel prices change in relation to fossil fuel
prices. Global energy and commodity markets are inherently volatile and future
market developments are notoriously difficult to predict, but the price spread
between fossil fuels and renewable fuels determines the cost impact of the
policy. To capture this uncertainty, we have developed low/central/high
projections of the price spreads between renewable fuels and fossil fuels. (See
Appendix 1 for details)6 These are based on historical spreads and are
projected independently of the underlying fossil fuel prices and commodity
prices. In the analysis, they are used to generate ranges of cost estimates and
net present values.
4.21 In our central price scenarios, the spreads between fossil fuels and renewable
fuels fall steadily, since historically the cost of renewable feedstocks has fallen
faster than the cost of fossil fuels. We also consider the possibility of spreads
either rising (high price scenario) or falling faster (low price scenario).
Uptake of E10 fuel
4.22 There is also high uncertainty around the future uptake of E10 due to a range of
factors including consumer acceptance. The future uptake of E10 has a
significant impact on which mix of renewable fuels is likely to be supplied but it
has a less significant impact on costs and benefits.
4.23 Since ethanol has significantly lower energy density than petrol, fossil diesel or
renewable diesel, whether E10 is introduced and the extent of uptake affects
how much total renewable energy is supplied. We have developed three
different uptake scenarios for E10 to estimate the impact on total renewable
energy being supplied. The different E10 uptake scenarios are:
i) no uptake (the UK continues to use E5)
ii) medium uptake (a mid point between E5 and high uptake)
= central scenario
iii) high uptake (85% E10 and 15% E5)
4.24 For quantifying costs and benefits in this CBA, we use the central scenario
'moderate E10 uptake'. In section 5, we show as a sensitivity analysis what
6
Please note that the cost of blending renewable fuels and generating RTFCs depends on the difference in market prices between
fossil fuels and renewable fuels, which is why we use the terms "price projections" and "cost projections" interchangeably in this CBA.
16different levels of E10 uptake would mean for renewable energy being delivered
as well as costs and benefits.
4.25 Sections of industry have commented that they consider a 'moderate' E10
uptake highly unlikely, because there are limitations to the refining and
refuelling infrastructure that make it challenging to supply a wider variety of fuel
grades than currently available. As such, the view of some stakeholders in the
industry is that the 'no E10 uptake' and 'high E10 uptake' are more likely than
our central scenario. However, the experience in other countries which have
deployed E10 has generally not been a wholesale switch of the standard grade
of petrol from E5 to E10. In Germany, France and the Netherlands there has
been a moderate uptake of E10, with some refuelling stations offering E5 whilst
others offer E10. As in the UK, there are few forecourts in these countries that
offer more than two grades of petrol (typically 'super' and standard grade), so
typically individual fuel stations either have E5 or E10 as the standard grade.
Use of crop biodiesel
4.26 The higher crop cap in the early years of the policy allows potentially for the use
of some crop biodiesel. It is uncertain under which circumstances the market
would supply this, as it is currently nearly absent from the UK fuel supply. If the
crop cap allows crop biodiesel, its use may still be limited by the B7 blendwall of
biodiesel. For the purpose of a sensitivity analysis, we have included some crop
biodiesel up to the B7 blendwall in the early years of the policy.
Waste biodiesel availability/price
4.27 The market for waste biodiesel has a slightly different dynamic from the other
renewable fuels, since it has fewer uses and would not be traded globally if it
was not for European demand for it as a transport fuel. The demand for waste
biodiesel is driven by EU renewables policy and is set to increase between now
and 2020. In addition to the uncertainty of global commodity markets, which
indirectly affect waste biodiesel prices, there is also significant uncertainty
around the availability of waste feedstocks and how the prices of waste derived
fuels will respond to a significant increase in European (and UK) demand in the
run-up to 2020.
4.28 For the pre-consultation CBA we looked at different cost projections just for
waste biodiesel. Consultation responses assured us that in principle enough
waste biodiesel can be supplied. And given that the policy now includes a crop
cap, which is unlikely to be filled with crop ethanol in the early 2020s, there will
be less upward market pressure on waste biodiesel prices than we considered
for policy options 2 and 3 and for the sensitivity analyses of the pre-consultation
CBA. The central scenario in this CBA uses the same waste biodiesel cost
projections that were previously used for policy option 1 with no crop cap. We
still include a sensitivity analysis for a scenario where waste biodiesel becomes
scarce and market prices increase significantly.
Dieselisation of the vehicle fleet
4.29 The dieselisation of the fleet is relevant, since it determines how much ethanol
can be blended, and blending ethanol is expected to remain the most cost-
17effective option for generating RTFCs. We use BEIS' EEP projections for our
central diesel/petrol split and also perform a sensitivity analysis using a
declining diesel share. (See appendices for details)
Valuing carbon savings
4.30 We use BEIS carbon values for carbon savings in the non-traded sector to
estimate carbon saving benefits. Alongside their central values, BEIS also
provide high and low carbon values, which we have used for a sensitivity
analysis.
ILUC factors, and GLOBIOM as sensitivity test
4.31 There is some uncertainty around the amount of carbon saved by the policy,
and specifically around the importance of indirect land use change for different
renewable fuels.
4.32 The greenhouse gas intensities we use reflect lifecycle emissions and take
account of ILUC emissions factors published in the revised Renewable Energy
Directive, which provide current best evidence on the net greenhouse gas
benefits of using biofuels. (See appendix for values.)
4.33 As a sensitivity, we also repeat the analysis with ILUC factors from the recently
published GLOBIOM study. Recent research published by the GLOBIOM
consortium, commissioned by the European Commission, has suggested that
ILUC emissions from crop-based biofuels may be significantly higher than
previous estimates.7 This is especially so for crop-based biodiesels.
4.34 We have therefore examined the effects of a 'GLOBIOM' scenario on our
central scenario. ILUC values from the directive and from the GLOBIOM study
are shown in Appendix 1. Using GLOBIOM values reduces carbon savings
NPVs are shown in Annex 4.
'Development' renewable fuels availability
4.35 The fuels required by the development fuel sub-target may not be available in
2019 when the development sub-target is introduced. We have included a high
cost estimate across all scenarios for these fuels for 2019 and 2020 to account
for the possibility of buy out.
Non-Road Mobile Machinery (NRMM)
4.36 There is also uncertainty regarding the future share of renewable fuels that is
used in non-road mobile machinery. This fuel counts towards the RTFO but not
towards the RED. If there was a significant increase in renewable fuels being
used in NRMM, this would increase the risk of the RED target not being met,
however this seems unlikely. In the analysis, we assume that biodiesel is only
blended in road diesel. As the biodiesel blend in road diesel approaches the
blendwall, we may see some biodiesel blended into NRMM fuels or used in
HGVs and busses as high blends. However, we would not expect this to
7
https://ec.europa.eu/energy/sites/ener/files/documents/Final%20Report_GLOBIOM_publication.pdf
18happen, unless there is a significant shift to petrol and away from diesel, which
would reduce the maximum capacity for biodiesel blending in road fuel.
Biomethane
4.37 Biomethane uptake scenarios were developed for the 2015 amendments to the
RTFO and are also included in the baseline of this analysis. (Details are in
Appendix 1.)
195. Impacts of the policy on fuels supplied
and GHG emissions
Baseline fuel supply
5.1 In the absence of any amendments, we would expect the proportion of
renewable fuels to continue at similar levels to those seen in recent years. Our
projections for total demand and for the petrol/diesel split are based on BEIS's
Energy and Emissions Projections 2016 (EEP)8. (Details are shown in Appendix
1). Projected baseline volumes are shown in chart 2.
Chart 2: expected supply of biofuels under the RTFO baseline
5.2 We do not expect the fuels supplied to vary between low/central/high price
scenarios. This is because the relative cost effectiveness of generating RTFCs
from different fuels is not expected to change between different price scenarios
(e.g. ethanol is always expected to be the cheapest per litre, and the price of
waste biodiesel is always higher than the price of crop biodiesel per litre).
8
https://www.gov.uk/government/collections/energy-and-emissions-projections
20Fuel supply under the policy
Impacts of the increased obligation and development fuels sub-target
5.3 Increasing the RTFO obligation and introducing a development fuel sub-target
requires larger volumes of renewable fuels to be used than under the baseline.
For our central scenario we assume moderate uptake of E10, which drives the
amount of ethanol that can be supplied. We look at high E10 and No E10 as a
sensitivity. We do not expect significant volumes of crop biodiesel to be
supplied but we look at potential supply of crop biodiesel as a sensitivity.
Chart 3: overview of renewable fuels supplied 2018-2032 by volume -
central scenario
5.4 This fuel supply would meet the transport sub-target of the RED in 2020 and
would also contribute to meeting the 2020 FQD target.
Table 8: contribution to the 2020 Fuel Quality Directive target
% contribution to 6% FQD target 2019 2020
With policy 3.81% 4.45%
21Table 9: renewable fuels as proportion of total liquid road fuels, with
development fuel sub-target in place
Obligation Target (obligation) "Development" sub- Remaining obligation
period level, as share of target (counted twice to be met with other
total fuel by volume towards RED) renewable fuels
2018 7.25% 7.25%
2019 8.50% 0.05%(0.1%) 8.4%
2020 9.75% 0.075%(0.15%) 9.6%
2021 10.1% 0.25%(0.5%) 9.6%
2022 10.4% 0.4%(0.8%) 9.6%
2023 10.6% 0.5%(1%) 9.6%
2024 10.8% 0.6%(1.2%) 9.6%
2025 11.0% 0.7%(1.4%) 9.6%
2026 11.2% 0.8%(1.6%) 9.6%
2027 11.4% 0.9%(1.8%) 9.6%
2028 11.6% 1%(2%) 9.6%
2029 11.8% 1.1%(2.2%) 9.6%
2030 12.0% 1.2%(2.4%) 9.6%
2031 12.2% 1.3%(2.6%) 9.6%
2032 12.4% 1.4%(2.8%) 9.6%
5.5 The obligation % listed above may include significant amounts of double
counted materials. For compliance with the Renewable Energy Directive's
overall target, it is also important what the fuel supply translates into in terms or
TWh of renewable energy.
Table 10: TWh of liquid and gaseous renewable fuels used in road transport
Baseline (TWh) With policy (TWh)
2018 11.5 17.5
2019 11.4 20.3
2020 11.3 23.1
2021 11.2 23.7
2022 11.1 24.2
2023 11.0 24.5
2024 11.0 24.9
2025 10.9 25.1
2026 10.9 25.5
2027 10.8 25.8
2028 10.8 26.1
2029 10.7 26.5
2030 10.7 26.9
2031 10.7 27.2
2032 10.7 27.3
22Table 11: progress towards meeting the RED transport sub-target
Some tables are by volume Some are by energy
Obligation Target % of transport % of transport % of transport
period (obligation) sub-target met sub-target met sub-target met
level, as through through through
share of total renewable fuels renewable fuels renewable fuels
liquid fuel by with E5 with moderate with high E10**
volume (estimate, E10*** (estimate, uptake (estimate,
includes double includes double includes double
rewarding and rewarding and rewarding and
development fuel development fuel development fuel
sub-target, by sub-target) by sub-target) by
energy energy energy
1/1/2019 – 8.50% 8.1% 8.0% 7.9%
31/12/2019
1/1/2020 – 9.75% 9.4% 9.2% 9.0%
31/12/2020
2020 1.1% (4.77 TWh) 1.1% (4.77 TWh) 1.1% (4.77 TWh)
contribution
renewable
electricity
Total 10.5% 10.3% 10.1%
* note 2018 is a short obligation period so that we can switch to a calendar basis.
** Assumes 15% of E5 and 85% of E10 on average across the entire petrol supply, i.e. an overall
ethanol content of 9.05% by volume
*** Assumes 59.5% of E5 and 40.5% of E10 on average across the entire petrol supply, i.e. an
overall ethanol content of 6.825% by volume. This is half way between no E10 and high E10 and is
meant to reflect uncertainty around actual E10 uptake.
5.6 Under the Renewable Energy Directive, renewable electricity used in electric
road vehicles and trains will also count towards meeting the requirements of the
Directive. We expect this to account for 4.77 TWh or 1.1% of the transport sub-
target in 2020, based on methodology provided by the RED.9
5.7 In addition to the contribution from E5, E10 and development fuels, we would
expect the majority of renewable fuel to come from biodiesel, either waste-
derived or crop-derived. This is because there is significant room to deploy
biodiesel within the 7% "blend wall" provided by the diesel standard EN590
(nationally, deployment is currently around 3%). We also expect small amounts
of other renewable fuels, such as renewable methanol.
5.8 Appendices 2 and 3 show how we would expect supply to develop, both in
volume and in energy terms. The chart below shows the overall trajectory.
9
Article 3, paragraph 4, point c, page 14 of the amendments document here: http://eur-lex.europa.eu/legal-
content/EN/TXT/PDF/?uri=CELEX:32015L1513&rid=2.
23Renewable fuel supply above baseline - with policy
5.9 In summary, we expect the below volumes to be supplied under the policy, in
addition to the baseline.
Table 12: renewable fuel additional to baseline
Fuel 1G Ethanol Waste biodiesel Fuels supplied Total (million
supplied (million litres) (million litres) under the litres)
additional development fuel
to RTFO sub-target (million
baseline litres)
2018 172 547 361
2019 253 814 3 719
2020 327 1071 15 1071
2021 322 1066 101 1414
2022 319 1061 173 1489
2023 317 1057 220 1553
2024 317 1051 267 1594
2025 317 1043 313 1635
2026 320 1037 359 1673
2027 321 1032 404 1716
2028 324 1025 449 1757
2029 328 1020 494 1797
2030 332 1015 539 1842
2031 337 1011 584 1887
2032 27010 972 630 1931
Carbon savings with policy
5.10 The main benefits that we expect to see from the increased use of renewable
fuels are savings in carbon emissions above the baseline of the existing RTFO
obligation. The exact savings depend on which fuels are used to meet the
increased RTFO obligation and also the development fuel sub-target.
5.11 From the volumes of renewable fuels that are supplied and the volumes of fossil
fuel that they displace, we have modelled the savings for the fuel use projected
under the central scenario.
10
Plus 72 million litres of advanced ethanol
24Table 13: estimated total carbon savings additional to baseline with policy,
including ILUC, mtCO2
GHG savings additional to
baseline,MTCO2e With Policy
2018 1.43
2019 2.14
2020 2.84
2021 3.07
2022 3.26
2023 3.39
2024 3.51
2025 3.62
2026 3.74
2027 3.86
2028 3.98
2029 4.10
2030 4.22
2031 4.35
2032 4.43
Total 52
Sensitivity analysis
High E10 Trajectory
5.12 Since there is considerable uncertainty around the future use of E10, we have
considered alternative uptake scenarios. If there is a high E10 uptake, the
demand for crop ethanol is likely to exceed the crop cap. At that point, we would
expect to see an increased uptake of advanced, waste-derived ethanol post-
2028. (Some waste-derived ethanol is already supplied under the current
RTFO.)
25Chart 4: fuel projection with high E10
No E10 trajectory
5.13 Equally, it is possible that there will be no uptake of E10, and the obligation
needs to be met with E5, biodiesel and advanced fuels. In this scenario, we
would not see any demand for advanced ethanol. For our central diesel
assumptions, it remains possible to meet the RTFO obligation without the need
for high blend diesel or NRMM.
26Chart 5: fuel projection without E10
High-crop biodiesel trajectory
5.14 Under the B7 blend wall and the declining crop cap, it would be possible to see
significant amounts of crop biodiesel supplied, although we do not consider this
likely and it is not part of our central scenario. For illustrative purposes, the chart
below shows the maximum possible amount of crop biodiesel that could be
supplied under the declining crop cap and the B7 blend wall. The strange shape
of this supply profile is due to the blendwall limiting supply from 2020 onwards
but not before.
27Chart 6: possible high-crop biodiesel trajectory (million litres)
286. Costs and benefits of the policy
Summary of costs and benefits
6.1 The two tables below show a summary of impacts both for the duration of the
policy and for 2020. The range presented in these tables does not cover the full
range of values presented in the CBA as it does not include sensitivities.
Table 14: summary of net present value estimates (2018-2033)
Total
additional Present Net present Net
carbon Present value costs value (£m) present
Additional to savings value central Present value range, value (£m)
baseline, (MTCO2e) benefits estimate costs (£m) (benefits central
2015 prices (£m) (£m) range minus costs) estimate
With Policy 52 3567 4276 1534 to 9313 2033 to -5746 -709
Consultation
Option 2 33.6 2303 3107 1213 to 6313 1090 to -4011 -804
Table 15: 2020 pump price impact, crop share, carbon abatement & RED
compliance cost
Average
Abatement
cost
Costs are 2020 present
2020 Pump 2020
additional to RED Abatement value
Resource price
baseline in Crop share compliance cost (£/TCO2e)
cost impact, impact, ppl
2020, 2015 (% by cost (£/TCO2e) 2017-30 or
£m (range)
prices (range) volume) (£/MWh) in 2020 2018-2032
351 0.9 (0.3- 1.7% (0- 123 (44-
With Policy (127-725) 1.9) 4%) 256) 119
Consultation 366 (143- 137 (53- 95
Option 2 729) 1.0 (0.4-2) 2% (0-2%) 31.2 273)
6.2 The quantified benefits of the proposed changes are lower carbon emissions
from transport as well as value added to the UK economy from domestic biofuel
production. This includes the expected development of an industry that can
deliver low carbon transport fuel in the long run. The main cost impacts are
higher fuel costs, since renewable fuels are more expensive than fossil fuels per
unit of energy.
296.3 These proposed carbon savings are already included in BEIS's latest emissions
projections. If they were not realised, additional carbon savings would need to
be generated elsewhere in order to meet carbon budgets.
6.4 There is considerable uncertainty around the cost estimates, since the cost
impact is driven by two volatile variables, the market price of fossil fuels and the
market price of renewable fuels. In spite of significant uncertainties, we have
developed projections of the price differential between fossils and renewables.
(See Appendix 1.) The price projections are first derived per MWh and not per
litre, to account for the different energy content of different fuels. To make them
accessible to the audience, we also present them in terms of pence per litre
spreads.
6.5 Based on our central price projections, the methodology outlined in Section 4,
and the evidence outlined in Appendix 1, the estimated cost impacts and carbon
savings of the policy is shown below:
i - Quantified impacts
6.6 The tables below show central estimates of quantified costs and benefits over
the duration of the policy
Table 16: cost impacts and carbon savings with policy and above baseline
(2015 prices, undiscounted)
Additio- Pump Carbon Carbon
nal to Energy Price Cost price savings savings Abatement
RTFO used premium impact impact without ILUC with ILUC cost*
baseline (TWh) (£/MWh) (£m) (ppl) (MTCO2e) (MTCO2e) (£/TCO2e)
2018 6.00 30 178 0.47 1.65 1.43 124
2019 8.95 29 263 0.70 2.46 2.14 123
2020 11.84 30 351 0.94 3.27 2.84 123
2021 12.54 31 391 1.06 3.50 3.07 127
2022 13.13 32 423 1.15 3.70 3.26 130
2023 13.51 32 433 1.19 3.83 3.39 128
2024 13.88 32 440 1.21 3.95 3.51 125
2025 14.22 31 444 1.23 4.06 3.62 122
2026 14.61 31 448 1.25 4.19 3.74 120
2027 14.98 30 450 1.26 4.31 3.86 116
2028 15.34 29 448 1.27 4.43 3.98 113
2029 15.73 28 445 1.26 4.56 4.10 109
2030 16.13 27 440 1.25 4.68 4.22 104
2031 16.52 28 463 1.32 4.81 4.35 106
2032 16.62 30 499 1.43 4.88 4.43 113
*includes ILUC factors
30Net Present Values
6.7 The table below shows the central net present value estimates (NPV =
discounted benefits minus discounted costs) for the policy under different cost
projection scenarios.
Table 17: summary of NPVs
£m,
2015 Discounted
prices
Low Cost Central Cost High Cost
Net
Total Net Net Net
value
carbon Resource cost/ Resource cost/ Resource cost/
added
benefits cost benefit cost benefit cost benefit
2018 85 16 65 36 160 -59 261 -160
2019 124 24 86 62 229 -81 426 -278
2020 162 31 106 88 295 -102 610 -417
2021 172 43 114 100 318 -104 664 -450
2022 179 51 119 111 332 -102 689 -459
2023 183 56 117 121 329 -91 691 -452
2024 186 60 121 125 323 -78 690 -445
2025 188 63 121 130 314 -63 686 -434
2026 191 67 117 140 307 -50 680 -423
2027 193 70 111 151 298 -35 672 -410
2028 195 72 103 164 287 -20 663 -395
2029 197 75 94 178 275 -3 653 -382
2030 199 77 84 192 263 13 643 -367
2031 216 79 85 210 267 28 643 -348
2032 231 84 89 226 278 37 643 -327
Total 2701 866 1534 2033 4276 -709 9313 -5746
NPVs under sensitivity analysis
6.8 Detailed NPV estimates for sensitivity analyses are shown in appendix 4.
ii - Non-quantified impacts
6.9 Beyond the impacts on resource costs and carbon savings that have been
quantified for this cost benefit analysis, we would expect to see wider economic
impacts which we have not attempted to quantify.
Impacts on motorists
6.10 Increasing the RTFO obligation level with a crop cap at or above current levels
of crop-derived supply (options 1 or 2) will increase the likelihood of E10 being
introduced to the market, and there are possible consequences and real
consumer impacts associated with the introduction of E10 including:
31• Limited access to E5 on forecourts, which would be problematic for drivers of
older, incompatible cars. This only applies to older petrol cars and by current
estimates this will affect around 5% of drivers of petrol cars by 2020.
• The cost per mile driven increases marginally due to the lower energy content of
ethanol.
6.11 We are aware of the potential impacts of E10 introduction on E10-unsuitable
vehicles, and have examined them as part of the review of the E5 protection
grade. We will consult on an extension to the protection grade.
Impacts on fuel suppliers
6.12 The policy represents an increase in demand for the renewable fuels industry
as a whole. It also generates the opportunity for a new industry to emerge to
supply fuels under the development sub-target. We attempt to reflect this in the
CBA through "net value added" estimates for the increase in first generation
fuels as well as the supply of development fuels. The value added methodology
recognises that not all value generated by these suppliers is new or "additional".
6.13 An increase in the RTFO obligation and the introduction of the "development
fuels" sub-target may increase the risk that fossil fuel suppliers will choose to
buy out of the obligation.
6.14 The new requirement on the UK to report ILUC impacts of crop-derived fuels is
not expected to generate an administrative burden on fuel suppliers but could
affect the public image of some fuel suppliers.
6.15 The changes to the 'carry-over' of RTFCs will also have an impact on fuel
suppliers, especially the suspension of the RTFC carryover from 2019 to
2020.However, we do not have enough evidence to quantify these impacts.
Impacts on the wider economy
6.16 Apart from contributing to UK carbon budgets, the policy contributes to meeting
the requirements of the Fuel Quality Directive, the transport-specific RED sub-
target, and the cross-sector 2020 RED target, the latter of which requires 15%
of energy to come from renewable sources across heating, electricity
generation and transport.
6.17 For the UK economy as a whole, fuel security is expected to increase as
dependence on imported fossil fuels decreases.
327. Appendices
Appendix 1 - Details of analytical evidence and assumptions
Current share of biofuels and baseline renewable share
7.1 The current share of biofuels is used to estimate biofuel use under the baseline.
The table below shows UK biofuels historically supplied under the RTFO, as
recorded in RTFO statistics.11
Table 18: renewable fuels supplied under the RTFO by volume
2012/13 2013/14 2014/15 2015/16
million litres (Year 5) (Year 6) (Year 7) (Year 8)
Total fuel use 44,706 50,417 50,882 51,666
Single rewarded renewable
fuels 805 933 835 920
Double rewarded renewable,
after double reward 1,058 1,621 1,662 1,840
Single + double rewarded
renewable 1,863 2,554 2,496 2,485
as % of total (incl. double
reward) 4.2% 5.1% 4.9% 4.96%
Table 19: fuels supplied historically under the RTFO as % of energy supplied
and baseline projections
2012/13 2013/14 2014/15 Model
Fuel (Year 5) (Year 6) (Year 7) Baseline
Biodiesel 1.05% 1.63% 1.57% 1.53%
Ethanol 1.09% 1.01% 0.98% 0.93%
Other fuels 0.07% 0.07% 0.02% 0.14%
Total 2.21% 2.71% 2.57% 2.6%
RED contribution (including fuels
that are double rewarded) 3.24% 4.12% 4.01% 4.27%
11
https://www.gov.uk/government/collections/biofuels-statistics
33Demand projections
7.2 Projections for road transport energy demand from BEIS's EEP 2015:
This is taken from BEIS’s Energy and Emissions Projections (EEP) 2015, Reference
scenario. https://www.gov.uk/government/collections/energy-and-emissions-
projections
All existing and planned UK government policies are taken into account. It projects
that total energy demand will come to 421 TWh and 468 TWh in 2020 (for the
purposes of the RED and FQD respectively). Given the relative stability of total
energy demand, we have not modelled sensitivities around this.
Chart 7: transport energy demand projections, TWh
Chart 8: transport energy demand projections, million litres
347.3 Projections for petrol/diesel split from EEP 2015
This is also taken from BEIS’s EEP 2015.
https://www.gov.uk/government/collections/energy-and-emissions-projections
It projects that the diesel share of road transport energy will rise from 65% in 2015 to
70% in 2020. Given potential uncertainty, we have also modelled a ‘low dieselisation’
scenario, where we examine the impact of a reversal in the dieselisation trend.
Chart 9: updated EEP demand projections
35Chart 10: low dieselisation for sensitivity analysis
Energy densities per litre
7.4 For modelling purposes, we use the below energy densities.
Table 20: energy densities of different fuels
Fuel Energy density (MJ/l)*
Diesel 35.77
Petrol 32.95
Ethanol 21.28
Biodiesel 32.8
Biomethane 50
Biomethanol 16
*MJ/kg for biomethane
Source: Annex 2, DTI ‘Technology Status Review and Carbon Abatement Potential
of Renewable Transport Fuels in the UK’,
http://www.fcrn.org.uk/sites/default/files/DTI_Technology_status_review.pdf
36Cost projections for renewable fuels supplied under the RTFO
7.5 The cost of blending renewable fuels and generating RTFCs depends on the
difference in market prices between fossil fuels and renewable fuels, which is
why we use the terms "price projections" and "cost projections" interchangeably
in this CBA.
7.6 Global energy and commodity markets are inherently volatile and future market
developments are notoriously difficult to predict. To capture this uncertainty, we
have developed low/central/high projections of the price spreads between
renewable fuels and fossil fuels. (Charts 12, 14, 16) These are projected
independently of the underlying fossil fuel prices and commodity prices.
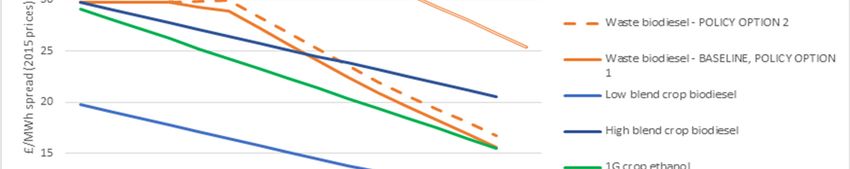
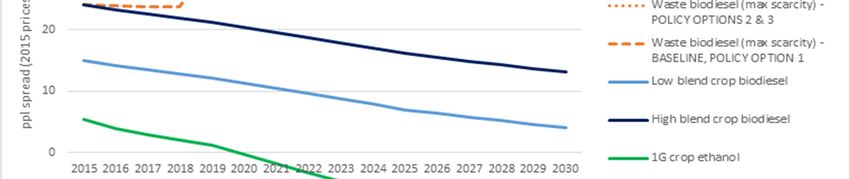
7.7 The low/central/high cost projections were developed for the price spreads
between fossil fuels and renewable fuels per unit of energy and reflect different
possible future developments of global fossil oil, vegetable oil and ethanol
markets. To make them more accessible to the audience, we have also
translated these into price projections per litre. (Charts 13, 15, 17)
7.8 In our central cost projections, the spreads between fossil fuels and renewable
fuels fall steadily, since historically the cost of renewable feedstocks has fallen
faster than the cost of fossil fuels. We also consider the possibility of spreads
either rising (high cost projections) or falling faster (low cost projections).
7.9 Though the majority of our projections predict ethanol will be more expensive
than crop biodiesel in energy terms (£/MWh), as the RTFO is a volume-based
measure and ethanol has a relatively low energy density, we anticipate ethanol
will still be cheaper by volume (p/litre). We expect that generating RTFCs from
blending ethanol will therefore remain most cost-effective for suppliers, and
ethanol will be supplied in preference to other fuels up to the blendwall (E5 or
E10) and subject to the crop cap.
7.10 The cost projections for "waste biodiesel" are based on the following: 2015
value based upon observed historical diesel- waste biodiesel spreads. This
increases to two times the crop biodiesel spread per litre (not per MWh) in
2020, due to a significant increase in demand for waste biodiesel. From 2020,
the waste biodiesel spread tracks the crop biodiesel spread (times 2) over the
period to 2030.
37Chart 11: waste biodiesel spreads, central projection
7.11 As illustrated in Charts 14 and 15, under the high cost projections, waste
biodiesel prices reach the buy out price in 2020 and stay at the buy-out price (in
real terms) from then onwards.
7.12 For the purposes of labelling, 'low blend' biodiesel is defined as biodiesel
blended into fossil diesel at proportions up to 7%. All biodiesel used in blends
above 7% is defined as 'high blend', which is not suitable for all diesel engines,
and is modelled with a cost uplift of 9 pence per litre to represent the higher
costs of using this fuel. This is a DfT estimate, which has been validated by
stakeholders with experience of using high blend biodiesel.
38You can also read