FUEL CELLS FOR HEAVY DUTY TRUCKS 2030+? - REPORT 2019:604
←
→
Page content transcription
If your browser does not render page correctly, please read the page content below

FUEL CELLS FOR HEAVY DUTY TRUCKS 2030+?
REPORT 2019:604

 TEKNIKBEVAKNING
 BRÄNSLECELLER


Can fuel cells become a mass-produced
 option globally for heavy-duty trucks
 2030+?

 MAGNUS KARLSTRÖM
 HANS POHL
 ANDERS GRAUERS
 ELNA HOLMBERG

 ISBN 978-91-7673-604-3 | © ENERGIFORSK September 2019
Energiforsk AB | Phone: 08-677 25 30 | E-mail: kontakt@energiforsk.se | www.energiforsk.se

CAN FUEL CELLS BECOME A MASS-PRODUCED OPTION GLOBALLY FOR HEAVY-DUTY TRUCKS 2030+?

Förord
I syfte att koordinera teknikbevakningen, men också för att
sammanställa, analysera och sprida information om utvecklingen inom
bränslecellsområdet finansierar Energimyndigheten projektet
Teknikbevakning av bränsleceller. Projektet och dess resultat vänder till
svenska intressenter och genomförs under 2016 – 2019 som ett
temaområde inom kompetenscentret Swedish Electromobility Centre
med Energiforsk som koordinator och projektledare.
I denna rapport, som tagits fram inom teknikbevakningen, har huvudsakligen
ägandekostnader för fyra drivlinor (diesel, batteri, elväg och bränsleceller) för
lastbilar för tre transportuppdrag, fjärrtransporter, regionaltrafik och
stadsdistribution analyserats. Projektet har genomförts av Magnus Karlström
(projektledare) Chalmers, Elna Holmberg och Anders Grauers från Swedish
Electromobility Centre. Hans Pohl, RISE Viktoria har också medverkat.

Styrgruppen för teknikbevakningsprojektet har bestått av följande ledamöter:
Pontus Svens/Annika Ahlberg-Tidblad, Scania, Mats Andersson/Staffan
Lundgren/Johan Svenningstorp, AB Volvo, Stefan Bohatsch, Volvo Cars, Jörgen
Westlinder, Sandvik Materials Technology, Andreas Bodén, Powercell, Bengt
Ridell, Sweco Energuide, Göran Lindbergh, Swedish Electromobility Centre/KTH,
Peter Smeds/Magnus Lindgren, Trafikverket, Elna Holmberg, Swedish
Electromobility Centre och Bertil Wahlund, Energiforsk. Energiforsk framför ett
stort tack till styrgruppen för värdefulla insatser.

Samtliga rapporter från projektet kommer att publiceras och fritt kunna laddas ner
från Energiforsks webbplats under Teknikbevakning bränsleceller på
www.energiforsk.se och på Swedish Electromobility Centres webbplats
www.emobilitycentre.se.

Stockholm juni 2019

Bertil Wahlund Energiforsk AB

Här redovisas resultat och slutsatser från ett projekt inom ett forskningsprogram
som drivs av Energiforsk. Det är rapportförfattaren/-författarna som ansvarar för
innehållet.

 Swedish Electromobility Centre är ett nationellt kompetenscentrum
 för forsk-ning och utveckling av el- och hybridfordon och laddinfra-
 struktur. Vi enar Sveriges kompetens och utgör en bas för samverkan
 mellan akademi, industri och samhälle.

 3
CAN FUEL CELLS BECOME A MASS-PRODUCED OPTION GLOBALLY FOR HEAVY-DUTY TRUCKS 2030+?

Sammanfattning
Projektet är huvudsakligen en kalkyl av ägandekostnader för fyra drivlinor för
lastbilar för tre transportuppdrag, fjärrtransporter, regionaltrafik och
stadsdistribution.

Drivelinetyperna var diesel, batteri, elväg och bränsleceller. Dessutom användes
data för tre marknader; Tyskland, USA och Kina. Allt beräknades med
kostnadsnivåer motsvarande läget 2030. Viktiga förutsättningar var att det är
volymsproduktion av alla komponenter som t ex bränsleceller och batterier, men
också att det är god utnyttjandegrad av t ex vätgasstationer, laddinfrastruktur och
elvägar.

Resultaten visar att elvägar ger lägst totalkostnader, följt av batterifordon
(beroende på antagen kostnadsnivå för batterierna). Bränslecellsfordon ger lägre
kostnader än diesel i regional- och stadstrafik. Det finns många osäkerheter i
beräkningarna, så resultaten ska inte övertolkas.

Den viktigaste delen av projektet handlade om att bedöma vilka stora
osäkerhetsfaktorer som kan ha stor påverkan på framtida kostnader. Följande
faktorer listades: Kostnad för drivmedel (vätgas, el och diesel), restvärden för
fordon (ej diesel), fordonets förmåga att fullgöra transportuppdraget (inklusive
räckviddsfrågan) och batterikostnader.

För att försöka få med kostnaden för de begränsningar som batteri- och
bränslecellsfordon kan få i jämförelse med diesel, exempelvis i lastkapacitet på
grund av tunga batterier, infördes en Less Function Factor (LFF). Det konstaterades
att sådana begränsningar påverkar totalkostnaden för fordonet inklusive löner till
förare eftersom det kan ses som att om varje fordon bara klarar cirka 90% av vad
ett dieselfordon klarar så behövs det ungefär ett extra fordon för en flotta om tio
fordon.

 4
CAN FUEL CELLS BECOME A MASS-PRODUCED OPTION GLOBALLY FOR HEAVY-DUTY TRUCKS 2030+?

Summary
This study is mainly a total-cost-of-ownership calculation of four different
powertrains for heavy-duty trucks for three different customer mission profiles,
long haul, regional and urban distributions.

The powertrain alternatives were diesel, batteries, electric road systems and fuel
cells. Also, the calculations were made for three main markets for heavy-duty
trucks; Germany, USA and China.

Everything was calculated for cost levels that could be relevant for the year 2030.
Therefore, it was assumed cost levels of mass-market volume, for example
batteries and fuel cells are assumed. Another important prerequisite was that high
utilization of for example hydrogen stations and charging infrastructure is
assumed.

The results showed that Electric Road Systems has the lowest total costs, and
battery trucks were the second best option (depends upon cost levels of batteries).
Fuel cell trucks are cheaper than diesel trucks for urban and regional distribution.
These results must be interpreted with caution because of several uncertainties in
choice of, for example, the cost of electricity and hydrogen.

The most important part of the study was to assess which uncertainties have a high
impact on the future costs of the alternatives. The most important factors were: cost
of fuel (hydrogen, electricity and diesel), the resale value of fuel cell and battery
trucks (not diesel), if the vehicle could fulfil its transport mission and battery costs.

In order to try to get the cost of the limitations that battery and fuel cell
components can have in comparison to diesel, for example in load capacity due to
heavy batteries, a factor called Less Function Factor was introduced. It was found
that such limitations affect the total cost of the vehicle, including wages to drivers,
as it can be seen that if each vehicle can handle only about 90% of what a diesel
vehicle can handle, it needs approximately one extra vehicle for a fleet of ten
vehicles.

 5
CAN FUEL CELLS BECOME A MASS-PRODUCED OPTION GLOBALLY FOR HEAVY-DUTY TRUCKS 2030+?

List of content
1 Introduction 8
2 Total Cost of Ownership Model 10
 2.1 Overview of model 10
 2.2 TCO Formula, Variables defined and explained 11
3 Goal and Scope 12
 3.1 Compared Fuel/powertrain Alternatives 12
 3.2 Customer Transport Mission profiles 13
4 General data for all use cases 14
 4.1 Fuel consumption (Tank-to-Wheel) for powertrain/fuel combinations 14
 4.2 Hydrogen cost 15
 4.3 Infrastructure cost Electric road systems 16
 4.3.1 Cost for buying electric energy 16
 4.3.2 Annual cost for grid connection 16
 4.3.3 Cost for the electric road system 17
 4.3.4 Cost for the grid connection 17
 4.3.5 Total cost for the electric energy from the ERS 18
 4.4 Infrastructure cost BEV (not ERS) Recharging 19
 4.4.1 Cost for buying electric energy 19
 4.4.2 Annual cost for grid connection 19
 4.4.3 Annual cost for land rent 19
 4.4.4 Cost for the chargers 20
 4.4.5 Cost for the grid connection 20
 4.4.6 Total cost for the electric energy from the chargers 21
 4.5 Component costs 22
 4.6 Component sizing and Purchase price for vehicle types 23
 4.7 Maintenance costs, salary costs and other costs 26
 4.8 Ownership period, resale value and interest rate 26
 4.9 Less function factors 26
5 Yearly driving distance, driver salary and energy prices in China, Germany and
 USA 29
 5.1 Yearly distance for different mission profiles and countries 29
 5.2 Energy prices in Germany, USA and china 29
 5.3 Salary driver germany, usa and china 30
6 TCO Results 31
 6.1 Long Haul Germany, USA and China 31
 6.2 Regional Trucks Germany, USA and China 32
 6.3 Urban Trucks Germany, USA and China 33
 6.4 Factors with a high total cost impact 34
7 Discussions 35

 6
CAN FUEL CELLS BECOME A MASS-PRODUCED OPTION GLOBALLY FOR HEAVY-DUTY TRUCKS 2030+?

8 Conclusions 37
9 References 39

 7
CAN FUEL CELLS BECOME A MASS-PRODUCED OPTION GLOBALLY FOR HEAVY-DUTY TRUCKS 2030+?

1 Introduction
Fuel cell trucks are a trend. For example, the American Hybrid Truck company
Nikola Motors plans to build fuel cell hybrid Class 8 trucks (Hsu, 2017), Toyota
will test a fuel cell Class 8 Truck soon (O'Dell, 2017), Scania together with
Norwegian goods wholesaler Asko will also try-out fuel cell trucks (Scania Group,
2017), and Swedish PowerCell Sweden AB has delivered fuel cells to Switzerland's
first distribution truck with fuel cell technology (PowerCell, 2016).

The increased interest is due to its zero-emission potential, but also it has features
comparable to diesel vehicles, such as infrastructure build-up and refuelling
patterns. Fuel cell trucks have not been used so far, because of the present
drawbacks such as costs of fuel cell systems and hydrogen tanks, lack hydrogen
filling stations and low durability for long-term use, such as for a long-haul truck.
However, these challenges could be solved with technology improvement, mass-
manufacturing and policy support.

Zero or low carbon solutions for road freight vehicles is probably needed to reach
long-term targets for climate gases. Another driver for zero-emission technology is
that several cities want to introduce zero emissions zones. At present road freight
vehicles account for around one-fifth of global oil demand and 35% of transport-
related carbon dioxide (CO2) emissions (IEA, 2017). Since the demand for freight
will continue to increase the CO2 emissions from road freight rapidly will be about
the same as road passenger sector around 2050 with present trends (ICCT, 2016b).
This is one of the reasons several countries have or will implement fuel economy
standards or carbon dioxide legislation for road freight vehicles.

The road freight sector is complex to legislate because of the variety of vehicle
types and their uses. Also, the freight vehicles are usually bought by a company to
perform a freight task with so low total-cost-of-ownership (TCO) as possible.

Fuel cells are not the only low-emission technology for companies and policy-
makers. One of the main options the next 15-20 years are more efficient internal
combustion engine vehicles with biofuels, but also with electrofuels, which are
drop-in replacement fuels that are made by storing electrical energy from
renewable sources in the chemical bonds of liquid or gas fuels. Battery freight
vehicles are an option, but also electric road systems are a promising alternative.
All of these propulsion options could also be combined in different hybrid
configurations.

Fuel cell trucks are used, but it is early days. Our question is if fuel cell trucks can
be mass produced option in 15-20 years. One of the main decision criteria is if fuel
cell trucks can be economically viable compared to other alternatives in some use
cases and main markets. Several reports and articles have been studying TCO of
fuel cell trucks, but they have mainly been focusing upon long haul and a specific
country.

Therefore, our report will compare the total-cost-of-ownership of fuel cell trucks
with other low emission options. We will also calculate for three use cases of
trucks: urban distribution, regional delivery and long haul. Our assessment is

 8
CAN FUEL CELLS BECOME A MASS-PRODUCED OPTION GLOBALLY FOR HEAVY-DUTY TRUCKS 2030+?

based upon the year 2030+ to include technology performance and cost
improvements. The base case is the use of trucks in Germany, but we will evaluate
if the context of the situation in China and USA will change the conclusions.

 9
CAN FUEL CELLS BECOME A MASS-PRODUCED OPTION GLOBALLY FOR HEAVY-DUTY TRUCKS 2030+?

2 Total Cost of Ownership Model
2.1 OVERVIEW OF MODEL
In this report, Total Cost of Ownership (TCO) of a heavy duty truck is all costs
associated with having a vehicle for the first owner.

As an example, the Swedish consultancy firm WSP calculated the TCO for a long
haul truck in Sweden (table 1). The cost of owning and buying a truck entails
different cost categories divided into fixed, running and driver expenses.
Table 1 Average TCO of a Tractor (emission standard EURO 5 and three axles) for the year 2014 in Sweden.
Purchase of trailer not included (WSP, 2014) (2)

 Category Cost type Cost %

 Fixed Costs Depreciation, fixed 3 190 € 2014 /year 2,1

 Finance 2 380 € 2014 /year 1,6

 Fixed Taxes 2 140 € 2014 /year 1,4

 Insurance 3 130 € 2014 /year 2,1

 Other fixed costs 3 880 € 2014 /year 2,6

 Running Costs Fuel (Diesel) 48 800 € 2014 /year (1) 33

 Depreciation, running 9 570 € 2014 /year (1) 6,4

 Maintenance 7 720 € 2014 /year (1) 5,2

 Tires 3 910 € 2014 /year (1) 2,6

 Driver Costs Salary 47 600 € 2014 /year 32

 Payroll Tax 17 500 € 2014 /year 12
 (1) If 130 000 km/year (2) €1 to 9.6 SEK

All TCO analysis in this report start with the year 2030 and all costs are calculated
based upon €2017.

Our goal in this study is that the costs should be as realistic as possible in an end-
consumer context, and the individual assumptions, limitations and methods used
will be explained.

 10
CAN FUEL CELLS BECOME A MASS-PRODUCED OPTION GLOBALLY FOR HEAVY-DUTY TRUCKS 2030+?

2.2 TCO FORMULA, VARIABLES DEFINED AND EXPLAINED
The Total-Cost-of-Ownership equation used in the report is:

where t is ownership period (years), r is yearly interest rate, tkd is total kilometers
driven during ownership period, and tt is driver’s hours during ownership period.

and where PP is the purchasing price (€) of heavy duty truck, CEC is consumer
energy cost (€/km), RP is the resell price (€) in the end of the ownership period, DC
is the driver cost (€/h), MRC is Maintenance and Repairs Costs (€/km), OC is Other
Costs, such as insurance, and LFF is the less function index, which is a proxy for a
cost penalty because of less payload, due to extra weight/volume of batteries
or/and hydrogen storage tanks.

The purchasing price (€) equation of heavy duty truck is: = ∑K
 (2)

where RPE is retail price equivalent = 1,48 (Reference?).

The consumer energy cost (€/km) equation is:

CEC = fc(EC+InfraC+TaxC) (3)

where fc is fuel consumption (kWh/km), EC is energy cost (€/kWh), InfraC is
infrastructure cost (€/kWh) and TaxC is tax cost (€/kWh).

Several of the variables will have different values depending on geographical area,
powertrain, fuel and transport use case.

LFF is the less-function factor, which is explained in chapter 4.9.

 11
CAN FUEL CELLS BECOME A MASS-PRODUCED OPTION GLOBALLY FOR HEAVY-DUTY TRUCKS 2030+?

3 Goal and Scope
3.1 COMPARED FUEL/POWERTRAIN ALTERNATIVES
Several alternatives exist for future trucks. This study considers several options,
see table 2. However, we focus upon four combinations, see the grey areas.

The four ones are chosen, because the other options have similar TCO
characteristics as at least one of the four. PHEV is outside the scope of this study as
it is an intermediate solution between the two extremes BEV and diesel (ICE).
Table 2 Compared fuel and powertrain

 Abbreviation Fuel type Powertrain type

 Base case Diesel ICE

 D-HEV Diesel HEV

 Efuel-HEV Electrofuel HEV

 D-PHEV Diesel/Electricity PHEV

 Bio-ICE Biofuel ICE

 Bio-HEV Biofuel HEV

 Bio-PHEV Biofuel/Electricity PHEV

 El-BEV Electricity BEV

 El-ERS Electricity ERS/ICE

 Hy-ERS Electricity/Hydrogen ERS

 NG-ICE Natural gas ICE

 NG-ICE Natural gas HEV

 H2-FCV Hydrogen FCV

 H2-FC/PHEV Hydrogen/Electricity FCV/PHEV

 Bio-FC Other C-fuel FCV

 Efuel-FC Electrofuel FCV

 12
CAN FUEL CELLS BECOME A MASS-PRODUCED OPTION GLOBALLY FOR HEAVY-DUTY TRUCKS 2030+?

3.2 CUSTOMER TRANSPORT MISSION PROFILES
The base case for our calculation is long-haul use in Germany 2030+. However, we
also investigate the duty cycle regional delivery and urban delivery.

The main difference between the different use cases is the distance between
refuelling, the yearly mileage and duty cycle. They also have different component
sizing as a consequence of the duty cycle and mission profile.

For example, our base case long haul in Germany has a distance between refuelling
of 500 km and average yearly mileage of 130 000 km/year.
Table 3 List of Customer mission profiles

 Abbreviation Geography Vehicle use

 Base-Long Germany Long Haul

 Base-Reg Germany Regional distribution

 Base-City Germany City distribution

The long-haul vehicle is a tractor with a trailer (up to 40 tons permissible
maximum laden mass), daily distance in the German base case is designed to 500
km between refuelling/recharging and a yearly distance of about 130 000 km/year.

The regional vehicle has a rigid body and no trailer (up to 40 tons permissible
maximum laden mass), daily distance in the German base case is designed to 300
km between refuelling/recharging and a yearly distance of about 60 000 km/year.
The mission profile has lower average speed and more start-and-stop compared to
the long-haul vehicle.

The urban distribution has a rigid body (up to 16 tons permissible maximum laden
mass), daily distance in the German base case is designed to 200 km between
refuelling/recharging and a yearly distance of about 40 000 km/year. The average
speed is lower compared to the regional delivery mission profile.

 13
CAN FUEL CELLS BECOME A MASS-PRODUCED OPTION GLOBALLY FOR HEAVY-DUTY TRUCKS 2030+?

4 General data for all use cases
4.1 FUEL CONSUMPTION (TANK-TO-WHEEL) FOR POWERTRAIN/FUEL
 COMBINATIONS
Fuel consumption is Tank-Wheel, therefore the energy losses from recharging are
not included in the energy uses from an electric truck but included in cost for
recharging.

Energy use for different duty cycle, powertrains and geographical areas are
available in Table 4.
Table 4 Fuel consumption (tank-to-wheel) different fuel/powertrain and mission profiles

 Fuel/ Geography Vehicle use kWh/km Reference
 Powertrain

 D-ICE Germany Long Haul 3,3 (1)

 El-BEV Germany Long Haul 1.6 (1)

 El-ERS Germany Long Haul 1.6 (1)

 H2-FCV Germany Long Haul 2.8 (1)

 D-ICE Germany Regional distribution 2.9 (1)

 El-BEV Germany Regional distribution 1.1 (1)

 El-ERS Germany Regional distribution 1.1 (1)

 H2-FCV Germany Regional distribution 2 (1)

 D-ICE Germany Urban distribution 2,4 (1)

 El-BEV Germany Urban distribution 0.67 (1)

 El-ERS Germany Urban distribution 0.67 (1)

 H2-FCV Germany Urban distribution 1,2 (1)
 (1) Own assumptions based upon stakeholder discussions and Burke (2018),
 Kleiner (2017), Lee et al (2018), AFLEET Tool. (2017).

 14
CAN FUEL CELLS BECOME A MASS-PRODUCED OPTION GLOBALLY FOR HEAVY-DUTY TRUCKS 2030+?

4.2 HYDROGEN COST
Hydrogen can be produced from many primary energies. The hydrogen cost
depends on several factors, among them:

• Cost of primary energy (electricity, coal, methane...)
• Cost of production equipment (electrolyser, reformer, CCS...)
• Cost of transport to the refuelling stations (truck, pipeline, on-site
 production...)
• Cost of refuelling station (capacity, 350 or 700 bar, utilisation rate...)

This incomprehensive list indicates that the number of possible combinations is
very large. Some technologies and solutions are developing rapidly, which
contributes to the difficulty to assess the hydrogen cost.

Analogously to electricity, it is likely that hydrogen will be produced and
distributed differently in various regions of the world. This implies that the
hydrogen cost probably will differ as well. But unlike electricity, hydrogen will
potentially be shipped between countries in large scale. If this happens and the cost
of transport is limited, it will lead to an internationally rather similar cost of
hydrogen.

If hydrogen is produced using electricity, it could be argued that the hydrogen cost
must be higher than the electricity cost, due to losses in the conversion as well as
cost of equipment. However, this can to some extent be compensated by the lower
costs of hydrogen storage, compared to the storage of electricity. Given an
increasing global share of renewable electricity from intermittent sources such as
sun or wind, the energy storage needs will increase.

Among all studies of hydrogen, few try to span several continents, several
production and distribution methods and several time perspectives. However, at
least one does, the Technology Roadmap – Hydrogen and Fuel Cells (IEA, 2015).
This report states a cost of hydrogen today between less than 1 USD/kg (natural
gas reforming in the United States) and 6 USD/kg (electrolysis in Japan), excluding
transport and distribution. The costs will develop until 2050, making the
production alternatives and regions in the world slightly less different. Hydrogen
cost at the refuelling station is also indicated, but only for cars and only in the US.
The cost per gasoline litre equivalent is expected to stabilise on 1.6 USD (+/- 30%)
when the refuelling network has been established. This corresponds to 6 USD/kg
hydrogen. The production mix is not indicated but the scenario is based on a
maximum climate change of 2 degrees Celsius.

A more recent study focusing on hydrogen from electricity (Greensight, 2017),
indicates a cost of hydrogen from electrolysers for trucks between 45 – 55 NOK/kg.
This corresponds to 5.7 – 7 USD/kg hydrogen.

Therefore, we use 0.18 €/kWh or approximately 6 USD/kg for the hydrogen fuel
cost including infrastructure cost.

 15
CAN FUEL CELLS BECOME A MASS-PRODUCED OPTION GLOBALLY FOR HEAVY-DUTY TRUCKS 2030+?

4.3 INFRASTRUCTURE COST ELECTRIC ROAD SYSTEMS
This section describes how the cost for electricity from electric road systems have
been estimated. The cost is estimated to be 0.23 €/kWh which includes cost for
producing and distributing the electricity, as well as the cost for the electric road
system itself. It is based on electricity prices for industry in Germany and
estimated cost for building the electric road systems. The cost model group the
costs into categories.

• Cost for buying the electric energy
• Annual cost for grid connection (not depending on energy use)
• Cost for the electric road system
• Cost for the grid connection

The cost model calculates an cost contribution from these costs, per kWh of energy
the ERS system delivers. A key factor for the cost is how much the ERS is used.
This can be defined as a utilization factor which is the annual energy delivered by
the ERS divided by the theoretical maximum energy it can deliver. Since a year has
8760 hours, 1 kW of installed power can theoretically deliver 8760 kWh per year.
Due to the ERS being used much less some times of the year, like for example
nights and part of the weekends, and since the ERS system has to be sized for the
peak load the worst hour of the year, the average utilization of the ERS system has
been assumed to be 20%. This is a fairly high value, given the few hours per day
that a road operates at its highest traffic density.

4.3.1 Cost for buying electric energy
The cost for electricity has been based on German electricity prices for 2016, from
Eurostat. The total price excl. VAT was 0.149 €/kWh, of which 0.044 €/kWh was
cost for the electricity, 0.036 €/kWh was cost for the grid and 0.07€/kWh was non-
recoverable taxes. Since the grid cost is not directly related to how much energy is
used it is excluded from the cost for the actual energy used.

After subtracting the grid cost from the statistics, the remaining direct cost for
electric energy is
 = 0.044 €/kWh + 0.070 €/kWh = 0.114 €/kWh.

4.3.2 Annual cost for grid connection
In the Eurostat data the grid fee has been expressed as an average cost of 0.036
€/kWh, but in most grids it is payed as an annual cost which is determined by the
installed power and not by the used energy. Therefore, the grid cost has been
translated into an annual cost of 63 €/kW/yr, which corresponds to the average
grid cost 0.036 €/kWh given in the Eurostat statistics if the utilization factor of the
grid connection is 20%

 = 63 €/(kW*yr)

 16
CAN FUEL CELLS BECOME A MASS-PRODUCED OPTION GLOBALLY FOR HEAVY-DUTY TRUCKS 2030+?

Since we also assumed that the ERS system has a utilization factor of 20% the
annual grid fee contributes to a cost of
 63 €/(kW∗yr)
 20%∗8760 ℎ/
 = 0.036 €/kWh

4.3.3 Cost for the electric road system
The cost for building the ERS system is assumed to be 2’000’000 €/km, and the
average installed power to be 2000 kW/km, which leads to a specific cost of

 = 1000 €/kW.

The economic life of the ERS has been set to 10 years. When also including the
effect of interest and maintenance cost it has been assumed that the total annual
cost for the ERS is the initial investment divided by 8 years.

 = 8
The annual cost for the ERS, per kW of installed power, is
 1000 €/kW
 = = 125 €/(kW ∗ yr)
 8

With the 20% utilization factor this means that the cost for the ERS contributes to a
cost of
 125 €/(kW∗yr)
 20%∗8760 ℎ/
 = 0.071 €/kWh

4.3.4 Cost for the grid connection
The cost for building the new grid to supply the ERS has one fixed cost per place
the ERS is connected to the grid. This cost is assumed to be 2000 € and one such
connection is made for each km of electric road system.

 = 2000 €/
Each km has a peak power of 2000 kW.

 = 2000

Added to the fixed cost is a grid connection cost per kW of installed peak power,
which has been estimated to 250 €/kW.

 = 250 €/
The investment in the grid supplying the electric road has been assumed to have
an economic life of 20 years, which is adjusted to 16 years when calculating the
annual cost, to include the effect of interest and maintenance.

 = 16

 17
CAN FUEL CELLS BECOME A MASS-PRODUCED OPTION GLOBALLY FOR HEAVY-DUTY TRUCKS 2030+?

The cost for the grid investments, per year and kW of peak power, can be
calculated as

 � + 2000 €�
 2000 +250 €/
 = = 15.7 €/( ∗ )
 16

With the 20% utilization factor this means that the cost for the grid investment
contributes to a cost of
 15.7 €/(kW∗yr)
 20%∗8760 ℎ/
 = 0.009 €/kWh

4.3.5 Total cost for the electric energy from the ERS
The total cost is simply the sum of the above cost components:

• Energy related costs 0.114 €/kWh
• Annual cost for grid connection 0.036 €/kWh
• Cost for the electric road system 0.071 €/kWh
• Cost for the grid connection 0.009 €/kWh

This results in a total cost of 0.23 €/kWh.

This cost of course change depending on the assumed parameter values. The most
important factor is most likely the influence of the utilization factor. In the below
diagram it is shown how the cost components vary with the utilization factor.

 0.6

 0.5

 0.4
 X 20
 Cost (EUR/kWh)

 Y (Stacked) 0.2303
 0.3
 Y (Segment) 0.008954

 0.2

 0.1

 0
 0 10 20 30 40 50 60 70 80 90 100

Figure 1 Total cost for energy from an ERS as function of its utilization factor in %.
(blue = energy cost, orange = annual fees, purple = cost for ERS investment, green = cost for grid investment)

It can be noticed that the cost can only be reduced rather little, to about 0.17 €/kWh
if the utilization factor is doubled to the very high value 40%. Instead, it can
increase much more, up to 0.58 €/kWh if the utilization factor drops to only 5%. So,
it is very important for the cost of ERS that the utilization factor is high.

 18
CAN FUEL CELLS BECOME A MASS-PRODUCED OPTION GLOBALLY FOR HEAVY-DUTY TRUCKS 2030+?

4.4 INFRASTRUCTURE COST BEV (NOT ERS) RECHARGING
The costs for stationary charging can be calculated with a cost model which is very
similar to the cost model for the ERS. The total cost is 0.20 €/kWh, which is a little
lower than for ERS, due to a lower investment cost for stationary chargers than for
the ERS. This cost includes

• Cost for buying the electric energy
• Annual cost for grid connection (not depending on energy use)
• Annual cost for land rent
• Cost for the chargers
• Cost for the grid connection

Just like for the ERS, the utilization factor for the chargers is a key factor for the
cost. We have assumed that the utilization factor for stationary chargers is 20%,
just like for the ERS.

4.4.1 Cost for buying electric energy
The cost for electricity is the same as for the ERS
 = 0.114 €/kWh.

4.4.2 Annual cost for grid connection
The grid cost is the same as for the ERS, and we assume one grid connection per
charging station.

 = 63 €/(kW*yr)
Since we also assumed that the chargers have a utilization factor of 20% the annual
grid fee contributes to a cost of
 63 €/(kW∗yr)
 20%∗8760 ℎ/
 = 0.036 €/kWh

4.4.3 Annual cost for land rent
Unlike the ERS, chargers need extra space, apart from the road they serve.
Therefore, there is a land rent added to the annual cost of the chargers. This cost
can most likely vary very much, depending on how far from a city the charger is.
In this case we have assumed the land rent, per charger and year, to be

 = 1000 €/(charger*yr)
Since each charger is 500 kW this cost is

 = 2 €/(kW ∗ yr)
 500

With the 20% utilization factor this means that the land rent contributes to a cost of
 2 €/(kW∗yr)
 20%∗8760 ℎ/
 = 0.001 €/kWh

 19
CAN FUEL CELLS BECOME A MASS-PRODUCED OPTION GLOBALLY FOR HEAVY-DUTY TRUCKS 2030+?

4.4.4 Cost for the chargers
The cost for building the chargers is modelled as one fixed cost per charger unit
and one cost scaling with the charger power

 ℎ = 400 €/unit

 ℎ = 500 €/kW

We assume that each charging station has 4 chargers of 500 kW each. Note that
variations in charger power only has very small effect on the cost for charging, if
the utilization factor is constant. This is shown in a diagram in section 4.4.6.
The economic life of the chargers is assumed to be the same as for the ERS

 ℎ = 8
The annual cost for the four 500-kW chargers, per kW of installed power, is
 4∗ ( ℎ ∗500 + ℎ )
 = 62.6 €/(kW ∗ yr)
 4∗500 ∗ ℎ

With the 20% utilization factor this means that the cost for the chargers contributes
to a cost of
 62.6 €/(kW∗yr)
 20%∗8760 ℎ/
 = 0.036 €/kWh

4.4.5 Cost for the grid connection
The cost for building the new grid to supply the charging station has a fixed part.
This cost is assumed to be 2000 €, like for the ERS, and one such connection is
made for each charging station.

 = 2000 €/
Each charging station has a peak power of 2000 kW (4*500 kW).

 = 2000

Added to the fixed cost is a grid connection cost per kW of peak power, which is
the same as for the ERS

 = 250 €/
The investment in the grid supplying the chargers has been assumed to have an
economic life of 20 years, which is adjusted to 16 years when calculating the annual
cost, to include the effect of interest rates and maintenance.

 = 16
The cost for the grid investments, per year and kW of peak power, can be
calculated as

 � ℎ + 2000 €�
 2000 +250 €/
 = = 15.7 €/( ∗ )
 16

 20
CAN FUEL CELLS BECOME A MASS-PRODUCED OPTION GLOBALLY FOR HEAVY-DUTY TRUCKS 2030+?

With the 20% utilization factor this means that the cost for the grid investment
contributes to a cost of
 15.7 €/(kW∗yr)
 20%∗8760 ℎ/
 = 0.009 €/kWh

4.4.6 Total cost for the electric energy from the chargers
The total cost is simply the sum of the above cost components.

• Energy related costs 0.114 €/kWh
• Annual cost for grid connection 0.036 €/kWh
• Annual cost for land rent 0.001 €/kWh
• Cost for the electric road system 0.036 €/kWh
• Cost for the grid connection 0.009 €/kWh

This results in a total cost of 0.20 €/kWh.

Just like for the ERS the most important factor for the cost is most likely the
utilization factor. In the below diagram it is shown how the cost components vary
with the utilization factor.

 0.6

 0.5

 0.4
 Cost (EUR/kWh)

 X 20
 0.3 Y (Stacked) 0.1958
 Y (Segment) 0.008954
 0.2

 0.1

 0
 0 10 20 30 40 50 60 70 80 90 100

Figure 2 Total cost for energy from stationary chargers as function of its utilization factor in %.
(blue = energy cost, red = land rent, orange = annual fees, purple = cost for charger investment, green = cost
for grid investment)

The cost variation, if the power of the chargers is changed, is plotted in the below
diagram. Note that the number of chargers change such that the total power of all
chargers in the charging station is always 2000 kW, and the utilization factor is not
varied. This means that a higher charger power requires less chargers to service the
same vehicles. This is the reason why the cost for the electricity is almost the same,
irrespective of charger power.

 21
CAN FUEL CELLS BECOME A MASS-PRODUCED OPTION GLOBALLY FOR HEAVY-DUTY TRUCKS 2030+?

 0.6

 0.5

 0.4
 Cost (EUR/kWh)

 0.3

 0.2

 0.1

 0
 0 200 400 600 800 1000 1200 1400 1600 1800 2000

 Charger Power (kW)

Figure 3 Total cost for energy from stationary chargers as function of the power of the chargers.
(blue = energy cost, red = land rent, orange = annual fees, purple = cost for charger investment, green = cost
for grid investment)

4.5 COMPONENT COSTS

Table 5 provides the component costs used in the TCO calculation. The values are
assumed to represent the costs for the truck manufacturer.

Table 5 Component costs for the OEM (for year 2030)
 Component €/unit Unit Reference
 Pantograph/Current 18 000 # (1)
 Collector for ERS
 Glider (Long haul) 56 000 # (1)
 Trailer (Long Haul) 21 000 # (1)
 Glider (Regional) 38 000 # (1)
 Glider (Urban) 28 000 # (1)
 ICE-engine 60 kW (1)
 Treatment system 30 kW ICE (1)
 Gearbox 20 Kg gearbox (1)
 Dieseltank 2 Litre (1)
 Fuel Cell (PEM) 50 kW (1)
 Hydrogen storage 10 kWh (1)
 Electric machine 10 kW (1)
 Power electronics 6 kWh (1)
 Energy Battery 150 kWh (1)
 (1) Own assumptions but based upon stakeholder input and Kleiner (2017).

 22
CAN FUEL CELLS BECOME A MASS-PRODUCED OPTION GLOBALLY FOR HEAVY-DUTY TRUCKS 2030+?

4.6 COMPONENT SIZING AND PURCHASE PRICE FOR VEHICLE TYPES
Table 6, Table 7 and Table 8 present the purchase price of different vehicle types.
The purchase price is assumed to be the same in all countries 2030.
Table 6 Purchase price long-haul tractor with trailer (2030), battery size and hydrogen storage size are
calculated based upon fuel economy(table 4), distance between refueling 500 km and 80% depth-of-discharge
for the batteries (2).
 Diesel Battery Electric ERS Fuel Cell

 Size Cost Size Cost Size Cost Size Cost

 Current 1 18 000
 Collector for
 ERS
 Glider (long 1 56 000 1 56 000 1 56 000 1 56 000
 haul)
 Trailer 1 21 000 1 21 000 1 21 000 1 21 000

 ICE 335 20 100

 Treatment 335 10 050
 system
 Gearbox 300 6 000 100 2 000 100 2 000 100 2 000

 Dieseltank 400 800

 Fuel Cell 335 16 750
 (PEM)
 Hydrogen 1375 13 750
 Storage
 Electric 335 3 350 335 3 350 335 3 350
 Machine
 Power 335 2 010 335 2 010 335 2 010
 Electronics
 Energy 1000 150 000 100 15 000 50 7 500
 Battery
 Sum (OEM 113 950 234 360 117 360 122 360
 Costs)
 Retail price 1.48 1.48 1.48 1.48
 equivalent
 (RPE)
 Purchase 167 000 347 000 174 000 181 000
 Price
 (1) Based upon Kleiner (2017), but also own assumptions and stakeholder
 input.

 (2) 80% is often used for electric buses with larger batteries. Furthermore, we
 assume that the battery is dimensioned for 80% utilization, that does not
 mean that you always use it.

 23
CAN FUEL CELLS BECOME A MASS-PRODUCED OPTION GLOBALLY FOR HEAVY-DUTY TRUCKS 2030+?

Table 7 Purchase price regional truck (2030), battery size and hydrogen storage are calculated based upon fuel
economy (see table 4), distance between refueling 300 km and 80% depth-of-discharge.
 Diesel Battery Electric ERS Fuel Cell

 Size Cost Size Cost Size Cost Size Cost

 Current 1 18 000
 Collector for
 ERS

 Glider (long 1 38 000 1 38 000 1 38 000 1 38 000
 haul)

 ICE 335 20 100

 Treatment 335 10 050
 system

 Gearbox 300 6 000 100 2 000 100 2 000 100 2 000

 Dieseltank 400 800

 Fuel Cell 335 16 750
 (PEM)

 Hydrogen 473 4 728
 Storage

 Electric 335 3 350 335 3 350 335 3 350
 Machine

 Power 335 2 010 335 2 010 335 2 010
 Electronics

 Energy Battery 412,5 49 253 100 15 000 50 7 500

 Sum (OEM 74 950 107 613 78 360 75 610
 Costs)

 Retail price 1.48 1.48 1.48 1.48
 equivalent
 (RPE)

 Purchase 111 000 159 000 116 000 110
 Price 000

 (1) Based upon Kleiner (2017), but also own assumptions and stakeholder
 input.

 24
CAN FUEL CELLS BECOME A MASS-PRODUCED OPTION GLOBALLY FOR HEAVY-DUTY TRUCKS 2030+?

Table 8 Purchase price urban truck (2030), battery size and hydrogen storage are calculated based upon fuel
economy(se table 4), distance between refueling 200 km and 80% depth-of- discharge

 Diesel Battery Fuel Cell
 Electric

 Size Cost Size Cost Size Cost

 Glider (Urban) 1 28 000 1 28 000 1 28 000

 ICE 150 9 000

 Treatment 150 4 500
 system

 Gearbox 100 2 00 100 2 000 100 2 000

 Dieseltank 400 800

 Fuel Cell (PEM) 150 5 000

 Hydrogen 240 2 400
 Storage

 Electric 150 1 500 150 1 500
 Machine

 Power 150 900 150 900
 Electronics

 Energy Battery 167 25 000 10 1 500

 Sum (OEM 44 300 57 400 41 300
 Costs)

 Retail price 1.48 1.48 1.48
 equivalent
 (RPE)

 Purchase Price 66 000 85 000 61 000

 (1) Based upon Kleiner (2017), but also own assumptions and stakeholder
 input.

 25
CAN FUEL CELLS BECOME A MASS-PRODUCED OPTION GLOBALLY FOR HEAVY-DUTY TRUCKS 2030+?

4.7 MAINTENANCE COSTS, SALARY COSTS AND OTHER COSTS
The maintenance costs are calculated based on km/year. The values used are
presented in Table 9. Tires are included in maintenance costs.

The maintenance costs in Table 9 are used for all vehicle types even though it could
be argued that different costs apply for different types.
Table 9 Maintenance cost for long-haul, regional and urban truck
 Vehicle $/vehicle km

 ICE_Diesel 0.147 Kleiner et al (2017c)

 BEV 0.098 Kleiner et al (2017c)

 ERS 0.098 Kleiner et al (2017c)

 FCV 0.103 Kleiner et al (2017c), but
 also own assumption

Other costs, for example insurance, are 10 000 €/year for all vehicle types.

The hourly salary is different between different countries. However, we assume
2000 hours/year as work load.

4.8 OWNERSHIP PERIOD, RESALE VALUE AND INTEREST RATE
For all use case the ownership period is seven years. The resale value after seven
years is assumed to be 22%. Based upon discussion with stakeholders.

Interest rate for truck operations is 8% (Steinbach et al, 2015).

4.9 LESS FUNCTION FACTORS
Sometimes, a change of fuel or powertrain has an impact for the vehicle owner and
user. In some cases, the change only implies a more restricted number of refuelling
stations. In other cases, it leads to reduced cargo capacity and other consequences
having a direct impact on the total cost of ownership. Electrification with hydrogen
and fuel cells as well as with batteries has the following potential consequences:

• Reduced cargo capacity (volume and/or weight) – depending on range
 requirements
• Reduced availability of refuelling or recharging stations during an
 introduction period
• Longer time needed for refuelling or recharging – in particular for battery
 electric vehicles.

The most demanding application in relation to these potential restrictions is long haul.
Obviously, there are also potential positive consequences, among them improved
acceleration and access to areas and time periods where or when diesel trucks are
not permitted.

 26
CAN FUEL CELLS BECOME A MASS-PRODUCED OPTION GLOBALLY FOR HEAVY-DUTY TRUCKS 2030+?

Given the limited scope of this study, we do not manage to analyse all potential
factors influencing the function of electrified vehicles. However, we attempt to
address the probably most important negative one; reduced cargo capacity.

Most studies of electrified vehicles neglect the less function factor. If they include
it, they typically check if the vehicle meets the specification in terms of range. If so,
it is considered fully functional, otherwise it is not considered at all. Our approach
is to calculate the approximate additional weight and volume that the change to
hydrogen or batteries implies. The calculation includes weight and volume savings
thanks to the removal of the diesel powertrain including the diesel tank, as well as
the additional weight and volume caused by the electric powertrain with batteries
and, for fuel cell vehicles, also hydrogen storage.

It is preferred that the truck carries the complete powertrain including the energy
storage. The truck design in Europe has limited space (compared to the US design).
The additional volume and weight caused by the electric powertrain including
energy storage is assumed to reduce the cargo capacity to an equal extent. There
might be a design constraint caused by the allowed maximum weight per wheel
axle. This constraint is not considered in our calculations.

Finally, the reduced cargo capacity is assumed to increase the total cost
correspondingly, even though vehicles obviously not always will be used with
100% cargo. As the ‘less function factor’ is calculated on the total cost of
ownership, including wages, it has a large influence on the total cost.

Below is a table illustrating the calculation of the LFF for hydrogen storage at 700
bars. To incorporate the LFF, the total cost has been multiplied by the factor in the
columns to the right in the table. For example, for a range of 700 km, the increased
weight leads to an increased cost of 4%.
Table 10 Less Function Factor for Hydrogen Storage (700 bar)

 Hydrogen storage Net increase (%) TCO LFF
 Weight Volume
Range (km) (kg) (m3) Weight Volume Weight Volume
 100 283 0,4 -0,6% -0,1% 0,99 1,00
 200 566 0,8 0,2% 0,3% 1,00 1,00
 300 849 1,2 1,0% 0,8% 1,01 1,01
 400 1 132 1,6 1,8% 1,2% 1,02 1,01
 500 1 415 2,0 2,5% 1,7% 1,03 1,02
 600 1 698 2,3 3,3% 2,2% 1,03 1,02
 700 1 981 2,7 4,1% 2,6% 1,04 1,03
 800 2 264 3,1 4,9% 3,1% 1,05 1,03
 900 2 547 3,5 5,7% 3,5% 1,06 1,04
 1000 2 830 3,9 6,5% 4,0% 1,07 1,04

 27
CAN FUEL CELLS BECOME A MASS-PRODUCED OPTION GLOBALLY FOR HEAVY-DUTY TRUCKS 2030+?

Similarly, the table below for battery electric propulsion shows that the weight
increase is dominating for the LFF penalty.
Table 11 Less Function Factor Battery storage

 Battery system Net increase (%) TCO LFF
 Range Weight Volume
 (km) (kg) (m3) Weight Volume Weight Volume
 100 800 0,4 -0,6% -0,7% 0,99 0,99
 200 1 600 0,8 1,7% -0,2% 1,02 1,00
 300 2 400 1,2 3,9% 0,2% 1,04 1,00
 400 3 200 1,6 6,1% 0,7% 1,07 1,01
 500 4 000 2,0 8,3% 1,2% 1,09 1,01
 600 4 800 2,4 10,6% 1,6% 1,12 1,02
 700 5 600 2,8 12,8% 2,1% 1,15 1,02
 800 6 400 3,2 15,0% 2,6% 1,18 1,03
 900 7 200 3,6 17,2% 3,0% 1,21 1,03
 1000 8 000 4,0 19,4% 3,5% 1,24 1,04

The less function factor presented is an important factor for the total cost of the
different compared powertrains. However, it is only when the cargo is on the
weight or volume limit which this factor has its full effect. In some situations, the
cargo is not so heavy or does not need so much volume and for such transports the
factor will be lower. Therefore, the LFF cost shall not be interpreted as a cost which
always burdens the TCO of a certain type of powertrain.

A powertrain type with a high LFF, but apart from that a low TCO, may find
niches in which it can have a lower cost than the alternatives, as long as it only
transport light cargo.

 28
CAN FUEL CELLS BECOME A MASS-PRODUCED OPTION GLOBALLY FOR HEAVY-DUTY TRUCKS 2030+?

5 Yearly driving distance, driver salary and
 energy prices in China, Germany and USA
5.1 YEARLY DISTANCE FOR DIFFERENT MISSION PROFILES AND
 COUNTRIES
Table 12 shows the yearly distance for different mission profiles in different
countries.
Table 12 Yearly distance different mission profile and country (km/year) – Own assumptions, but based upon
GFEI (2017), ICCT (2015b).
 Germany USA China

 Long Haul 130 000 160 000 70 000

 Regional 60 000 75 000 30 000

 Urban 40 000 50 000 20 000

5.2 ENERGY PRICES IN GERMANY, USA AND CHINA
Table 13 provides the numbers used for energy prices 2030. The tax used for diesel,
hydrogen and electricity is based upon the assumption of use a road tax, but also
some taxation for the carbon-content of the fuel.
Table 13 Energy Prices in Germany, USA and China year 2030+, Own Assumptions, but based upon IEA (2017)
 Germany USA China

 Electricity energy 0.15 0.12 0.10
 cost
 Electricity 0.03 0.03 0.03
 infrastructure cost
 (BEV)
 Electricity 0.06 0.06 0.06
 infrastructure cost
 (ERS)
 Electricity tax 0.02 0.01 0.01
 (road)
 Diesel energy cost 0.11 0.11 0.11
 (incl. infrastructure)
 Diesel tax cost 0.05 0.01 0.01

 Hydrogen energy 0.16 0.16 0.16
 cost
 Hydrogen 0.02 0.02 0.02
 infrastructure cost
 Hydrogen tax cost 0.02 0.01 0.01

 29
CAN FUEL CELLS BECOME A MASS-PRODUCED OPTION GLOBALLY FOR HEAVY-DUTY TRUCKS 2030+?

5.3 SALARY DRIVER GERMANY, USA AND CHINA
Table 12 presents an estimation of salaries for truck drivers in Germany, USA and
China for the year 2030.
Table 14 Salary drive Germany, USA and China (2030) $/hour. Own Assumptions
 Germany USA China

 Salary (€/hour) 33 27 14

 30
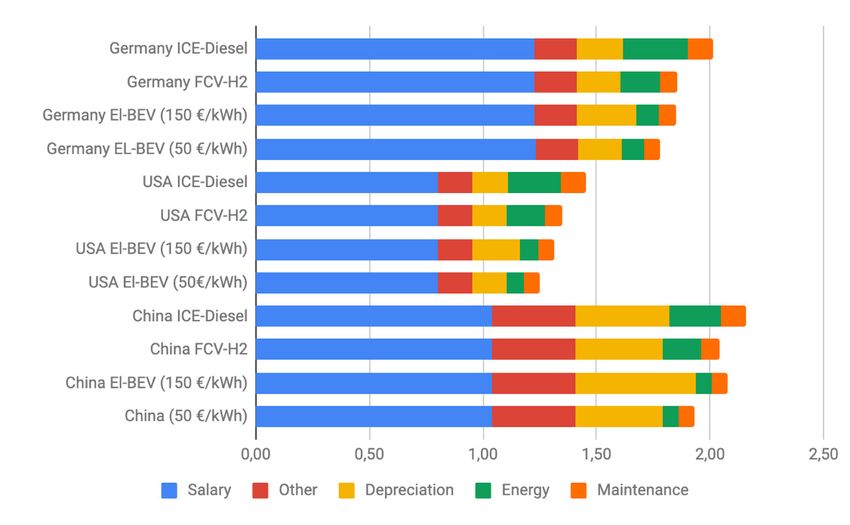
CAN FUEL CELLS BECOME A MASS-PRODUCED OPTION GLOBALLY FOR HEAVY-DUTY TRUCKS 2030+?

6 TCO Results
6.1 LONG HAUL GERMANY, USA AND CHINA
Figure 1 compares the total-cost-of-ownership results obtained for different
geographical areas, powertrains and fuel for the mission profile long haul.

What stands out in Figure 1 is that Electric Road Systems are the most cost-efficient
options in all regions, even if battery packs are as cheap as 50 €/kWh. A possible
explanation for this might be that the cost of the infrastructure for the electric road
systems is not significant if well utilized and the ERS truck is cheap compared with
a battery electric long haul truck. Not considered here, but potentially important
for the ERS solution, is the need for a certain coverage of charging networks.

The present study was designed to assess the competitiveness of fuel cell trucks. In
all regions, fuel cell trucks and hydrogen are more expensive than diesel trucks
and diesel. The difference is not massive. However, the cost of fuel cell truck and
diesel trucks is similar. The primary variable explaining the cost difference is the
cost of hydrogen and diesel. One significant result of our study is if hydrogen is
relatively cheap, it will be able to compete with diesel long term.

Fuel cell trucks compared with battery electric trucks are more cost-efficient in
Europe and China, but not in the USA. This result is valid if the battery costs
150€/kWh. If the battery cost is as low as 50€/kWh, the battery electric truck will be
cheaper in all regions. Our use of the Less Function Factor (LFF) also affects the
comparative result.

The ranking of the propulsion systems is similar in all three geographical areas, but
the costs are not. The main explanation why the costs differ is that the yearly
mileage differs substantially but the vehicle depreciation and the ‘Other’ post are
the same in absolute values and thus much higher per kilometer in China, where
the total mileage is low.

 31
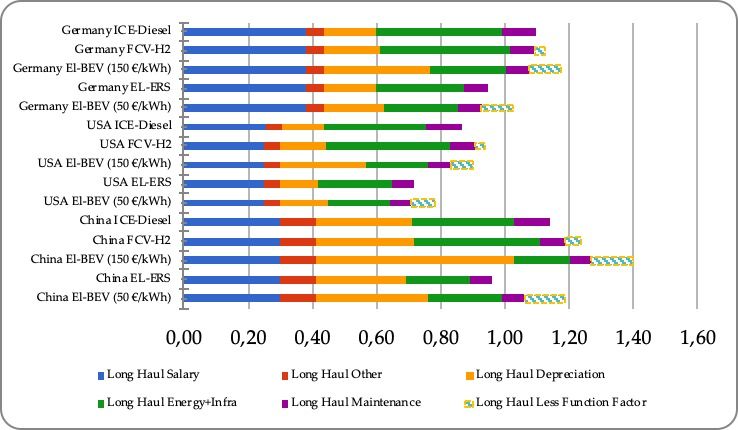
CAN FUEL CELLS BECOME A MASS-PRODUCED OPTION GLOBALLY FOR HEAVY-DUTY TRUCKS 2030+?

Figure 4 TCO (€/vehicle,km) 2030 Long Haul Germany, USA and China. Sensitivity analysis included if battery
pack costs 50 €/kWh or 150 €/kWh.

6.2 REGIONAL TRUCKS GERMANY, USA AND CHINA
As shown in Figure 2, Fuel Cell trucks for regional use are more cost-efficient than
diesel trucks in all regions. The difference between the transport mission long haul
and regional are more start-stop and more urban traffic in the regional case.
Therefore, the energy-efficiency difference tank-to-wheel between an electric
powertrain, with braking energy recuperation, and diesel powertrain are changed.
One option to reduce the energy use of a diesel powertrain is to use a hybrid.
However, this is outside the scope of this study.Generally, the battery electric
trucks and Electric Road systems are more competitive than fuel cell trucks, except
in China where the short annual driving distance make the BEV slightly more
expensive than the fuel cell truck. If battery packs cost is as low as 50 €/kWh, the
battery electric truck is the low-cost option compared to electric road systems.

Another main conclusion for the regional truck case is that the relative importance
of the cost of the truck and the salary increase compared to the long haul case. For
example, in China the yearly distance of the regional truck is low compared to the
USA. Therefore, the cost of deprecation dominates in China besides the value of
the salary.

The analysis assumes that all types of vehicles can operate without any restrictions
and the LFF is thus zero. This is assumed since the vehicle needs less energy stored
onboard due to the shorter driving rage, and regional distribution trucks are less
often than long haul trucks operating on the limit for weight or size. A closer look
at specific applications might reveal cases when it is not possible to replace a diesel
truck with an electrified truck without consequences. It could also be discussed if
ERS is possible in cities.

 32
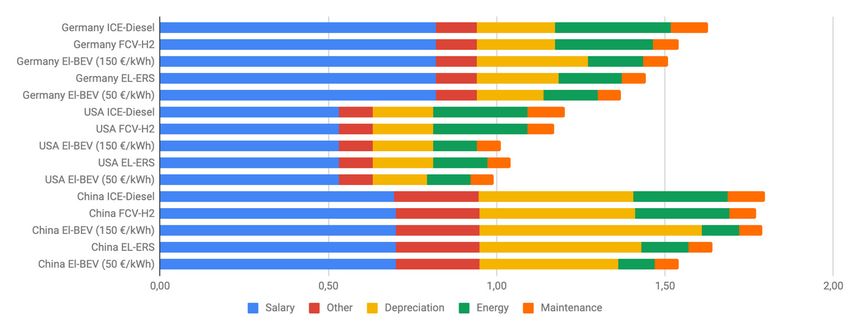
CAN FUEL CELLS BECOME A MASS-PRODUCED OPTION GLOBALLY FOR HEAVY-DUTY TRUCKS 2030+?

Figure 5 TCO (€/vehicle,km) 2030 Regional Germany, USA and China. Sensitivity analysis included if battery
pack costs 50 €/kWh or 150 €/kWh.

6.3 URBAN TRUCKS GERMANY, USA AND CHINA
From figure 3, we can see that for urban trucks, the fuel cell truck is competitive
compared to the diesel trucks. As for the regional distribution trucks there is no
less function cost for urban distribution trucks.

In Germany the battery electric truck has about the same cost as a fuel cell truck if
the battery cost is about 150€/kWh. If the cost of the battery pack is as low as 50
€/kWh than the battery electric truck is cheapest.

Since the yearly distance driven is low for an urban truck compared to long haul,
the relative importance of the cost of energy and infrastructure is reduced. Salary
costs become the dominating cost, which implies that the vehicle must allow for an
efficient use.

When the TCO is compared the different powertrains rank in the same order for
urban distribution trucks as for regional distribution trucks, even in the relative
difference may be a different. So, a type of power train which is cost effective for
an urban distribution truck typically is it also for regional distribution, and vice
versa.

 33
CAN FUEL CELLS BECOME A MASS-PRODUCED OPTION GLOBALLY FOR HEAVY-DUTY TRUCKS 2030+?

Figure 6 TCO (€/vehicle,km) 2030 Urban trucks Germany, USA and China. Sensitivity analysis included if
battery pack costs 50 €/kWh or 150 €/kWh.

6.4 FACTORS WITH A HIGH TOTAL COST IMPACT
Several of the data used in this study is uncertain. In table 15 shows an attempt to
categorise the factors how much they influence the final result and how uncertain
they are.
Table 15 Factors influencing the final TCO results

 Low total cost impact High total cost impact

 High Cost of fuel cell system Cost of hydrogen,
 uncertainty Cost of hydrogen storage electricity, diesel
 Cost of electric machine Residual value of BEV,
 FCV
 Less transport efficiency
 Km between refuelling
 Battery life length
 Cost of battery

 Low Not listed Total mileage
 uncertainty Powertrain efficiencies
 Maintenance costs

 34
CAN FUEL CELLS BECOME A MASS-PRODUCED OPTION GLOBALLY FOR HEAVY-DUTY TRUCKS 2030+?

7 Discussions
This study set out with the aim of assessing the competitiveness of fuel cell trucks.
Our focus is the TCO for the first owner. Several assumptions about energy use,
cost of components and energy are uncertain. Our results, therefore, need to be
interpreted with caution.

The main goal of this study is not to calculate the absolute numbers but to try to
assess the most critical factors influencing the results.

As shown, the cost of fuel or electricity has a large impact on the TCO, especially in
the long-haul case. The cost of hydrogen will probably vary between different
geographical areas. The same is valid for electricity. For example, we have
assumed the same price of electricity everywhere in the USA. In reality, the price
varies substantially between different cities. The price could also vary between
night and day, for example.

Another aspect relating to electricity is that energy and power cost must be
handled separately. High power charging directly from the grid might lead to high
costs as the grid needs to be reinforced.

In our study, we have tried to assess the consequences of reduced cargo capacity
because of the weight or volume of extra battery or hydrogen storage. Our
approach could be discussed, but the potential effects of limit cargo capacity
should be assessed.

One limitation of our study is not to include plug-in hybrids. Plug-in hybrids are
generally a solution for vehicles which most days drive a certain distance, for
which the battery is sized, but sometimes they need to drive longer, which the
engine or fuel cell can enable. Their main advantage is that the battery can be made
smaller, but still provide a very large fraction of the energy, while the much
cheaper fuel or hydrogen tank can provide a few long trips. Such a vehicle can
combine the possibility to mainly use cheap electricity, and only use the more
expensive fuel for a low number of long trips. They are generally interesting
mainly for trucks that have irregular daily driving ranges, and we have not
included that type of driving in our analysis.

However, other factors than cost could influence the willingness to buy a fuel cell
truck. Compared to a diesel truck, the hydrogen truck could have advantages,
such as accessibility to low-emission zones. Compared to battery electric truck, the
limits of available power could be a problem for a high-power charging
infrastructure for at battery electric trucks. The fuel cell truck could have more
flexibility in accepting transport missions than a battery electric truck because the
battery capacity could set limits. The electric road system could be limited because
there is a need for high utilization to make the system cost-effective. Fuel cell
trucks and hydrogen infrastructure could be more manageable to stepwise build
up.

The report has compared TCO, but for a fairer comparison, more detailed studies
of charging time or battery load will affect the transport efficiency are needed. For

 35
CAN FUEL CELLS BECOME A MASS-PRODUCED OPTION GLOBALLY FOR HEAVY-DUTY TRUCKS 2030+?

example, long charger times could have consequences for the complete the supply
chain. The study has included the Less Function Factor to asses some of the effects,
but it is a rough assessment.

 36
CAN FUEL CELLS BECOME A MASS-PRODUCED OPTION GLOBALLY FOR HEAVY-DUTY TRUCKS 2030+?

8 Conclusions
PEM fuel cell heavy-duty trucks could be a techno- economically reasonable
solution. However, its potential success on the market depends on several factors,
among them: availability and cost of hydrogen, regulations, incentives and
taxation schemes (for all types of trucks), and techno-economic maturity of fuel
cells and hydrogen storages.

The TCO ((Total-Cost-of-Ownership) calculation assumes that the relative cost per
vehicle-kilometre is an important factor when selecting the type of vehicle.

Energy cost per vehicle-kilometre depends on energy efficiency and cost of
fuel/electricity. For example, the cost of hydrogen is not only production costs, but
also infrastructure cost, such as a refilling station, and taxes.

The relative energy efficiency advantages of electric powertrains compared to
diesel powertrains is less prominent in long haul applications compared to city
distribution. Therefore, the relative competitiveness for diesel is better for long
haul than for city distribution.

Fuel cell trucks are therefore more competitive in regional and urban distribution.
However, that is also the case for battery electric and electric roads systems.

Another reason why battery and fuel cell trucks are more competitive in urban and
regional distribution is the reduced need of batteries and hydrogen storage, which
is expensive components.

Probably the cost of powertrain for a battery electric long-haul truck is more
expensive than for a fuel cell truck. Despite the difference in component costs, the
main explaining variable is the relative cost difference between electricity and
hydrogen per kilometre. Battery electric trucks and ERS trucks have more energy
efficient powertrains compared to fuel cells. Therefore, hydrogen starts with a
disadvantage.

The relationship between hydrogen and electricity costs differs between countries,
regions, and even cities. The cost of hydrogen and electricity is influenced by the
need for long-term storage of energy from sources such as photovoltaics and wind
power. Hydrogen is typically much cheaper to store than electricity. The cost
relationship must be determined through a system analysis modelling several
industrial sectors in the region. An important issue is whether there are good
conditions for storing hydrogen cost-effectively on a large scale.

One challenge in such systems is that surplus of electricity is only periodically
available. The cost of hydrogen from such electricity becomes too high if there is a
low utilisation rate of (maybe about 10-20%) of the electrolyser.

Without clear incentives, most countries will not produce hydrogen from
electricity. The main alternatives are natural gas and coal (with or without CCS).

One part of the cost of fuel for the owner is cost of the infrastructure. The cost of
charging infrastructure, e-highway, heavy duty hydrogen infrastructure depends

 37
You can also read