IS NOW HERE THE NEW ENERGY FUTURE - Amazon AWS
←
→
Page content transcription
If your browser does not render page correctly, please read the page content below

VECTOR : //

                 IS NOW
                 HERE

       THE NEW
       ENERGY
       FUTURE

IR 2018
CREDIT: PHOTOGRAPH SUPPLIED BY CHRIS WEISSENBORN.
2 ——— Vector Lights
4 ——— Did you know?
5 ——— Performance highlights
6 ——— Chairman and Group Chief Executive report
12 ——— Business review
18 ——— Operating statistics
19 ——— Financial overview
20 ——— Financial performance trends
22 ——— Non-GAAP financial information
23 ——— Interim financial statements
41 ——— Directory

VECTOR LIGHTS. BRIDGING THE GAP
BETWEEN WHAT'S POSSIBLE AND WHAT'S
NOW ACCESSIBLE TO EVERYONE.
Vector is focused on leading the creation of a    lasting value for customers, shareholders and
new energy future. A future where new energy      for New Zealand. Vector Lights on Auckland’s
technologies can help make energy more            Harbour Bridge, a showcase for innovative and
affordable, accessible, and sustainable for all   sustainable energy solutions, is powerful proof
communities, businesses, and households. And,     that this new energy future is now here.
ultimately, a future where Vector can deliver
VECTOR LIGHTS
Auckland Harbour Bridge
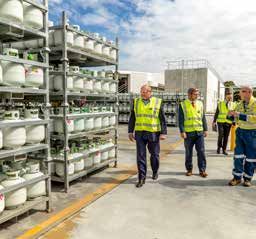
VECTOR’S LIFE
SPIRAL OF ENERGY
Vector Lights is
evidence of a system RENEWABLE
ENERGY BATTERY
of disruptive energy STORAGE
technologies that DIGITAL
delivers more value TECHNOLOGY NETWORK
RESILIENCE
and choice to
consumers, makes
energy supply more
resilient, leads to CHANGING ENERGY
ECONOMICS
more industry
innovation, and
supports a more
sustainable future. INCREASED INNOVATION SUPPORTING A
AND TECHNOLOGY TRANSITION TO A
INVESTMENT LOWER CARBON LOCALISED,
ECONOMY CHEAPER,
CLEANER
ENERGY.
VALUE, CHOICE
AND CONTROL FOR
CONSUMERS
SMARTER, MORE
DISTRIBUTED,
RESILIENT AND
EFFICIENT
ENERGY
NETWORK
LOWER
NETWORK
COSTS
CREATING VALUE FOR CUSTOMERS, FOR THE
ENVIRONMENT, FOR INDUSTRY, FOR SHAREHOLDERS
AND FOR NEW ZEALAND.
Nearly all the technologies
sustainably powering Vector Lights
are now available to households and
businesses. As consumers embrace
these new technologies this will
fundamentally change the way our
energy system works – benefiting
everyone in the process.
2 Vector://IR 18
Energy disruption that benefits all

                                                                                   VECTOR LIGHTS //
    Auckland             —	Vector Lights demonstrates the new energy
                            technologies that are now possible for all
                         —	The power needed for Vector Lights on the
                            Harbour Bridge is matched by renewable energy
                            from solar and battery storage arrays in
                            Wynyard Quarter
    New Zealand          —	What is proven in Auckland shows what’s
                            possible elsewhere
                         —	Having more renewables, more choice, and
                            a greater ability to smooth peaks delivers
                            more value
    Everyday consumers —	The disruptive technologies used by Vector Lights
                          are scalable from projects to cities, right down to
                          individual homes and businesses
                         —	Consumers can lower costs, choose an energy
                            source, control their use and share what they
                            generate. This is the democratisation and
                            localisation of energy
    The environment      —	Increased localisation of generation, less reliance
                            on major infrastructure, less carbon and reduced
                            energy distribution requirements
                         —	Convergence with other sectors (e.g.
                            transport and electric vehicles) enhances
                            environmental impacts
    Energy industry      —	Localised energy sourcing and balanced demands
                            reduces capital intensive infrastructure, increases
                            network resilience and lowers costs
    The technology sector —	More innovation and investment drives further
                             research, idea generation and breakthrough
                             new technologies
    The world’s cities   —	These technologies and integrated systems are
                            already being sought for implementation in other
                            world cities
    Investors            —	These trends reinforce the growing importance of
                            Vector’s role in delivering the new energy future in
                            a rapidly evolving sector.

3                           Vector://IR 18
DID YOU
KNOW?
VECTOR
FACTS://
Vector’s size
Sustainability New technology • Traffic accidents and
and scale • Transport is the • Average household falling trees account
• Vector provides highest contributor electricity for approximately 23%
infrastructure for to Auckland’s consumption has of power outages.
more than 1.5 million gross greenhouse reduced 11% in the
New Zealanders gas emissions at last 10 years, with new Cost to
energy needs. 39.7%, followed by technology enabling consumers
• On call 24/7 to keep stationary energy at energy efficiency. • Average cost to
power flowing. 29.5% and industrial • On average, new Auckland households
processes and product homes use up to 30% for Vector’s role
• 18,607km of overhead use 21.1%.1
and underground less electricity per sqm in keeping power
network. • Over 50,000 rapid than older homes. delivered is $1.23
electric vehicle • Vector is using per day.
• 4,382km of gas mains charging sessions
pipeline. acoustic testing • Distribution makes up
have occurred over the technology as a way 26% of the average
• More than 120,000 last calendar year at of identifying network electricity bill in
power poles. Vector’s EV charging defects before they New Zealand.
• Provide smart stations, providing affect customers. • In 2017, Entrust
meters to more 371MWh of electricity
• More than 16,000 distributed $350 to
than 1.3 million to electric vehicle
homes are generating each beneficiary – and
New Zealand homes users, with more than
their own electricity has distributed more
and businesses. 401,843kg of CO2e
across New Zealand than $1.2 billion to
emissions avoided.
as consumers make Aucklanders over the
• Vector's corporate the most of disruptive last decade.
fleet of pool cars in technology.
Auckland is now 100%
electric or hybrid.
Auckland growth
• Vector has 18x and complexity
50kW rapid and 9x of network
standard EV chargers
across Auckland. • Auckland is one of the
fastest growing cities
• Vector Lights – in the world, growing
90,000 solar at over 3% each year.
powered LEDs, with
248 solar panels • In a typical week,
providing energy for Auckland gains 825
the Auckland Harbour new residents and 278
Bridge alongside new houses.
475kWh battery • Vector connects on
storage. average approximately
1,000 new electricity 1. Shanju Xie, Auckland’s
customers, 300 new Greenhouse Gas Inventory
to 2015, October 2017
gas customers, and Technical Report 2017/026,
70 new generation Research and Evaluation
connections Unit (RIMU).
every month.
4 Vector://IR 18PERFORMANCE HIGHLIGHTS
HALF YEAR
SNAPSHOT
FINANCIAL
SNAPSHOT:
$ $
79.0
MILLION
250.0
MILLION
5.7% 8.25
CPS
Net profit Adjusted EBITDA Capex Interim dividend
Group net profit for Adjusted EBITDA falls Capex rises 5.7% to Interim dividend
the six months to 2.7% to $250.0 million $182.7 million increased 3.1%
31 December 2017 falls
26.2% to $79.0 million
OPERATIONAL
SNAPSHOT:
mPrest internet Now deploying Launched HRV PowerSmart
of energy solution smart meters Solar in Auckland, projects underway
being implemented for four leading rest of NZ to in Alice Springs
on our network Australian retailers follow and the South
under the Power of Pacific
Choice reforms www.hrvsolar.co.nz
Sustainable OnGas Papakura First major Vector Lights
Business Network Bottle Swap plant corporate to be launched on
award achieved commissioned an accredited Auckland
for Kupe St Living Wage Harbour Bridge
development First New Zealand employer
major hazard facility
to have a Safety
Case approved
5 Vector://IR 18LEADERSHIP
Chairman and Group Chief Executive report
CONTINUED PROGRESS
TOWARDS A NEW
Vector’s financial results
The six months to for the half-year reflect
31 December 2017 our long-term
saw continued investment in new
progress towards energy future initiatives
Vector’s ambition of and the impact of
creating a new and Auckland growth on
more sustainable connections and capital
energy future. expenditure.
We believe the business
is well positioned for the
future. However, we were
not satisfied with the
slower than expected
growth in our
Technology part of the
business. In particular,
this was attributable to
disappointing results in
the E-Co Products
Group’s heat pump
business, as well as the
cost of establishing the Simon Mackenzie Michael Stiassny
new HRV Solar business — —
ahead of its recent GROUP CHIEF EXECUTIVE CHAIRMAN
launch in Auckland. In
metering, installations in
Australia were lower than rapid growth as well as the increased need to
hoped for as the market manage the vegetation risks to energy infrastructure.
waited for the Power of
Choice reforms to take All these areas will be a key focus for the second half
effect in December of the financial year.
2017. In addition, there
was increased planned Revenue was up to $676.2 million from
and unplanned $625.6 million, due primarily to the acquisition
maintenance costs in of E-Co Products Group on 31 March. However,
our Regulated Networks Group net profit was down to $79.0 million from
business to $107.1 million in the prior period. This is largely
accommodate because of one-off items totalling $18.8 million
Auckland’s continued in the prior year1, as well as a significant increase
1. These include a $5.3 million ($3.8 million post tax) insurance payment to Liquigas and a tax gain
of $15.0 million following the Court of Appeal ruling over the tax treatment of the sale of rights to
use our Penrose to Hobson Street tunnel.
6 Vector://IR 18ENERGY FUTURE
in depreciation and
amortisation in this half.
Adjusted earnings which was partly offset
LEADERSHIP //
before interest, tax, by lower metering capital
depreciation and expenditure in line with
amortisation (Adjusted the slow-down in
EBITDA) were down to New Zealand meter
$250.0 million from deployment rates.
$257.0 million in the
prior period. Regulated Creating long-lasting,
Business earnings were sustainable value
down $3.0 million In a world being rapidly
largely due to an disrupted, we must
increase in maintenance maintain our focus on
expenditure. Gas creating lasting and
Trading earnings were sustainable value for
down $5.3 million, our customers, for
because of a shareholders and for
$5.3 million insurance New Zealand.
settlement one-off in
the prior year, with According to the
underlying earnings flat. International Renewable
Energy Agency (IRENA),
While earnings in the by 2020, all the
Technology segment renewable power
grew $4.2 million and generation technologies
helped to offset the that are now in
earnings decline in commercial use will fall
Regulated Networks and within the fossil fuel-fired
Gas Trading, growth was cost range, with most at
lower than expected for the lower end or even
the reasons set out undercutting the cost
earlier, and also due to of fossil fuels.
changes to the way we
account for internal Over the next decade,
communications as the cost of solar and
services. wind energy generation
and battery storage
Capital expenditure inevitably falls and
(capex) increased 5.7% becomes competitive
to $182.7 million from with traditional
$172.9 million in the generation, we expect
prior period. This was energy to be increasingly
driven by Auckland
growth and by higher
network replacement
capital expenditure,
7 Vector://IR 18LEADERSHIP
Chairman and Group Chief Executive report
In addition, our The new energy
ambitions and presence life spiral
distributed, decentralised and democratised. Greater are increasingly
A scenario is emerging
connectivity, artificial intelligence and data analytics extending beyond
where what is good for
will accelerate the adoption of the ‘internet of New Zealand. Our smart
consumers is also good
energy’, benefiting industries, communities, meter business is well-
for our environment, for
businesses, and individuals. positioned in Australia
network resiliency, for
and will be deploying
Auckland is now one of the fastest growing cities Auckland and, ultimately,
smart meters for at least
in the western world, so energy infrastructure must for New Zealand.
four leading Australian
accommodate this growth intelligently, reliably, electricity retailers in It’s an elegant dynamic
sustainably, and cost-effectively. Customer 2018. PowerSmart is – the more energy
expectations are changing too – in today’s world, delivering the 5MW generation becomes
we all expect continuous service and the ability battery to Territory distributed, the more
to access what we want, when we want, and how Generation in Alice control shifts to the
we want. Springs in the Northern consumer, the more
Territory, and has been they can reduce their
These are the mega trends we have observed in
selected for a similar own costs, the more
New Zealand and globally that have been driving
project in Niue in resilient the network
our thinking as a business. And as has occurred
the South Pacific. system becomes and
in all other industries impacted by technological
Treescape has built a the more sustainable
disruption, we believe these trends will give
significant business in and less carbon
consumers more control and choice over the
Australia, and is intensive our energy
services they use and the way they use them.
providing vegetation supply becomes.
As a famous quote from writer William Gibson management services to
goes, “The future is already here, it’s just not evenly a number of Australian Over the next decade,
distributed”. We have a role to play in addressing energy networks we expect to see a lot
that, and we are investing to facilitate this future and councils. more distributed energy
in different ways. Through our network, using a resources such as solar,
As part of a wider multi- wind, battery, and
mix of traditional infrastructure and emerging
million-dollar energy electric vehicles on our
technologies to support Auckland’s needs now and
efficient partnership with network. Power
into the future. Through smart metering, to give
Auckland Council we generation will shift to
consumers better information on their usage and
launched Vector Lights a broader, more diverse
enable retailers to innovate with new products and
in January 2018. It is a generation sector as
models. And through new energy technologies for
brilliant showcase for consumers can choose
residential and commercial customers via HRV
new energy solutions from a wider range of
and PowerSmart.
that is now lighting up energy sources that are,
Already market leaders in delivering healthy homes, Auckland’s Harbour quite literally, closer
HRV’s current offering includes ventilation, heat Bridge using a to home.
pumps, and water filtration. Over time we see combination of solar,
significant opportunities for HRV to deliver battery, LED, and peer- A more distributed
residential solar solutions. At the beginning of 2018, to-peer technology, and energy network with
HRV Solar launched in the Auckland market with is living proof that the a greater number of
a nationwide launch to follow. new energy future is localised generation and
now possible. storage sources will be
far more resilient. It will
8 Vector://IR 18save money for maintenance programmes, identify and pre-empt
consumers and put problems before they occur, and restore power more
more power and control seamlessly and quickly following any unexpected
in their hands because outages, such as the storm damage experienced
they can generate, store in early January 2018.
and exchange their own
energy. They can use Having a significantly greater number of renewable
smart technology to and localised electricity generation sources will also
dynamically manage help address one of the most pressing issues we
their energy use, face as a nation. Increasingly, climate change is
consuming energy at altering New Zealand weather patterns.
A scenario is more convenient or less This means we must factor an increase in the
emerging where expensive times to suit number of ‘1 in 100 year’ extreme weather events
their individual
what is good for preferences.
and an increase in the risk of drought, with the
consequent impact on New Zealand’s lake levels,
consumers is also so critical to our energy supply. Already, New Zealand
It will reduce the high
good for our peaks that network has seen examples in 2017 of wholesale energy
environment, for operators need to build prices rising significantly due to the risks of a
dry year.
network resiliency, capacity for because
‘internet of energy’
for Auckland and, technology and
This is why a system wide view of operating energy
infrastructure more sustainably is a critical need for
ultimately, for improved access to data New Zealand, and this is why Vector has signed up
New Zealand. will enable consumer to the United Nations Sustainable Development
needs to be better Goals. Electricity will play a key role in helping to shift
understood, peaks to be New Zealand to a low carbon economy, and
— smoothed, and energy technology will be a critical enabler.
consumption to be
more evenly distributed, The electrification of transport is also an emerging
leading to greater factor. The number of electric vehicles (EV’s) on our
network utilisation and roads is roughly doubling year on year, and EV costs
efficiency. To use a are coming down, so energy systems must have the
transport analogy, it resiliency to cope with a surge in localised demand
means avoiding the cost from more EV’s being charged and EV’s with longer
of building a six-lane range being introduced.
motorway for the peak
hour because traffic can
be spread across the
whole day.
It will help maintain
existing network
infrastructure more
efficiently, because
technology can be
deployed to optimise
9 Vector://IR 18LEADERSHIP
Chairman and Group Chief Executive report
safety reporting by field service providers. As a
consequence, while we do not anticipate meeting
our TRIFR reduction targets for the financial year,
Taking the lead
we are satisfied we are continually lifting the bar
To achieve our objectives, we must continue to take and improving safety across our workforce and
the lead on innovation as new energy technologies supply-chain.
emerge and evolve. We must trial and invest in ways
to manage Auckland’s future energy needs that We are proud to say that Vector has led the way on
reflect what customers will want tomorrow, not fair pay, in November 2017 becoming the first large
just today. corporate in New Zealand to qualify as an accredited
Living Wage employer, and accelerating our work
In terms of innovation, we invest significantly in to deliver pay equity, with our efforts recognised with
energy research & development. We already a nomination for the YMCA Equal Pay Award in
collaborate with some of the most innovative November 2017.
companies in the world and we are constantly
pioneering new energy technology solutions for We invest millions every year towards preventing
customers. And we are very open to working with problems for customers before they occur. We have
commercial partners and with Government as we teams in the field ready to navigate Auckland traffic
believe the expertise and technology proven in and go out into storms to restore power for
Auckland can be applied elsewhere in the country. Aucklanders. The world-leading internet-of-energy
capabilities of mPrest, the next big advancement in
We must continue to look after what matters – our energy systems, allows us to manage energy
people, our customers, and our environment. We systems in more sophisticated ways, using data
have invested in skills and leadership development analytics, machine learning and artificial intelligence
to attract, grow and retain new talent, and to upskill to manage network systems more efficiently,
our people for the future of work. We have dynamically shift demand and improve resilience -
implemented a comprehensive diversity and as well as put more power and control in the hands
inclusion programme to ensure that our business of consumers.
benefits from diversity of background and thought.
And we have worked closely with Auckland
We have chosen to prioritise the health and safety of communities, through our work alongside Entrust,
our people and customers with regards to live-line Ngāti Whātua and Auckland Council to deliver new
work and we have achieved certification to AS/NZS and more democratic energy solutions for
4801 and ISO 14001 standard for our Health Safety communities in Orakei, Glen Innes and South
and Environment Management System. The new Auckland, and through growing the dividends
gas bottling plant commissioned in Papakura can fill we have been able to deliver for our shareholders.
up to 6,000 gas bottles a day, and it is a world-class In December 2017, we won the Revolutionising
facility that sets a benchmark for safety. It is the Energy category at the Sustainable Business
first plant in New Zealand to have an approved Network awards for our work with Ngāti Whātua
Safety Case under the new upper tier major hazard on their Kāinga Tuatahi housing development in
facilities regulations. Kupe St, Ōrākei.
Whilst we have seen an increase in our Total
Recordable Injuries Frequency Rate (TRIFR) in the
first half of the year (primarily from our contracted
workforce), this has come from more comprehensive
10 Vector://IR 18Looking ahead
In December 2017, the Government outlined the
draft terms of reference for the forthcoming review 8.0 cents per share. The
of retail electricity pricing in New Zealand, a review record date for dividend
that Vector believes is timely. entitlement is 28 March
2018 and the payment
While the legacy generation and retail energy market date is 11 April 2018.
framework has served New Zealand for some time,
it may no longer be the best framework for a future Looking ahead, we
where customers have more control over how, with reaffirm our guidance
whom, and when they use energy, where innovative from August 2017 for
companies may seek to enter the retail electricity adjusted EBITDA for the
market, where the impacts of climate change may full-year to 30 June
impact the sector, and where technology can play 2018 to be at or around
a much greater role in enabling choice and control. last year’s result.
For Vector, while we are not entirely satisfied with our It’s a time of rapid
half-year financial results, we have maintained good change for the energy
operational momentum towards our longer-term industry. We are
goals. We’ve introduced a number of new committed to continuing
innovations. We’ve diversified the Group even to lead and to positively
further and explored new opportunities. We have shaping the new energy
positioned ourselves well in a number of new and future for the benefit of
emerging markets. consumers, of Auckland,
of New Zealand
Vector’s balance sheet remains strong, with gearing and beyond.
as at 31 December 2017 at 47.3%, up from 43.9%
at the prior half-year. We’re proud of the fact that we
have paid out almost $1.7 billion in dividends over
the last 12 years and that we have added $2.2 billion
in investments into electricity and gas networks over
that same time.
As flagged last year, the Board has been reviewing
the company’s dividend policy and has now
approved a new progressive policy. Vector will
increase dividends by at least 0.25 cents per share
annually provided the company has the financial
capacity to do so. We will review this policy once
the parameters for the 2020 electricity reset are Michael Stiassny Simon Mackenzie
established. Full details of the policy can be found Chairman Group Chief Executive
at www.vector.co.nz/investors.
In line with this policy, the directors have declared
an interim dividend of 8.25 cents per share, up
0.25 cents on the prior year’s interim dividend of
11 Vector://IR 18BUSINESS REVIEW
Unregulated Business
TECHNOLOGY
Technology division
revenue rose 36.1% to
$133.9 million from During the six-month period, we installed
$98.4 million at 44,804 advanced meters in New Zealand and
31 December 2016, 7,515 advanced meters in Australia. Our smart We have been
driven by smart meter meter base grew 10.8% to 1.33 million1 from targeting Australia
installations and the 1.20 million the year before. As communicated
contribution of E-Co in August, Vector is now reaching the end of its
to deliver the next
Products Group and smart meter roll-out in New Zealand, and we are phase of growth
PowerSmart which targeting a reduced deployment of around 80,000 for the metering
were both acquired on to 100,000 meters over FY18. After that, the focus
31 March 2017. in New Zealand will shift to managing the existing
business.
Technology adjusted electricity meter fleet and installing new and
EBITDA rose 6.9% to replacement meters as required. —
$64.7 million from
$60.5 million, with For the past three years, we have been targeting
gains from acquisitions Australia to deliver the next phase of growth for
and the smart meter the metering business. We are pleased with the
roll-out diluted by progress made in Australia over the past six
continued business months. In particular, over this period we
development successfully completed the development of the
expenditure associated system changes required to deliver the Power of
with establishing Choice, the new Australian electricity industry
Australian metering reforms, and achieved full accreditation from the
operations and the Australian Energy Market Operator (AEMO).
new energy solutions The Power of Choice reforms went live in the
business, and changes first week of December 2017, so all new and
to how we structured replacement residential electricity meters2 must
the services provided now be advanced meters, to be installed by
by Vector metering co-ordinators appointed by electricity
Communications to retailers. Vector will be deploying advanced meters
Vector’s electricity on behalf of at least four leading electricity retailers
network. in 2018 across New South Wales, Queensland,
South Australia and the ACT. Metering volumes
across the industry are expected to rise as the
demand that had been suppressed during the wait —
for Power of Choice to go live is met. AUSTRALIAN SMART
METERING BUSINESS
Late in FY17, Vector’s electricity business entered READY FOR
into a lease with Vector Communications over the POWER OF CHOICE
fibre used to provide SCADA connectivity across REFORMS, AND
its network. The lease is accounted for as capital WITH DEPLOYMENT
expenditure, which for the period reduced Vector CONTRACTS IN
PLACE WITH FOUR
LEADING RETAILERS.
1. Including 118,961 meters which are managed,
but not owned, by Vector.
2. Excluding Victoria.
12 Vector://IR 18BUSINESS REVIEW
Unregulated Business
—
HRV SOLAR
LAUNCHES ACROSS
AUCKLAND WITH A
NATIONAL OFFERING
Communications TO FOLLOW.
revenue and Regulated
Networks operating
expenditure by
$3.3 million.
Our new energy
solutions business was
strengthened this year
by the acquisition of
E-Co Products Group
and PowerSmart. The
market for large scale
solar and battery
installations is strong
across Australia
and the Pacific.
PowerSmart will deliver targeting other such opportunities to deliver
a large commercial commercial solar to New Zealand businesses.
battery system to
Territory Generation in E-Co Products (trading as HRV) is Vector’s channel
Alice Springs and will to market for healthy and energy efficient home
then shift focus to an solutions. HRV’s core ventilation and water filtration
exciting project in Niue, products have continued to trade well since
where it has been acquisition. The heat pump business, which we
awarded the contract believe offers significant opportunity across
for another large solar New Zealand, has not performed to expectations,
array and battery and we ceased offering HRV's retrofit windows
storage system. product early in 2018. During the period HRV has
PowerSmart is also invested significantly in developing a residential
contracted to deliver a solar offering, which was launched in Auckland at
number of solar/battery the beginning of 2018 as HRV Solar, with a
microgrid solutions nationwide offering to follow in due course.
in New Zealand. During Visit www.hrvsolar.co.nz for details.
the period, Vector
acquired New Zealand’s
largest solar array, on
the Yealands Winery in
Marlborough, which was
installed by
PowerSmart. The
output of this system
has been sold under
a long-term power
purchase agreement.
PowerSmart is actively
13 Vector://IR 18BUSINESS REVIEW
Unregulated Business
GAS
TRADING
Revenue for the Gas Trading division increased to
3.2%
$153.5 million from $150.2 million a year earlier,
with volumes from the Kapuni field up 6.7% to
4.8PJ, natural gas volumes up 3.2% to 9.6PJ,
improved Liquigas revenue and higher Bottle
Swap volumes.
During the period we commissioned the new
Natural gas 9kg LPG bottle-filling and refurbishment plant in
volumes up 3.2% Papakura, the first of its kind in New Zealand. This
to 9.6PJ. plant will strengthen Vector’s LPG business and
help drive efficiencies and enable further growth in
our Bottle Swap operations. Bottle Swap 9kg
volumes were up 10.1% over the period to 351,962
bottles from 319,685 in the first half of the year.
The prior period result included a one-off
insurance settlement of $5.3 million in relation to
damage to the Liquigas facilities at Lyttelton in the
2011 earthquake. Excluding this, adjusted EBITDA
was flat year on year at $18.4 million.
—
NEW ONGAS
BOTTLE SWAP
PLANT IN
PAPAKURA
OPENED BY
WORKPLACE
RELATIONS
AND SAFETY
MINISTER
IAIN LEES-
GALLOWAY.
14 Vector://IR 18BUSINESS REVIEW
Regulated Business
REGULATED
BUSINESSES
Revenue for our Regulated Networks business1
increased 1.4% to $358.9 million from
$353.8 million the year before, largely driven by
higher connections and higher pass-through
transmission costs.
New electricity connections rose 32.9% to 6,090
from 4,583. New gas connections fell 13.2% to
1,656 from 1,907, but remain significantly above
long term average growth rates. Total connections
to the electricity network stood at 559,777 as at
31 December 2017, up 1.2% from 552,948 a year
ago. Total gas connections were 108,270, up 2.2%
— from 105,918 a year ago.
CONNECTIONS Despite the increase in connections, volumes
CONTINUE TO
transported across our electricity network
RISE ACROSS OUR
BUSINESS.
increased only slightly to 4,352GWh from
4,340GWh a year earlier, with the growth in
connections partially offset by declining electricity
consumption per connection. Auckland gas
32.9%
distribution network volumes were 7.7 PJ, up 1.3%
from 7.6PJ the previous year, due largely to
connection growth.
Adjusted EBITDA fell 1.5% on the prior year to
$192.7 million from $195.7 million on the back of
higher maintenance costs offset by higher revenue
which was driven by additional connections and New electricity
a reduction in internal communications charges. connections up.
The increase in maintenance costs ($6.5 million
above the prior period) is driven by an increase
in vegetation maintenance targeting the
worst performing feeders and higher
13.2%
planned maintenance.
Capital contributions increased by 9.7% to
$33.8 million, from $30.8 million in the prior year
due to continued strong growth in Auckland.
New gas connections
down, but remain
significantly above
long term average.
1. Excluding capital contributions.
15 Vector://IR 18BUSINESS REVIEW
People, Safety and Risk
PEOPLE, SAFETY
& RISK
Vector has a necessarily holistic and
comprehensive approach to looking after the
things that matter, be it people, communities,
assets, or the environment.
Our approach to people, safety and risk was
reflected in our 2017 decision with regards to live-
line work, and reflected more recently in our
certification to AS/NZS 4801 and ISO 14001
standard for our Health Safety and Environment
Management System. We are particularly pleased
that the new gas bottling plant commissioned in
— Papakura is the first plant in New Zealand to have
an approved Safety Case under the new upper tier
VECTOR HAS A major hazard facilities (UTMHF) regulations.
SAFETY ALWAYS
PHILOSOPHY Our philosophy of ‘safety always’ means our
THAT DRIVES customers are experiencing more planned outages.
THE WAY WE
We are working closely with the Commerce
WORK.
Commission on the issue, as we firmly believe
safety should not be a secondary consideration
to service targets.
The last six months saw a renewed focus on more
comprehensive safety reporting by our field service
providers. As a consequence, we have unfortunately
seen an increase in our Total Recordable Injuries
Frequency Rate (TRIFR) in the first half of the year.
As a result, we do not anticipate meeting our TRIFR
reduction targets for the financial year but we are
satisfied we are continuing to improve safety across
our business and supply-chain.
In a country like New Zealand where the impact of
climate change is already evident from increased
storm activity and increased risk of drought, Vector,
like all businesses, must play a role in transitioning
to a low carbon economy. This, along with
responding to issues of inequality, underpins our
approach to sustainability.
We see sustainability as a key part of the new
energy future that we are pioneering. That’s why
we joined other leading global businesses in
making a clear commitment to the United Nations
Sustainable Development Goals. Our initial focus is
on seven key areas: Good health and well-being;
Affordable and clean energy; Industry, innovation
and infrastructure; Reduced inequalities;
16 Vector://IR 18BUSINESS REVIEW
People, Safety and Risk
Encouraging and has also begun taking
embracing diversity and steps to proactively
Sustainable cities and inclusion is important to find and address
communities; Climate Vector. Greater diversity pay inequities.
action; and Partnership. of thought allows us to
harness a broader and
As part of our richer range of ideas,
sustainability leadership insights and
we regularly bring perspectives to better
thought-leaders from understand and serve
around the world to the needs of our
New Zealand to share customers and help
their insights with the design what the new
energy industry and energy future will be.
with other stakeholders. It’s why we sought
In 2017 this included and received a
futurist Tony Seba and reaccreditation of our
scientist Will Steffen, Rainbow Tick and it’s
and this year we intend why we launched both
to bring Australian Women in Leadership
expert Simon Corbell and Pacifica
to New Zealand. development
programmes.
In continuing our work
on better understanding In November 2017,
and reducing our Vector became the first
carbon impact, we are corporate business to
incorporating newly be accredited as a
acquired businesses Living Wage employer.
into our carbon We support a living
emissions reporting wage because it is the
frameworks, as well right thing to do.
as investing in lower Fairness and equity
carbon options for have been a big part
business, for example of our approach to
— Vector’s corporate fleet remuneration for a
WORKING WITH of light pool cars in number of years, and
COMMUNITIES TO Auckland is now 100% we’re pleased to have
CREATE A NEW electric or hybrid. this formally recognised
ENERGY FUTURE. through the Living
Wage accreditation.
We’re now working with
our partners and
suppliers to encourage
support for a living wage
across our supply chain.
In line with this, Vector
17 Vector://IR 18OPERATING STATISTICS
For the six months ended 31 December
2017 2016
Electricity
Customers1,2 559,777 552,948
New connections 6,090 4,583
Net movement in customers3 4,677 2,890
Volume distributed (GWh) 4,352 4,340
Network length (km)1 18,607 18,377
SAIDI (minutes)4
Normal operations 168.0 121.0
Extreme events 0.0 2.4
Total 168.0 123.4
Gas Distribution
Customers1,2 108,270 105,918
New connections 1,656 1,907
Net movement in customers3 1,600 1,596
Volume distributed (PJ) 7.7 7.6
Gas Trading
Natural gas sales (PJ)5 9.6 9.3
Gas liquids sales (tonnes)6 40,752 38,557
9kg LPG bottles swapped7 351,962 319,685
Liquigas LPG tolling (tonnes)8 89,147 77,688
Technology
Electricity: smart meters1,9 1,333,208 1,203,482
Electricity: legacy meters1 91,848 107,467
Electricity: prepay meters1 366 4,596
Electricity: time-of-use meters1 12,259 11,985
Gas meters1 223,368 219,718
Data Management and services connections1 8,811 8,760
1. As at period end. 7. Number of 9kg LPG bottles
2. Billable ICP’s. swapped and sold during
3. The net number of the year.
customers added during 8. Includes product tolled in
the period. Taranaki and further tolled
4. Regulatory year – 9 months in the South Island.
to 31 December. 9. The number of smart
5. Excludes gas sold as gas meters deployed at
liquids as these sales are 31 December 2017 includes
included within the gas 118,961 meters managed
liquids sales tonnages. but not owned by Vector
(31 December 2016: 78,037).
6. Total of retail and wholesale
LPG production and natural
gasoline.
18 Vector://IR 18FINANCIAL OVERVIEW
$ $
676.2
MILLION
REVENUE
Rises 8.1% on the
236.0
MILLION
OPERATING CASH
FLOW
Rises 4.3% on the
previous corresponding previous corresponding
period period
FINANCIAL PERFORMANCE1
31 DEC 2017 31 DEC 2016 30 JUN 2017
$ MILLION 6 MONTHS 6 MONTHS CHANGE 12 MONTHS
Revenue 676.2 625.6 8.1% 1,226.7
Adjusted EBITDA 250.0 257.0 (2.7%) 474.4
Adjusted EBIT 140.4 159.8 (12.1%) 274.8
Net profit 79.0 107.1 (26.2%) 168.9
Operating cash flow 236.0 226.3 4.3% 335.7
FINANCIAL POSITION
$ MILLION 31 DEC 2017 31 DEC 2016 CHANGE 30 JUN 2017
Total equity 2,468.1 2,467.0 0.0% 2,448.3
Total assets 5,668.3 5,511.3 2.8% 5,574.6
Economic net debt (borrowings net of
cash and short-term deposits) 2,252.9 1,968.2 14.5% 2,220.1
KEY FINANCIAL MEASURES
31 DEC 2017 31 DEC 2016 30 JUN 2017
6 MONTHS 6 MONTHS CHANGE 12 MONTHS
Adjusted EBITDA/revenue 37.0% 41.1% (10.0%) 38.7%
Adjusted EBIT/revenue 20.8% 25.5% (18.4%) 22.4%
Equity/total assets 43.5% 44.8% (2.9%) 43.9%
Gearing1 47.3% 43.9% 7.7% 47.1%
Net interest cover – (adjusted EBIT/net
interest costs) (times) 2.1 2.3 (8.7%) 2.0
Earnings (NPAT) per share (cents) 7.9 10.5 (24.8%) 16.7
Dividend declared, cents per share (fully
imputed) 8.25 8.00 3.1% 16.00
1. Gearing is defined as economic net debt to economic net debt plus adjusted equity. Adjusted equity means total equity adjusted for
hedge reserves.
19 Vector://IR 18FINANCIAL PERFORMANCE TRENDS
REVENUE (CONTINUING OPERATIONS) NET PROFIT (INCLUDING DISCONTINUED OPERATIONS)
FOR THE SIX MONTHS ENDED 31 DECEMBER FOR THE SIX MONTHS ENDED 31 DECEMBER
$ MILLION $ MILLION
120
800 104.6 107.1
100.1
676.2 100
700 618.9 625.6
581.4 590.6 87.3
600 79.0
80
500
60
400
300 40
200
20
100
0 0
2013 2014 2015 2016 2017 2013 2014 2015 2016 2017
-100
REGULATED NETWORKS GAS TRADING CONTINUED OPERATIONS DISCONTINUED OPERATIONS
TECHNOLOGY CORPORATE INTER-SEGMENT
ADJUSTED EBITDA (CONTINUING OPERATIONS)
FOR THE SIX MONTHS ENDED 31 DECEMBER
$ MILLION
300
253.5 257.0 250.0
243.0 244.8
250
200
150
100
50
0
-50
2013 2014 2015 2016 2017
REGULATED NETWORKS GAS TRADING TECHNOLOGY CORPORATE TOTAL GROUP
20 Vector://IR 18CAPITAL EXPENDITURE OPERATING CASH FLOWS (INCLUDING DISCONTINUED
FOR THE SIX MONTHS ENDED 31 DECEMBER OPERATIONS) FOR THE SIX MONTHS ENDED 31 DECEMBER
$ MILLION $ MILLION
300
12.3 248.8
250 236.0
225.9 226.3
20 203.3
1
20 200
7
8.9
40.2
16
150
49.8
102.2 119.6
100
12.0
10.6
50
0
2013 2014 2015 2016 2017
REGULATED NETWORKS GAS TRADING
TECHNOLOGY CORPORATE
SOURCE OF FUNDING – GEARING
AS AT 31 DECEMBER
$ MILLION
20
1
20
7
16
1,968.2
2,252.9
2,512.9 2,515.3
ECONOMIC NET DEBT ADJUSTED EQUITY
21 Vector://IR 18NON-GAAP FINANCIAL INFORMATION
Vector’s standard profit measure prepared under New Zealand Generally Accepted Accounting Practice
(GAAP) is net profit. Vector has used non-GAAP profit measures when discussing financial performance in
this document. The directors and management believe that these measures provide useful information as
they are used internally to evaluate performance of business units, to establish operational goals and to
allocate resources. For a more comprehensive discussion on the use of non-GAAP profit measures, please
refer to the policy ‘Reporting non-GAAP profit measures’ available on our website (www.vector.co.nz).
Non-GAAP profit measures are not prepared in accordance with New Zealand International Financial Reporting
Standards (NZ IFRS) and are not uniformly defined, therefore the non-GAAP profit measures reported in
this document may not be comparable with those that other companies report and should not be viewed in
isolation from or considered as a substitute for measures reported by Vector in accordance with NZ IFRS.
DEFINITIONS
EBITDA: Earnings before interest, taxation, depreciation and amortisation from
continuing operations
Adjusted EBITDA: EBITDA from continuing operations adjusted for fair value changes, associates,
impairments, capital contributions, and significant one-off gains, losses, revenues
and/or expenses.
RECONCILIATION:
31 DEC 2017 31 DEC 2016
6 MONTHS 6 MONTHS
Group EBITDA and adjusted EBITDA $M $M
Reported net profit for the period (GAAP)1 79.0 107.1
Add back: net interest costs1 66.4 68.6
Add back: tax (benefit)/expense1 31.9 16.5
Add back: depreciation and amortisation1 109.6 97.2
EBITDA 286.9 289.4
Adjusted for:
Associates (share of net (profit)/loss)1 0.1 (1.1)
Fair value change on financial instruments1 (2.8) -
Capital contributions (34.2) (31.3)
Adjusted EBITDA 250.0 257.0
1. Extracted from reviewed financial statements.
SEGMENT ADJUSTED EBITDA 2017 2016
REPORTED LESS CAPITAL SEGMENT REPORTED LESS CAPITAL SEGMENT
SEGMENT CONTRI- ADJUSTED SEGMENT CONTRI- ADJUSTED
Six months ended 31 December EBITDA BUTIONS EBITDA EBITDA BUTIONS EBITDA
Technology 65.1 (0.4) 64.7 61.0 (0.5) 60.5
Gas Trading 18.4 18.4 23.7 – 23.7
Unregulated segments 83.5 (0.4) 83.1 84.7 (0.5) 84.2
Regulated segment 226.5 (33.8) 192.7 226.5 (30.8) 195.7
Corporate (25.8) – (25.8) (22.9) – (22.9)
TOTAL 284.2 (34.2) 250.0 288.3 (31.3) 257.0
22 Vector://IR 18GROUP CONDENSED INTERIM FINANCIAL STATEMENTS
for the six months ended 31 December 2017 (unaudited)
CONTENTS
24 ——— Independent Review Report
26 ——— Group Condensed Interim Financial Statements
27 ——— Profit or Loss
28 ——— Other Comprehensive Income
29 ——— Balance Sheet
29 ——— Cash Flows
30 ——— Changes in Equity
31 ——— Notes to the Group Condensed Interim Financial Statements
GROUP CONDENSED INTERIM FINANCIAL STATEMENTS
These group condensed interim financial statements for the six months
ended 31 December 2017 are dated 27 February 2018, and signed for
and on behalf of Vector Limited by:
Director 27 February 2018
Director 27 February 2018
And management of Vector Limited by:
Group Chief Executive 27 February 2018
Chief Financial Officer 27 February 2018
23 Vector://IR 18INDEPENDENT REVIEW REPORT
for the six months ended 31 December 2017
Independent Review Report
To the shareholders of Vector Limited
Report on the interim consolidated financial statements
Conclusion
Based on our review, nothing has come to our We have completed a review of the accompanying
attention that causes us to believe that the interim interim consolidated financial statements which
consolidated financial statements on pages 26 to 39 comprise:
do not:
— the consolidated balance sheet as at 31
i. present fairly in all material respects the December 2017;
Group’s financial position as at 31
— the consolidated profit or loss, statements of
December 2017 and its financial
other comprehensive income, changes in
performance and cash flows for the period
equity and cash flows for the period then
ended on that date; and
ended; and
ii. comply with NZ IAS 34 Interim Financial
— notes, including a summary of significant
Reporting.
accounting policies and other explanatory
information.
Basis for conclusion
A review of interim consolidated financial statements in accordance with NZ SRE 2410 Review of Financial
Statements Performed by the Independent Auditor of the Entity (“NZ SRE 2410”) is a limited assurance
engagement. The auditor performs procedures, consisting of making enquiries, primarily of persons responsible
for financial and accounting matters, and applying analytical and other review procedures.
As the auditor of Vector Limited, NZ SRE 2410 requires that we comply with the ethical requirements relevant to
the audit of the annual financial statements.
Our firm has also provided other services to the group in relation to regulatory and other assurance. Subject to
certain restrictions, partners and employees of our firm may also deal with the group on normal terms within the
ordinary course of trading activities of the business of the group. These matters have not impaired our
independence as reviewer of the group. The firm has no other relationship with, or interest in, the group.
Use of this Independent Review Report
This report is made solely to the shareholders as a body. Our review work has been undertaken so that we
might state to the shareholders those matters we are required to state to them in the Independent Review
Report and for no other purpose. To the fullest extent permitted by law, we do not accept or assume
responsibility to anyone other than the shareholders as a body for our review work, this report, or any of the
opinions we have formed.
© 2018 KPMG, a New Zealand partnership and a member firm of the KPMG network of independent
member firms affiliated with KPMG International Cooperative (“KPMG International”), a Swiss entity.
24 Vector://IR 18Responsibilities of the Directors for the interim consolidated financial
statements
The Directors, on behalf of the group, are responsible for:
— the preparation and fair presentation of the interim consolidated financial statements in accordance with NZ
IAS 34 Interim Financial Reporting;
— implementing necessary internal control to enable the preparation of interim consolidated financial
statements that are fairly presented and free from material misstatement, whether due to fraud or error; and
— assessing the ability to continue as a going concern. This includes disclosing, as applicable, matters related
to going concern and using the going concern basis of accounting unless they either intend to liquidate or to
cease operations, or have no realistic alternative but to do so.
Auditor’s Responsibilities for the review of the interim consolidated
financial statements
Our responsibility is to express a conclusion on the interim financial statements based on our review. We
conducted our review in accordance with NZ SRE 2410. NZ SRE 2410 requires us to conclude whether anything
has come to our attention that causes us to believe that the interim financial statements are not prepared, in all
material respects, in accordance with NZ IAS 34 Interim Financial Reporting.
The procedures performed in a review are substantially less than those performed in an audit conducted in
accordance with International Standards on Auditing (New Zealand). Accordingly we do not express an audit
opinion on these interim consolidated financial statements.
This description forms part of our Independent Review Report.
KPMG
Auckland
27 February 2018
25 Vector://IR 18GROUP INTERIM PROFIT OR LOSS
(unaudited)
31 DEC 2017 31 DEC 2016 30 JUN 2017
6 MONTHS 6 MONTHS 12 MONTHS
NOTE $M $M $M
Revenue 4 676.2 625.6 1,226.7
Operating expenses 4 (392.0) (337.3) (690.0)
Depreciation and amortisation (109.6) (97.2) (199.6)
Interest costs (net) (66.4) (68.6) (137.3)
Fair value change on financial instruments 2.8 – 1.6
Associates (share of net profit/(loss)) (0.1) 1.1 1.6
Profit/(loss) before income tax 110.9 123.6 203.0
Tax benefit/(expense) (31.9) (16.5) (34.1)
Net profit/(loss) for the period 79.0 107.1 168.9
Net profit/(loss) for the period attributable to
Non-controlling interests 0.7 2.7 3.1
Owners of the parent 78.3 104.4 165.8
Basic and diluted earnings per share (cents) 7 7.9 10.5 16.7
26 Vector://IR 18GROUP INTERIM OTHER COMPREHENSIVE INCOME
(unaudited)
31 DEC 2017 31 DEC 2016 30 JUN 2017
6 MONTHS 6 MONTHS 12 MONTHS
$M $M $M
Net profit/(loss) for the period 79.0 107.1 168.9
Other comprehensive income net of tax
Items that may be re-classified subsequently to profit or loss:
Net change in fair value of hedge reserves 4.2 41.0 40.3
Fair value change on financial asset 3.1 0.9 1.8
Translation of foreign operations (0.3) – 0.1
Other comprehensive income for the period net of tax 7.0 41.9 42.2
Total comprehensive income for the period net of tax 86.0 149.0 211.1
Total comprehensive income for the period attributable to
Non-controlling interests 0.7 2.7 3.1
Owners of the parent 85.3 146.3 208.0
27 Vector://IR 18GROUP INTERIM BALANCE SHEET
(unaudited)
31 DEC 2017 31 DEC 2016 30 JUN 2017
NOTE $M $M $M
CURRENT ASSETS
Cash and cash equivalents 17.9 187.2 14.9
Trade and other receivables 213.3 189.7 206.3
Derivatives 6 0.1 – –
Inventories 12.9 5.3 11.3
Intangible assets 6.0 4.8 2.4
Income tax 32.7 7.4 51.1
Total current assets 282.9 394.4 286.0
NON-CURRENT ASSETS
Derivatives 6 45.2 76.8 38.0
Investment in associate 9.5 9.6 9.6
Other investments 23.3 5.4 6.2
Intangible assets 1,393.8 1,284.1 1,397.2
Property, plant and equipment (PPE) 3,913.5 3,740.4 3,837.5
Deferred tax 0.1 0.6 0.1
Total non-current assets 5,385.4 5,116.9 5,288.6
Total assets 5,668.3 5,511.3 5,574.6
CURRENT LIABILITIES
Trade and other payables 271.9 216.3 250.0
Provisions 4.8 6.5 4.8
Borrowings 6 – 559.6 399.7
Derivatives 6 – 17.6 6.6
Income tax 0.4 0.3 0.5
Total current liabilities 277.1 800.3 661.6
NON-CURRENT LIABILITIES
Payables 45.0 47.9 41.5
Provisions 21.4 17.8 20.4
Borrowings 6 2,232.0 1,579.5 1,770.7
Derivatives 6 135.7 138.3 156.5
Deferred tax 489.0 460.5 475.6
Total non-current liabilities 2,923.1 2,244.0 2,464.7
Total liabilities 3,200.2 3,044.3 3,126.3
EQUITY
Equity attributable to owners of the parent 2,450.3 2,448.6 2,430.6
Non-controlling interests in subsidiaries 17.8 18.4 17.7
Total equity 2,468.1 2,467.0 2,448.3
Total equity and liabilities 5,668.3 5,511.3 5,574.6
Net tangible assets per share (cents) 7 105.1 116.5 103.5
Gearing ratio (%) 7 47.3 43.9 47.1
28 Vector://IR 18GROUP INTERIM CASH FLOWS
(unaudited)
31 DEC 2017 31 DEC 2016 30 JUN 2017
6 MONTHS 6 MONTHS 12 MONTHS
NOTE $M $M $M
CASH FLOWS FROM OPERATING ACTIVITIES
Receipts from customers 693.1 638.3 1,224.2
Interest received 0.4 5.4 9.0
Dividends received 9 0.5 1.5 2.0
Payments to suppliers and employees (389.0) (343.7) (686.6)
Interest paid (67.4) (73.5) (151.7)
Income tax refunded – – 0.9
Income tax paid (1.6) (1.8) (62.1)
Net cash flows from/(used in) operating activities 8 236.0 226.2 335.7
CASH FLOWS FROM INVESTING ACTIVITIES
Proceed from sale of PPE and software intangibles 0.1 0.1 0.4
Purchase and construction of PPE and software intangibles (184.9) (180.3) (354.4)
Acquisition of businesses 3 (1.7) – (90.9)
Other investments 3 (14.0) – –
Net cash flows from/(used in) investing activities (200.5) (180.2) (444.9)
CASH FLOWS FROM FINANCING ACTIVITIES
Proceeds from borrowings 6 435.8 – 284.6
Repayment of borrowings 6 (400.0) (98.9) (318.2)
Dividends paid (80.2) (80.2) (161.0)
Sale of treasury shares 14.0 – –
Other financing cash flows (2.1) (1.1) (2.7)
Net cash flows from/(used in) financing activities (32.5) (180.2) (197.3)
Net increase/(decrease) in cash and cash equivalents 3.0 (134.2) (306.5)
Cash and cash equivalents at beginning of the period 14.9 321.4 321.4
Cash and cash equivalents at end of the period 17.9 187.2 14.9
Cash and cash equivalents comprise:
Bank balances and on-call deposits 9.5 9.0 7.0
Short term deposits 8.4 178.2 7.9
17.9 187.2 14.9
29 Vector://IR 18GROUP INTERIM CHANGES IN EQUITY
(unaudited)
ISSUED NON-
SHARE TREASURY HEDGE OTHER RETAINED CONTROLLING TOTAL
CAPITAL SHARES RESERVES RESERVES EARNINGS INTERESTS EQUITY
$M $M $M $M $M $M $M
Balance at 1 July 2016 875.0 (9.2) (89.3) (1.1) 1,606.5 16.3 2,398.2
Net profit/(loss) for the period – – – – 104.4 2.7 107.1
Other comprehensive income – – 41.0 0.9 – – 41.9
Total comprehensive income – – 41.0 0.9 104.4 2.7 149.0
Dividends – – – – (79.6) (0.6) (80.2)
Total transactions with owners – – – – (79.6) (0.6) (80.2)
Balance at 31 December 2016 875.0 (9.2) (48.3) (0.2) 1,631.3 18.4 2,467.0
Net profit/(loss) for the period – – – – 61.4 0.4 61.8
Other comprehensive income – – (0.7) 1.0 – – 0.3
Total comprehensive income – – (0.7) 1.0 61.4 0.4 62.1
Dividends – – – – (79.7) (1.1) (80.8)
Total transactions with owners – – – – (79.7) (1.1) (80.8)
Balance at 30 June 2017 875.0 (9.2) (49.0) 0.8 1,613.0 17.7 2,448.3
Net profit/(loss) for the period – – – – 78.3 0.7 79.0
Other comprehensive income – – 4.2 2.8 – – 7.0
Total comprehensive income – – 4.2 2.8 78.3 0.7 86.0
Dividends – – – – (79.6) (0.6) (80.2)
Sale of treasury shares 5.0 9.0 – – – – 14.0
Total transactions with owners 5.0 9.0 – – (79.6) (0.6) (66.2)
Balance at 31 December 2017 880.0 (0.2) (44.8) 3.6 1,611.7 17.8 2,468.1
30 Vector://IR 18NOTES TO THE INTERIM FINANCIAL STATEMENTS
1. COMPANY INFORMATION
Reporting entity Vector Limited is a company incorporated and domiciled in New Zealand,
registered under the Companies Act 1993 and listed on the NZX Main Board
(NZX). The company is an FMC entity for the purposes of Part 7 of the
Financial Markets Conduct Act 2013. Vector’s condensed interim financial
statements (the interim financial statements) comply with this Act.
The interim financial statements presented are for Vector Limited Group
(“Vector” or “the group”) as at, and for the six months ended 31 December
2017. The group comprises Vector Limited (“the parent”), its subsidiaries,
and its investments in associates and joint arrangements.
Vector Limited is a 75.1% owned subsidiary of Entrust (formerly Auckland
Energy Consumer Trust) which is the ultimate parent entity for the group.
The primary operations of the group are electricity and gas distribution, natural
gas and LPG sales, gas processing, metering, telecommunications and new
energy solutions.
2. SUMMARY OF SIGNIFICANT ACCOUNTING POLICIES
Basis of preparation The interim financial statements have been prepared in accordance with
New Zealand Generally Accepted Accounting Practice (NZ GAAP) as applicable
to interim financial statements, and as appropriate to profit oriented entities.
They comply with NZ IAS 34 Interim Financial Reporting.
These interim financial statements do not include all of the information required
for full annual financial statements and should be read in conjunction with the
group financial statements and related notes included in Vector’s 2017 Annual
Report. The interim financial statements for the six months ended 31 December
2017 and 31 December 2016 are unaudited.
All financial information has been presented in New Zealand dollars ($) and
rounded to the nearest 100,000, unless otherwise stated.
Seasonality Vector’s electricity and gas businesses are affected by the seasonal demand for
energy, which generally increases during periods of colder weather. Accordingly,
financial results for the first half of the financial year reported in the interim
financial statements are expected to be more profitable than those of the
second half of the year.
Significant accounting The accounting policies set out in Vector’s 2017 Annual Report have been
policies applied consistently to all periods presented in these interim financial
statements.
31 Vector://IR 18You can also read