Growing momentum - Auckland Airport Interim Report 2019
←
→
Page content transcription
If your browser does not render page correctly, please read the page content below
Growing
momentum

Interim Report 2019

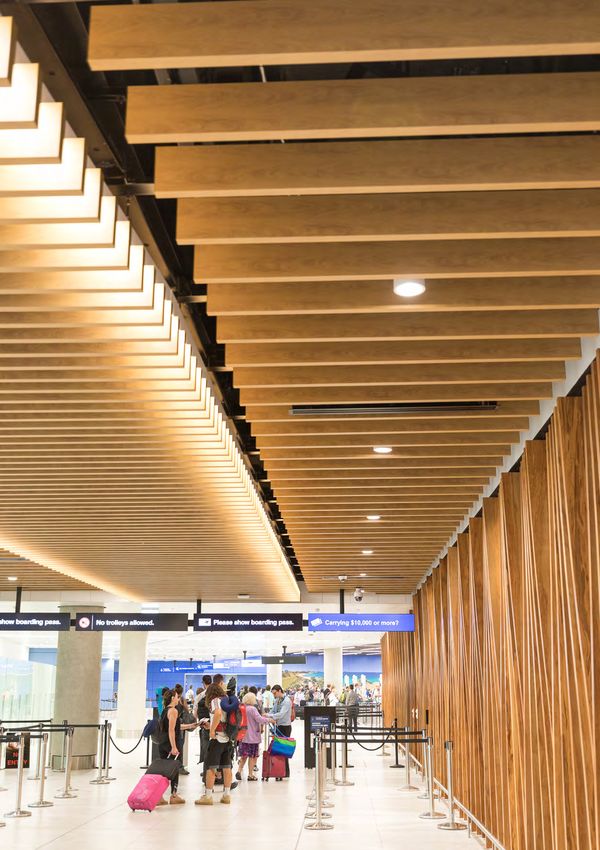
Welcome
The first six months reflected a strong start
to FY 2019 – we reached some significant
milestones in our 30-year programme,
which involved completing some 55,000
square metres of newly built or refurbished
international terminal infrastructure – as well
as making significant progress on the design
and planning for a number of anchor projects
that will form the foundation of our airport of
the future developments through to 2027.
Our continued focus on the customer contributed
to improvements in customer satisfaction scores
in the international and domestic terminals, an
impressive result given ongoing construction and
a record 10.6 million passengers that travelled
through Auckland Airport over the six-month
period.
Importantly, we are seeing the early benefits of
our multi-billion, inter-generational aeronautical
infrastructure programme delivering significant
new capacity, resilience, choice and overall
experience for our customers, including airline and
operational partners.

10.6m
Passengers travelled through Auckland
Airport over the six-month period

  Cover: new landside farewell area,
international departures

55,000m
of newly built or refurbished international terminal infrastructure.
                                                                              2

‘Sun Shower’ sculpture by Gensler and Emmy Award winning artist HOTTEA,
comprises 22,000 strands of paracord totalling 121km in length. This is the
anchor artwork within new food & beverage area, international departures.

                                                                                  1
More choice
               The international terminal building departures upgrade
               now offers increased choice for travellers through
               expanded retail, food and beverage services – and a truly
               contemporary, uniquely New Zealand experience for our
               international guests.

 Choice.
 Resilience.
 Capacity.
Delivered

                                                          26
                                                          new retail concepts
                                                          were opened
                                                          during 2018.
                                        34,500

                 We continue to
                 invest in our App to
                 improve Customer
                 Experience, which
                 was downloaded
                 34,500 times during
                 the six months.
Greater capacity
A range of projects and investments delivered
during the period added significant new capacity
to the overall running of the airport.

Faster                         70%           of customers
                                             using kiosks   13,700m2

Safer                          120        self-service
                                          kiosks
                                                            Two new investment
                                                            property developments
                                                            completed during the period
Four new Avi ramps             Around 70% of customers      added further earnings
were purchased, which          now use self-service         capacity to the Auckland
provide customers a safer,     kiosks to start their        Airport property portfolio:
more comfortable and           journey. In the six months   the 7,000m2 DSV logistics
faster disembarkation          we doubled the number        warehouse and office and a
experience.                    of kiosks to 120.            6,700m2 facility for Sheppard
                                                            Cycles and Early Settler.

We completed two important transport-specific
projects during the period – the Landing Road
intersection upgrade (in conjunction with NZTA)
and the Nixon Road bypass.

14% of the 80,000+ daily traffic movements on the
airport precinct are transiting vehicles trying to get
from the Ascot Industrial Park and SH20A to SH20B.
Early indications since the work was completed in
November show approx. 60% of those transiting
motorists now using the Nixon Road upgrade.

                                                            The Landing Road
                                                            intersection upgrade
                                                            has helped improve
                                                            traffic flows through
                                                            the airport precinct.

                                                                       Interim report 2019   3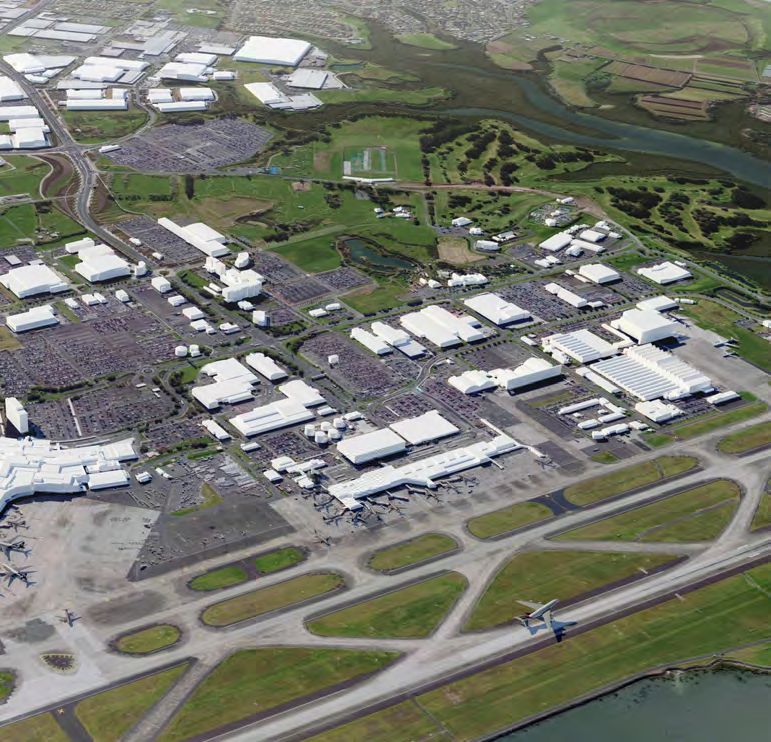
Auckland Airport has entered a new era in its airport
           of the future programme. In the first half of FY 2019 we
           worked closely with our airline partners to understand
           their requirements for the new domestic jet facility and
           the new international arrivals projects.
           These deeper design insights will deliver improved
Momentum   project outcomes in the future including planning
           certainty, improved cost control and a realistic and
           achievable build programme. This process has led to
           some scope and sequencing changes for individual
           projects within the airport of the future programme.
           Changes to the timing of some infrastructure projects
           will see other aeronautical projects come forward.

                                                             1

                                                                 3

                                                                      4

                              2

           ▲ Reference image only, actual design will vary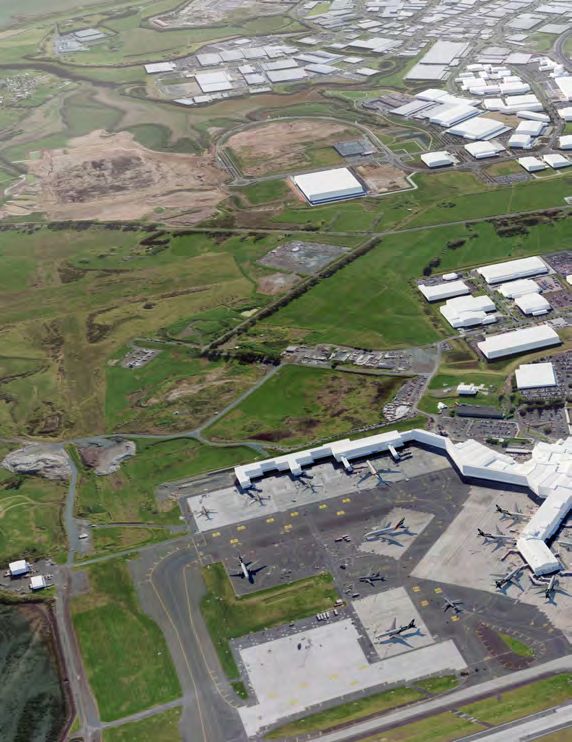
Several anchor projects are            Airfield
    currently in procurement               1   Northern runway
    stages – including work on our         2   Northern stands and taxiways
    northern stands and taxiways
    and the northern road network.         Terminal
    These are critical enabling or         3   New cargo terminal
    capacity projects to support           4   New international arrivals
    the wider airport development
    programme. We have also
                                           5   New domestic jet facility
    identified a new location              6   Domestic terminal rejuvenation
    for a new cargo terminal,              Transport
    allowing us to initiate a staged
                                           7   Pick-up / drop-off and
    relocation of cargo facilities             Multi-storey carpark 1
    away from the
    terminal precinct.
                                           8   Northern road network

                          8

7

    5                                  6

                                                                            Interim report 2019   5
Investing in our airport of the future programme
            extends well beyond an economic development story.
            We are also investing to extend our social, cultural
            and environmental contributions.

 benefits
 the
Sharing

              Auckland Airport’s Tanya Ross takes part in planting
              40,000 native trees at a Million Trees / Matariki Tu Ra-kau
              community event at Puhinui Reserve in Wiri, adjacent to
              our airport precinct.

              Te Manukanuka o Hoturoa marae
              Ministers of the Government’s Maori caucus (Hon Kelvin Davis,
              Hon Willie Jackson, MP Willow-Jean Prime) are welcomed
              onto the Te Manukanuka o Hoturoa marae to hear more about
              how we are connecting people in our local communities through
              Ara – Auckland Airport’s jobs and skills hub.
At home in the new International terminal
Lance Peteru is a man who loves working                    Ara was the gateway for Lance’s new job.
with and helping people.                                   He balances it with the volunteering work he
Lance is the chef’s assistant at Best Ugly                 does, helping run a soup kitchen in Mangere,
Bagels, one of the international terminal’s                which feeds up to 200 people each week.
newest food outlets.
Lance has seen the atmosphere within
terminal transform and hears customers
speak of the “amazing” space, with its wide                The thing I love the most about working at
selection of outlets to shop, relax, eat and               Auckland Airport is the people and giving
drink while they wait to travel.                           the best service possible. You meet a lot
“There is a real buzz inside the terminal                  of interesting people in this role. I enjoy
right now,” Lance says. “It is very much                   and respect the different cultures you get
a family culture, with so many different                   to work with and serve each day. Giving
ethnic groups across the people I work                     them the best smile ever – that’s what
with and the passengers I meet and serve.                  it’s all about. I never miss a day’s work –
It’s like they all feel like they’re at home,”             I can’t wait to get back each day.
Lance says.                                                Lance Peteru

▲ Ara (Auckland Airport’s jobs and skills hub) placement: Lance Peteru, chef’s assistant at Best Ugly Bagels

                                       5
             YEARS
             OF GLOBAL
             RECOGNITION

For the 8th year running we            We maintained our five-star               We completed a pay equity
were globally recognised               assessment (out of five)                  review that resulted in positive
for our commitment to                  by the Global Real Estate                 changes and enhanced how
sustainability by our                  Sustainability Benchmark,                 we recognise the value and
inclusion in the Dow Jones             which focuses on infrastructure           contribution our people.
Sustainability Index (DJSI).           and property assets.

                                                                                              Interim report 2019   7
What we have achieved
in the six months to
31 December 2018:

Passengers
   Domestic                  4.8m            4.0%
   International             5.3m            4.4%
   International transits    0.5m            (5.2)%

         Revenue

         11.5%                           $370.6m
         Operating EBITDAFI

         10.8%                           $277.1m
         Reported profit after tax

         (11.3)%                         $147.2m

Health                                      Ara – Airport Jobs
and safety                                  and Skills Hub
                   Reporting of safety
    5.6%           observations, hazards
                   and near-misses
                                            279     Training
                                                    opportunities

                                            159     Total job

    9.0%           Employee recordable              placements
                   injury rate

                                            124     South Aucklanders
                                                    placed in jobs
3.7%
10.6m
Passengers
Underlying profit
2.9% $136.9m
Dividend per share
2.3% 11.00 cents
Underlying earnings per share
2.1% 11.37 cents
$345,781
provided to the Auckland Airport
Community Trust to support learning,
literacy and life skills in South Auckland
Interim report 2019 9Nau mai –
welcome,
It has been another busy and positive
period for Auckland Airport, and we
have reached some significant
milestones in our 30-year programme
to build the airport of the future.
We completed important terminal and Retail income totalled $110.8 million
transport-specific projects as well as (up 24.6 %), reflecting the completion
making significant progress on the design, of the significantly expanded floor space in
planning and procurement phases of our the international terminal and the new
infrastructure programme. Passenger retail, food and beverage options that
numbers in the period continued to grow this project has delivered for our customers.
despite a very dynamic aviation market, Strong investment property development
and we recorded another strong financial supported by strong pre-leasing and rental
performance for the half year. activity translated into an annualised rent
Total passenger numbers were 10.6 million, roll of $94.0 million, up 4.4% against the
up 3.7%. International travellers (excluding prior corresponding period.
transit) reached 5.3 million (up 4.4% on the Queenstown Airport also saw strong
first half of FY18), predominantly driven by passenger growth in the period, with total
additional capacity on Asian, Pacific Island passenger numbers growing by 9.3% to
and North American routes. International 1.2 million. International travellers reached
transit travellers were down 5.2% to 0.5 356,000 (up 6.7% on the first half of FY18)
million. Domestic travellers increased by driven by increased capacity across the
4.0% to 4.8 million, primarily driven by Tasman, and domestic travellers increased
additional capacity on main trunk routes. 10.5% to 830,000 – also driven by
It is also pleasing to see the growing increased capacity, particularly on the
cultural, social, economic and Auckland to Queenstown route.
environmental contribution Auckland Airport The underlying profit share from
is generating through a broad range of Queenstown Airport decreased 4.5% to
community, regional and national initiatives, $2.1 million due to one-off expenses relating
leveraging off our multi-billion dollar to long-term master planning, as well as
investment programme. increased depreciation and amortisation
costs. While occupancy at the Novotel
Performance Hotel remained strong during the period,
Total revenue was $370.6 million, up higher operating costs have resulted in a
11.5% and earnings before interest decrease in Auckland Airport’s share of
expense, taxation, depreciation, fair value underlying profit by 4.5% to $2.1 million.
adjustments and investments in associates Our total share of the underlying profit from
(EBITDAFI) increased by 10.8% to associates was significantly down on the
$277.1 million. Reported profit after tax prior period, which is largely attributable to
was $147.2 million with an underlying net the sale of our interest in North Queensland
profit increase of 2.9% to $136.9 million. Airports in 2018.$136.9m
AN INCREASE OF 2.9%
Underlying profit
The directors and management of
Airport of the future programme Auckland Airport understand the
In June 2017, we set prices for the current importance of reported profits meeting
five-year pricing period and announced our accounting standards. However, due to
corresponding five-year investment plan and the complexity of accounting standards,
forecast capital expenditure envelope at that it may be difficult for investors to
time, along with high-level guidance about compare one financial year’s results with
the following five-year period (2023-2027). another. Therefore, we also provide an
As market conditions have changed over the underlying profit measure to help
last two years and as we have transitioned investors compare profits between years
into more detailed design and planning and to make comparisons between
stages for a number of major projects, we different companies with confidence. We
now have greater clarity about the also believe that an underlying profit
complexity of the development programme measure can assist investors in
in our live operating environment and the understanding what is happening in a
challenges associated with New Zealand’s business such as Auckland Airport where
construction market. revaluation changes can distort short-
We have made considerable progress over term financial results or where one-off
the past six months, working closely with transactions, both positive and negative,
our airline partners to understand their can occur.
requirements for the new domestic jet facility For several years, Auckland Airport has
and international arrivals projects in referred to underlying profits alongside
particular. These deeper design insights will reported results. We do so not only when
deliver improved project outcomes in the we report our results but also when we
future including planning certainty, improved give our market guidance (where we
cost control and a realistic and achievable exclude fair value changes and other
build programme. one-off items) or when we consider
This process has necessarily led to some dividends and our policy to pay 100% of
scope and sequencing changes for individual underlying net profit after tax, excluding
projects within the airport of the future unrealised gains and losses arising from
programme. However, we remain committed revaluation of property or treasury
to the overall investment programme. instruments and other one-off items.
Further reviews of project scope, system However, in referring to underlying profits,
capacity and execution has led to changes we acknowledge our obligation to show
in sequencing for our key aeronautical investors how such results have been
projects that will form the foundation of our derived. The reconciliation for the current
airport of the future developments through period can be found on page 16.
Interim report 2019 11to 2027. Several anchor projects are now During the period several projects delivered
into procurement stages – including work steady improvements to the airport
on our northern stands and taxiways and experience for our customers, including:
the northern road network, and these are doubling the number of self-service kiosks (to
critical enabling or capacity projects that 120); rolling out 4,000 new complimentary
support the wider airport terminal braked baggage trolleys, procuring four new
development programme. Avi ramps to provide customers a safer,
Connected with these airfield and roading more comfortable and faster disembarkation
projects we have also identified a new experience and continuing to invest in the
location for a new air cargo terminal Auckland Airport app (downloaded more
allowing us to initiate a staged relocation than 34,500 times). In addition, we are
of current cargo facilities away from the launching a trial WeChat shopping mall for
terminal precinct, creating new capacity for Chinese tourists together with airline
terminal construction staging and removing partners; expanding our online retail channel
transport demands on the central terminal (The Mall), and developing plans to expand
precinct areas. and enhance the Strata Club.
We will continue to work with customers, Through the Auckland Airport led Airport
stakeholders and the construction industry Capacity Enhancement working group,
to understand market capacity and ensure which includes Airways and our airline
we align our programme appropriately. partners, we have agreed a pathway to
increase peak hour air traffic movements
Building momentum in a staged manner, with a targeted capacity
and delivering benefits of 47 movements per hour in 2020 and
As one of New Zealand’s busiest hubs for 50 movements by 2022.
tourism, trade and travel, the early stages In the first half of the financial year, we also
of our multi-billion, inter-generational completed important transport-specific
aeronautical infrastructure programme are projects, including the Landing Road
already delivering substantial benefits, intersection upgrade in conjunction with
through significant new capacity, resilience NZTA and the Nixon Road bypass.
and choice for our customers, airlines and We are aware that our travellers and airlines
operational partners. rely on us to provide safe, timely and efficient
During the period a significant milestone services every day, and we take that
was the completion of the second of two responsibility seriously. This will remain at the
major terminal expansion projects delivering forefront of our planning and operations as
a combined 55,000m2 of newly built or our investment journey continues.
refurbished terminal infrastructure in the
international terminal building. Aviation markets
The international terminal building Tourism and trade markets performed in line
departures upgrade now offers increased with expectations despite a dynamic
choice for travellers through expanded aviation market: North America and
and more diverse retail, food and beverage New Zealand outbound tourism remained
services – and a truly contemporary, strong, the Chinese market continued to
New Zealand experience for our moderate while being offset by emerging
international guests. Asian markets outside China – notably a
quadrupling in passenger numbers on
We also started work on a multi-year
services from Indonesia and services from
programme to rejuvenate the existing
the Philippines. We also saw new capacity
domestic terminal, with changes to the
added to the network in the period with
retail layout and improvements in
Singapore Airlines adding a new daily flight
bathrooms and security screening areas.
to Singapore, Air New Zealand launchingnew direct services to Chicago and underlying earnings per share of up to
Taipei, and United Airlines returning to year- 4.5% in 2019, with slower growth than in
round services. recent years reflecting:
• the second year of lower international
Regulatory and aeronautical
passenger charges of the new five-year
pricing update
aeronautical pricing period
In November 2018 the Commerce
• increasing interest and depreciation
Commission issued its review of our prices
expenses associated with the recent
for the 2018-2022 financial years, and in
step up in our infrastructure build.
that review it concluded our target return
was not fully justified. As noted above, the additional time invested
in these formative stages has led to lower
Estimating a target return is not an exact
capital expenditure than planned for the first
science and the Commission acknowledged
half of the 2019 financial year. We now expect
that Auckland Airport could justify a slightly
total capital expenditure for the 2019 financial
higher return than the Commission’s
year to be between $280 million and $330
benchmark estimate.
million, down from the previously indicated
We carefully considered the Commerce range of $450 million to $550 million.
Commission’s final report on pricing and
We are still forecasting that the total value
have decided to reduce our charges to
of commissioned aeronautical assets for
airlines by $33 million over the five year
the 2018-2022 financial years will be broadly
period to 2022 in net present value terms,
consistent with the five-year forecast
or an equivalent of 31c per passenger. This
envelope released to the market in mid-2017.
reflects a reduction in our aeronautical
target return from 6.99% to 6.62%. This outlook remains subject to factors
such as material adverse events, significant
In our view the earlier prices we set for
one-off expenses, non-cash fair value
airlines were fair, competitive and in line with
changes to property, and deterioration as a
international standards, however we
result of global market conditions or other
acknowledge the Commission reached a
unforeseeable circumstances.
different view on target return. We have
recognised the Commission’s feedback in In closing, we wish to thank all our people,
making this reduction and believe our communities and customers for their hard
position is justified based on Auckland work, patience and understanding during
Airport specific risks and our multi-billion this period of airport transformation.
dollar 30-year infrastructure programme. We look forward to updating you on our
The reductions, to be implemented by way continued progress at the 2019 full year
of discount on landing and passenger result, later this year.
charges, will take effect from July 1, 2019.
Effective average charges per passenger to
airlines have already been falling this pricing
period in real terms and these changes will
lower real prices further.
Outlook Dr Patrick Strange,
Our profit outlook for the 2019 financial Chair
year remains unchanged. We expect
underlying net profit after tax (excluding any
fair value changes and other one-off items)
to be between $265 million and $275
million. This would deliver growth in the Adrian Littlewood
Chief Executive
Interim report 2019 13Financial
summary
Our total profit after tax for the six operations. These changes took place within
months to 31 December 2018 was down an increasingly competitive recruitment
11.3% to $147.2 million, while underlying market.
profit after tax increased 2.9% to Our earnings before interest expense,
$136.9 million. taxation, depreciation, fair value adjustments
Revenue increased 11.5% to $370.6 million. and investments in associates (EBITDAFI)
A 5.8% increase in aeronautical revenue increased 10.8% to $277.1 million.
was driven by passenger growth and Our total share of the underlying profit from
increasing aircraft movements, partly offset associates was $4.2 million for the first six
by our second successive year of a months of the 2019 financial year, down
reduction in some of our aeronautical tariffs. 62.5% following the sale of our interest in
Our significant investment in infrastructure North Queensland Airports in 2018. The
over recent years has enabled a 24.6% underlying profit share from Queenstown
increase in retail income, primarily driven by Airport decreased 4.5% to $2.1 million due
an expanded retail area in the international to one-off expenses relating to long-term
terminal. In addition, continued passenger master planning, as well as increased
growth and a strong performance from the depreciation and amortisation costs.
Strata Lounge have also contributed to the While occupancy at the Novotel Hotel
retail growth during the period. Investment remained strong during the period, higher
property rental income increased 14.6% operating costs have resulted in a decrease
during the period due to the development of in Auckland Airport’s share of underlying
new properties and growth in the existing profit by 4.5% to $2.1 million.
portfolio.
The interim dividend for the 2018 financial
Operating expenses increased 13.6% to year is up 2.3% to 11.00 cents per share.
$93.5 million, in part due to greater asset It will be imputed at the company tax
management, maintenance and airport rate of 28% and paid on 5 April 2019 to
operations. Staff costs increased by 9.2% shareholders who are on the register at
as a result of the ongoing expansion of our the close of business on 22 March 2019.
business, with additional headcount largely Our performance in the six months to
driven by a number of contract roles that 31 December 2018 means that underlying
were transitioned over to permanent earnings per share have continued to
positions in support of the airport increase, up 2.1% to 11.4 cents per share.
development and delivery team, including a
number of added specialist roles withinUnderlying profit
Reconciliation of underlying profit to reported profit
6 months to 31 December 2018 6 months to 31 December 2017
Reported Adjustments Underlying Reported Adjustments Underlying
profit $M profit profit $M profit
$M $M $M $M
EBITDAFI per
Income Statement 277.1 – 277.1 250.1 – 250.1
Share of profit of associates 4.3 (0.1) 4.2 4.4 – 4.4
Share of profit of associate
held for sale – – – 6.7 0.1 6.8
Derivative fair value
(decreases) increases 0.2 (0.2) – (3.0) 3.0 –
Investment property fair value
increases 11.1 (11.1) – 41.5 (41.5) –
Depreciation (50.0) – (50.0) (40.7) – (40.7)
Interest expense and other
finance costs (40.1) – (40.1) (38.6) – (38.6)
Taxation expense (55.4) 1.1 (54.3) (54.5) 5.6 (48.9)
Profit after tax 147.2 (10.3) 136.9 165.9 (32.8) 133.1
The table above shows how we reconcile • We recognise gains or losses in the
reported profit after tax and underlying profit income statement arising from valuation
after tax for the six-month periods ended 31 movements in interest rate derivatives
December 2018 and 31 December 2017. that are not hedge accounted and where
The following adjustments have been made the counter-party credit risk on
to show underlying profit after tax for the derivatives has an impact on accounting
six-month periods ended 31 December hedging relationships. These gains or
2018 and 31 December 2017: losses, as in the case of investment
• We have reversed out the impact of property, are unrealised and derivative
revaluations of investment property and gains or losses are expected to reverse
associates in the first six months of the out over their lives.
2019 and 2018 financial years. An • To be consistent, we have adjusted the
investor should monitor changes in revaluations of investment property and
investment property over time as a financial derivatives that are contained
measure of growing value. However, a within the share of profit of associates in
change in one particular period can be the first six months of the 2019 and 2018
too short for the purposes of measuring financial years.
performance. Changes between periods • We also allow for the taxation impacts of
can be volatile and, consequently, will the above adjustments in the first six
have an impact on comparisons. Finally, months of the 2019 and 2018 financial
the revaluation is unrealised and, years.
therefore, is not considered when
determining dividends in accordance
with the dividend policy.
Interim report 2019 15Financial statements
Consolidated interim income statement
FOR THE SIX MONTHS ENDED 31 DECEMBER 2018

                                                                                      Unaudited      Unaudited
                                                                                    6 months to    6 months to
                                                                                   31 Dec 2018    31 Dec 2017
                                                                           NOTES            $M             $M

Income
Airfield income                                                                           64.3            59.9
Passenger services charge                                                                 93.3            89.1
Retail income                                                                            110.8            88.9
Rental income                                                                             53.3            46.9
Rates recoveries                                                                            3.1            3.0
Car park income                                                                           32.9            31.4
Interest income                                                                             1.0            0.4
Other income                                                                              11.9            12.8
Total income                                                                             370.6          332.4
Expenses
Staff                                                                          4          29.8            27.3
Asset management, maintenance and airport operations                                      38.6            31.7
Rates and insurance                                                                         7.9            6.7
Marketing and promotions                                                                    5.5            5.2
Professional services and levies                                                            4.9            5.7
Other expenses                                                                              6.8            5.7
Total expenses                                                                            93.5            82.3
Earnings before interest expense, taxation, depreciation, fair
value adjustments and investments in associates (EBITDAFI)                               277.1          250.1
Share of profit of associates and joint ventures                                            4.3            4.4
Share of profit of associate held for sale                                                    –            6.7
Derivative fair value increase / (decrease)                                                 0.2            (3.0)
Investment property fair value increase                                        9          11.1            41.5
Earnings before interest, taxation and depreciation (EBITDA)                             292.7          299.7
Depreciation                                                                              50.0            40.7
Earnings before interest and taxation (EBIT)                                             242.7          259.0
Interest expense and other finance costs                                       4          40.1            38.6
Profit before taxation                                                         3         202.6          220.4
Taxation expense                                                                          55.4            54.5
Profit after taxation attributable to owners of the parent                               147.2          165.9

                                                                                          Cents          Cents
Earnings per share
Basic and diluted earnings per share                                                     12.23          13.89

THE FINANCIAL STATEMENTS FOR THE SIX-MONTH PERIODS HAVE NOT BEEN AUDITED. THEY HAVE BEEN THE SUBJECT OF A REVIEW
BY THE AUDITORS PURSUANT TO NEW ZEALAND STANDARD FOR REVIEW ENGAGEMENTS 2410 FOR THE SIX-MONTH PERIODS TO
31 DECEMBER 2018 AND 31 DECEMBER 2017. THE FULL YEAR FINANCIAL STATEMENTS TO 30 JUNE 2018 HAVE BEEN AUDITED. THE
ACCOMPANYING NOTES FORM PART OF THESE FINANCIAL STATEMENTS.
Consolidated interim statement of comprehensive income
FOR THE SIX MONTHS ENDED 31 DECEMBER 2018
Unaudited Unaudited
6 months to 6 months to
31 Dec 2018 31 Dec 2017
$M $M
Profit for the period 147.2 165.9
Other comprehensive income
Items that may be reclassified subsequently to the income statement:
Cash flow hedges:
Fair value losses recognised in the cash flow hedge reserve (10.9) (2.3)
Realised losses transferred to the income statement 1.0 2.3
Tax effect of movements in the cash flow hedge reserve 4.3 –
Total cash flow hedge movement (5.6) –
Movement in cost of hedging reserve (0.6) –
Tax effect of movement in cost of hedging reserve 0.2 –
Movement in share of reserves of associate held for sale – 0.4
Movement in foreign currency translation reserve – 3.8
Items that may be reclassified subsequently to the income statement (6.0) 4.2
Total other comprehensive (loss) / income (6.0) 4.2
Total comprehensive income for the period, net of tax attributable to
the owners of the parent 141.2 170.1
THE FINANCIAL STATEMENTS FOR THE SIX-MONTH PERIODS HAVE NOT BEEN AUDITED. THEY HAVE BEEN THE SUBJECT OF A REVIEW
BY THE AUDITORS PURSUANT TO NEW ZEALAND STANDARD FOR REVIEW ENGAGEMENTS 2410 FOR THE SIX-MONTH PERIODS TO
31 DECEMBER 2018 AND 31 DECEMBER 2017. THE FULL YEAR FINANCIAL STATEMENTS TO 30 JUNE 2018 HAVE BEEN AUDITED. THE
ACCOMPANYING NOTES FORM PART OF THESE FINANCIAL STATEMENTS.
Interim report 2019 19Consolidated interim statement of changes in equity
FOR THE SIX MONTHS ENDED 31 DECEMBER 2018
Property, plant
Issued and Cancelled and equipment
paid-up share revaluation
Six months ended 31 December 2018 capital reserve reserve
(unaudited) NOTES $M $M $M
At 30 June 2018 404.2 (609.2) 4,913.9
Adjustment on adoption of NZ IFRS 9 – – –
At 1 July 2018 404.2 (609.2) 4,913.9
Profit for the period – – –
Other comprehensive loss – – –
Total comprehensive income – – –
Shares issued 10 34.7 – –
Long-term incentive plan – – –
Dividend paid 7 – – –
At 31 December 2018 438.9 (609.2) 4,913.9
Six months ended 31 December 2017
(unaudited)
At 1 July 2017 348.3 (609.2) 3,729.0
Profit for the period – – –
Other comprehensive income – – –
Total comprehensive income – – –
Reclassification to retained earnings – – (1.0)
Shares issued 10 28.5 – –
Dividend paid 7 – – –
At 31 December 2017 376.8 (609.2) 3,728.0
THE FINANCIAL STATEMENTS FOR THE SIX-MONTH PERIODS HAVE NOT BEEN AUDITED. THEY HAVE BEEN THE SUBJECT OF A REVIEW
BY THE AUDITORS PURSUANT TO NEW ZEALAND STANDARD FOR REVIEW ENGAGEMENTS 2410 FOR THE SIX-MONTH PERIODS TO
31 DECEMBER 2018 AND 31 DECEMBER 2017. THE FULL YEAR FINANCIAL STATEMENTS TO 30 JUNE 2018 HAVE BEEN AUDITED. THE
ACCOMPANYING NOTES FORM PART OF THESE FINANCIAL STATEMENTS.Share- Foreign
based Cash flow Cost of Share of currency
payments hedge hedging reserves of translation Retained
reserve reserve reserve associates reserve earnings Total
$M $M $M $M $M $M $M
1.3 (38.2) – 28.8 – 981.3 5,682.1
– 3.3 (3.3) – – – –
1.3 (34.9) (3.3) 28.8 – 981.3 5,682.1
– – – – – 147.2 147.2
– (5.6) (0.4) – – – (6.0)
– (5.6) (0.4) – – 147.2 141.2
– – – – – – 34.7
(0.1) – – – – – (0.1)
– – – – – (132.3) (132.3)
1.2 (40.5) (3.7) 28.8 – 996.2 5,725.6
1.1 (31.9) – 20.4 (9.3) 580.6 4,029.0
– – – – – 165.9 165.9
– – – 0.4 3.8 – 4.2
– – – 0.4 3.8 165.9 170.1
– – – – – 1.0 –
– – – – – – 28.5
– – – – – (125.3) (125.3)
1.1 (31.9) – 20.8 (5.5) 622.2 4,102.3
Interim report 2019 21Consolidated interim statement of financial position
AS AT 31 DECEMBER 2018
Unaudited Audited
As at As at
31 Dec 2018 30 Jun 2018
NOTES $M $M
Non-current assets
Property, plant and equipment 8 6,453.6 6,378.0
Investment properties 9 1,443.0 1,425.6
Investment in associates and joint ventures 6 102.1 104.4
Derivative financial instruments 121.7 110.4
8,120.4 8,018.4
Current assets
Cash and cash equivalents 64.8 106.7
Inventories 0.2 0.2
Trade and other receivables 102.8 71.5
167.8 178.4
Total assets 8,288.2 8,196.8
Shareholders’ equity
Issued and paid-up capital 10 438.9 404.2
Reserves 4,290.5 4,296.6
Retained earnings 996.2 981.3
5,725.6 5,682.1
Non-current liabilities
Term borrowings 11 1,856.1 1,893.5
Derivative financial instruments 49.1 38.9
Deferred tax liability 253.9 251.4
Other term liabilities 1.9 1.8
2,161.0 2,185.6
Current liabilities
Accounts payable and accruals 96.3 148.0
Taxation payable 12.3 12.9
Derivative financial instruments 0.4 1.3
Short-term borrowings 11 291.8 166.8
Provisions 0.8 0.1
401.6 329.1
Total equity and liabilities 8,288.2 8,196.8
THE FINANCIAL STATEMENTS FOR THE SIX-MONTH PERIODS HAVE NOT BEEN AUDITED. THEY HAVE BEEN THE SUBJECT OF A REVIEW
BY THE AUDITORS PURSUANT TO NEW ZEALAND STANDARD FOR REVIEW ENGAGEMENTS 2410 FOR THE SIX-MONTH PERIODS TO
31 DECEMBER 2018 AND 31 DECEMBER 2017. THE FULL YEAR FINANCIAL STATEMENTS TO 30 JUNE 2018 HAVE BEEN AUDITED. THE
ACCOMPANYING NOTES FORM PART OF THESE FINANCIAL STATEMENTS.Consolidated interim cash flow statement
FOR THE SIX MONTHS ENDED 31 DECEMBER 2018
Unaudited Unaudited
6 months to 6 months to
31 Dec 2018 31 Dec 2017
NOTES $M $M
Cash flow from operating activities
Cash was provided from:
Receipts from customers 352.1 322.9
Interest received 1.0 0.5
353.1 323.4
Cash was applied to:
Payments to suppliers and employees (110.7) (87.7)
Income tax paid (49.0) (49.1)
Interest paid (38.3) (39.2)
(198.0) (176.0)
Net cash flow from operating activities 5 155.1 147.4
Cash flow from investing activities
Cash was provided from:
Dividends from associates and joint ventures 7.2 9.9
7.2 9.9
Cash was applied to:
Purchase of property, plant and equipment (153.3) (186.6)
Interest paid – capitalised (2.7) (5.2)
Expenditure on investment properties (24.5) (54.7)
Investment in joint ventures (0.6) –
(181.1) (246.5)
Net cash flow applied to investing activities (173.9) (236.6)
Cash flow from financing activities
Cash was provided from:
Increase in share capital – 0.1
Increase in borrowings 150.0 312.2
150.0 312.3
Cash was applied to:
Decrease in borrowings (75.0) (145.0)
Dividends paid 7 (98.1) (96.9)
(173.1) (241.9)
Net cash flow applied to financing activities (23.1) 70.4
Net decrease in cash held (41.9) (18.8)
Opening cash brought forward 106.7 45.1
Ending cash carried forward 64.8 26.3
THE FINANCIAL STATEMENTS FOR THE SIX-MONTH PERIODS HAVE NOT BEEN AUDITED. THEY HAVE BEEN THE SUBJECT OF A REVIEW
BY THE AUDITORS PURSUANT TO NEW ZEALAND STANDARD FOR REVIEW ENGAGEMENTS 2410 FOR THE SIX-MONTH PERIODS TO
31 DECEMBER 2018 AND 31 DECEMBER 2017. THE FULL YEAR FINANCIAL STATEMENTS TO 30 JUNE 2018 HAVE BEEN AUDITED. THE
ACCOMPANYING NOTES FORM PART OF THESE FINANCIAL STATEMENTS.
Interim report 2019 23Notes and accounting policies
FOR THE SIX MONTHS ENDED 31 DECEMBER 2018
1. Corporate information
Auckland International Airport Limited (the The financial statements presented are for
company or Auckland Airport) is a company Auckland Airport and its wholly owned subsidiaries
established under the Auckland Airport Act 1987 and associates (the group).
and was incorporated on 20 January 1988 under
These interim financial statements were authorised
the Companies Act 1955. The company was
for issue in accordance with a resolution of the
re-registered under the Companies Act 1993 on
directors on 22 February 2019.
6 June 1997. The company is an FMC Reporting
Entity under Part 7 of the Financial Markets
Conduct Act 2013.
2. Basis of preparation and accounting policies
The interim financial statements have been Classification and measurement
prepared in accordance with generally accepted From 1 July 2018, Auckland Airport classifies its
accounting practice in New Zealand and the financial assets in the following measurement
requirements of the Financial Markets Conduct Act categories:
2013 and the Main Board/Debt Market Listing
• those to be measured subsequently at fair value
Rules of NZX Limited. The interim financial
(either through other comprehensive income or
statements comply with New Zealand Equivalent
through profit or loss), and
to International Accounting Standards NZ IAS 34
and IAS 34 Interim Financial Reporting. • those to be measured at amortised cost.
Auckland Airport is designated as a profit-oriented The classification depends on the entity’s business
entity for financial reporting purposes. model for managing the financial assets and the
contractual terms of the cash flows. The
These interim financial statements are not required
classification of financial instruments has not
to and do not make disclosure of all of the
resulted in any reclassification between
information required to be included in an annual
measurement categories for Auckland Airport’s
financial report. Accordingly, this report should be
financial assets and liabilities compared with prior
read in conjunction with the financial statements
reporting periods.
and related notes included in Auckland Airport’s
Annual Report for the year ended 30 June 2018 Impairment
(‘2018 Annual Report’). Under NZ IFRS 9, on initial recognition of a financial
The accounting policies set out in the 2018 Annual asset, Auckland Airport assesses on a forward-
Report have been applied consistently to all looking basis, the expected credit loss associated
periods presented in these interim financial with its financial assets carried at amortised cost.
statements, except as identified below. The For trade receivables, the simplified approach to
following changes to accounting standards have measuring expected credit loss is adopted, which
been adopted in the preparation of these financial uses a lifetime expected loss allowance.
statements.
Based on an assessment carried out, the
NZ IFRS 9 Financial Instruments is effective for impairment loss on financial assets was immaterial.
annual periods beginning on or after 1 January As a result, there have been no measurement
2018. NZ IFRS 9 addresses the classification and changes required to these financial statements by
measurement of financial assets and financial NZ IFRS 9.
liabilities and replaces the NZ IAS 39 requirements
for hedge accounting. The implementation of NZ Hedging
IFRS 9 has resulted in changes to accounting The cross-currency interest rate swaps and
policies as follows: interest rate swaps in place as at 30 June 2018
qualified as fair value and cash flow hedges
under IFRS 9. Auckland Airport’s risk management
strategies and hedge documentation are aligned
with the requirements of IFRS 9 and these
hedging relationships are therefore treated as
continuing hedges.2. Basis of preparation and accounting policies CONTINUED
Changes in the fair value of the cost to convert of NZ IFRS 15 there were no changes in timing of
foreign currency to New Zealand dollars (NZD) revenue recognition. The new standard does not
of cross-currency interest rate swaps are now apply to rental income, which is recognised under
separately accounted for as a cost of hedging and NZ IAS 17.
recognised within a new reserve within equity (cost
Application of these standards by the group has
of hedging reserve). Auckland Airport has applied
not materially affected any of the amounts
NZ IFRS 9 retrospectively but has elected not to
recognised in these financial statements or the
restate comparative information as there is no
disclosures.
material quantitative impact on the financial
statements. NZ IFRS 16 Leases is effective for annual periods
beginning on or after 1 January 2019. The group
NZ IFRS 15 Revenue from Contracts with
reviewed leases where the group is the lessor and
Customers is effective for annual reporting periods
has concluded that these will remain as operating
beginning on or after 1 January 2018. It replaces
leases under NZ IFRS 16. The group also reviewed
the revenue recognition guidance in NZ IAS 18
leases where the group is the lessee and has
Revenue and NZ IAS 11 Construction Contracts.
concluded that there is no material impact on the
NZ IFRS 15 establishes a five-step model for
financial statements. The group will apply NZ IFRS
revenue recognition, which is centred on identifying
16 from 1 July 2019. Further information can be
the performance obligations in a contract and
found in the 2018 Annual Report.
recognising revenue when each performance
obligation is satisfied. Auckland Airport has These financial statements are presented in
considered the new guidance and identified the New Zealand dollars and all values are rounded to
main performance obligations for each of its key the nearest million dollars ($M) and one decimal
revenue streams. For all revenue streams in scope point unless otherwise indicated.
3. Segment information
(a) Identification of reportable segments (b) Types of services provided
The group has identified its operating segments Aeronautical
based on the internal reports reviewed and used The aeronautical business provides services
by the chief executive, as the chief operating that facilitate the movement of aircraft, passengers
decision maker, in assessing performance and in and cargo and provides utility services that support
determining the allocation of resources. the airport. The aeronautical business also earns
The operating segments are identified by rental revenue from space leased in facilities such
management based on the nature of services as terminals.
provided. Discrete financial information about each Retail
of these operating segments is reported to the The retail business provides services to the retailers
chief executive at least monthly. The chief within the terminals and provides car parking
executive assesses performance of the operating facilities for passengers, visitors and airport staff.
segments based on segment EBITDAFI. Interest
income and expenditure, taxation, depreciation, Property
fair value adjustments, and share of profits of The property business earns rental revenue from
associates are not allocated to operating segments space leased on airport land outside the terminals
as the group manages the cash position and including cargo buildings, hangars and stand-alone
assets at a group level. investment properties.
Interim report 2019 25Notes and accounting policies CONTINUED
FOR THE SIX MONTHS ENDED 31 DECEMBER 2018
3. Segment information CONTINUED
Six months ended 31 December 2018 Aeronautical Retail Property Total
(unaudited) $M $M $M $M
Total segment income 171.7 149.0 47.1 367.8
Total segment expenses 42.4 15.9 12.1 70.4
Segment earnings before interest expense,
taxation, depreciation, fair value adjustments
and investments in associates (EBITDAFI) 129.3 133.1 35.0 297.4
Six months ended 31 December 2017
(unaudited)
Total segment income 162.6 126.0 41.4 330.0
Total segment expenses 41.1 13.8 8.7 63.6
Segment earnings before interest expense,
taxation, depreciation, fair value adjustments
and investments in associates (EBITDAFI) 121.5 112.2 32.7 266.4
Income reported above represents income generated from external customers. There was no inter-segment
income in the period (31 December 2017: nil).
(c) Segment reconciliation of segment EBITDAFI to income statement:
Unaudited Unaudited
6 months to 6 months to
31 Dec 2018 31 Dec 2017
$M $M
Segment EBITDAFI 297.4 266.4
Unallocated external operating income 2.8 2.4
Unallocated external operating expenses (23.1) (18.7)
Total EBITDAFI as per income statement 277.1 250.1
Share of profit of associates and joint ventures 4.3 11.1
Depreciation (50.0) (40.7)
Derivative fair value increase / (decrease) 0.2 (3.0)
Investment property fair value increase 11.1 41.5
Interest expense and other finance costs (40.1) (38.6)
Profit before taxation 202.6 220.4
The income included in unallocated external operating income consists mainly of interest from third-party
financial institutions and income from telecommunication and technology services provided to tenants.
The expenses included in unallocated external operating expenses consists mainly of corporate staff
expenses and corporate legal and consulting fees.4. Profit for the period
Unaudited Unaudited
6 months to 6 months to
31 Dec 2018 31 Dec 2017
$M $M
Staff expenses comprise:
Salaries and wages 23.5 21.4
Employee benefits 2.0 2.1
Share-based payment plans 0.4 0.3
Defined contribution superannuation 0.8 0.7
Other staff costs 3.1 2.8
29.8 27.3
Interest expense and other finance costs comprise:
Interest on bonds and related hedging instruments 20.2 19.7
Interest on bank facilities and related hedging instruments 6.1 9.2
Interest on USPP notes and related hedging instruments 8.9 8.8
Interest on AMTN notes and related hedging instruments 5.3 4.0
Interest on commercial paper and related hedging instruments 2.3 2.1
42.8 43.8
Less capitalised borrowing costs (2.7) (5.2)
40.1 38.6
Interest rate for capitalised borrowings costs 4.29% 4.29%
The gross interest costs of bonds, bank facilities, USPP, AMTN and commercial paper, excluding the
impact of interest rate hedges, was $40.4 million for the period ended 31 December 2018 (31 December
2017: $42.3 million).
Interim report 2019 27Notes and accounting policies CONTINUED
FOR THE SIX MONTHS ENDED 31 DECEMBER 2018
5. Reconciliation of profit after taxation with cash flow from operating
activities
Unaudited Unaudited
6 months to 6 months to
31 Dec 2018 31 Dec 2017
$M $M
Profit after taxation 147.2 165.9
Non-cash items:
Depreciation 50.0 40.7
Deferred taxation expense 7.0 7.3
Share based payments 0.4 –
Equity accounted earnings from associates and joint ventures (4.3) (4.4)
Equity accounted earnings from associate held for sale – (6.7)
Investment property fair value increase (11.1) (41.5)
Derivative fair value (increase) / decrease (0.2) 3.0
Gain on foreign currency movements – (0.2)
Items not classified as operating activities:
Decrease in property, plant and equipment retentions and payables 51.7 34.5
(Increase) / decrease in investment property retentions and payables (2.8) 3.0
Movement in working capital:
Increase in trade and other receivables (31.3) (13.1)
Decrease in taxation payable (0.6) (1.9)
Decrease in accounts payable (51.0) (39.4)
Increase in other term liabilities 0.1 0.2
Net cash flow from operating activities 155.1 147.46. Associates and joint ventures
Movement in the group’s carrying amount of investments in associates and
joint ventures:
Unaudited Unaudited
6 months to 6 months to
31 Dec 2018 31 Dec 2017
$M $M
Movement in investment in associates and joint ventures continuing
Investment in associates at the beginning of the period 104.4 171.6
Further investment in joint ventures 0.6 –
Share of profit after tax of associates and joint ventures 4.3 4.4
Share of dividends received and repayment of partner contribution (7.2) (3.2)
Movement in investment in associate held for sale
Share of profit after tax of associate held for sale – 6.7
Share of reserves of associate held for sale – 0.4
Share of dividends received from associate held for sale – (3.9)
Foreign currency translation – 3.8
Investment in associates and joint ventures at the end of the period 102.1 179.8
Carrying value of investments in associates and joint ventures:
Unaudited Audited
As at As at
31 Dec 2018 30 Jun 2018
$M $M
Investment in associates and joint ventures continuing
Tainui Auckland Airport Hotel Limited Partnership 30.2 33.7
Tainui Auckland Airport Hotel 2 Limited Partnership 3.6 3.0
Queenstown Airport Corporation Limited 68.3 67.7
Total 102.1 104.4
Interim report 2019 29Notes and accounting policies CONTINUED
FOR THE SIX MONTHS ENDED 31 DECEMBER 2018
7. Distribution to shareholders
Unaudited Unaudited
6 months to 6 months to
31 Dec 2018 31 Dec 2017
Dividend payment date $M $M
2017 final dividend of 10.50 cps 20 October 2017 – 125.3
2018 final dividend of 11.00 cps 19 October 2018 132.3 –
Total dividends paid 132.3 125.3
The company has a dividend reinvestment plan. $98.1 million were paid in cash (31 December
During the period ended 31 December 2018, 2017: $28.4 million reinvested and $96.9 million
$34.2 million of dividends were reinvested and paid in cash).
8. Property, plant and equipment
Unaudited Audited
As at As at
31 Dec 2018 30 Jun 2018
$M $M
At fair value 6,403.4 6,267.2
At cost 160.4 132.4
Work in progress at cost 195.8 248.0
Accumulated depreciation (306.0) (269.6)
Net carrying amount 6,453.6 6,378.0
The group carries land, buildings and services, Additions to property, plant and equipment were
infrastructure and runway, taxiways and aprons at $104.4 million for the six months ended
fair value. 31 December 2018 (six months ended
31 December 2017: $155.7 million).
At 31 December 2018 the group assessed that
carrying amounts do not differ materially from fair Transfers from investment property were
value. $21.6 million for the six months ended
31 December 2018 (transfers to investment
Vehicles, plant and equipment and work in
property for the six months ended 31 December
progress are carried at cost.
2017: $1.1 million).9. Investment properties
Unaudited Audited
6 months to As at
31 Dec 2018 30 Jun 2018
$M $M
Balance at the beginning of the period 1,425.6 1,198.0
Additions – subsequent expenditure 26.5 54.2
Additions – acquisitions or development 1.4 20.1
Transfer (to) / from property, plant and equipment (note 8) (21.6) 1.1
Change in net revaluations 11.1 152.2
Balance at the end of the period 1,443.0 1,425.6
Investment property is measured at fair value, examined the likely effect on property values of the
which reflects market conditions at the statement investment environment applicable at the relevant
of financial position date. To determine fair value, time.
Auckland Airport commissions investment property
At 31 December 2018, a further review of one
valuations at 30 June each year and undertakes a
recently constructed investment property was
desktop review at 31 December each year.
performed by Savills. The reviews and market data
At 31 December 2018 and 31 December 2017, at 31 December 2018 concluded that there was a
a desktop review was performed by Auckland material movement in the fair value of that
Airport which comprised a review of recent particular property versus cost but no material fair
comparable transactional evidence of market sales value movements in the remainder of the portfolio.
and leasing activity using market data provided by
The valuation of the recently constructed
Colliers. The desktop review and market data
investment property resulted in an $11.1 million
provided by Colliers did not include full property
increase in the fair value at 31 December 2018
inspections or the issue of new reports but
(31 December 2017: $41.5 million increase).
10. Issued and paid-up capital
Unaudited Unaudited Unaudited Unaudited
6 months to 6 months to 6 months to 6 months to
31 Dec 2018 31 Dec 2017 31 Dec 2018 31 Dec 2017
$M $M Shares Shares
Opening issued and paid-up capital
at 1 July 404.2 348.3 1,201,875,336 1,192,614,174
Shares fully paid and allocated to
employees by employee share
scheme 0.3 0.1 64,200 11,000
Shares vested for employees
participating in long-term incentive
plans 0.2 – 125,515 –
Shares issued under the dividend
reinvestment plan 34.2 28.4 4,839,421 4,655,612
Closing issued and paid-up
capital 438.9 376.8 1,206,904,472 1,197,280,786
Interim report 2019 31Notes and accounting policies CONTINUED
FOR THE SIX MONTHS ENDED 31 DECEMBER 2018
11. Borrowings
Unaudited Audited
As at As at
31 Dec 2018 30 June 2018
$M $M
Current
Commercial paper 91.8 91.8
Bank facilities 100.0 –
Bonds 100.0 75.0
Total short-term borrowings 291.8 166.8
Non-current
Bank facilities 80.0 180.0
Bonds 875.0 825.0
USPP notes 608.4 592.2
AMTN notes 292.7 296.3
Total term borrowings 1,856.1 1,893.5
Total
Commercial paper 91.8 91.8
Bank facilities 180.0 180.0
Bonds 975.0 900.0
USPP notes 608.4 592.2
AMTN notes 292.7 296.3
Total borrowings 2,147.9 2,060.3
Bank facilities Bonds and notes
In July 2018 a new $100.0 million evergreen In the period to 31 December 2018 the company
standby facility with ANZ bank was established. undertook the following bond financing activity:
The new facility is perpetual in nature with an initial
• The repayment of $75.0 million of three-year
review period of 15 months. There was a
floating rate notes in October 2018;
corresponding reduction in existing standby
facilities by $100.0 million. • The issuance of $150.0 million of six-year, 3.51
percent fixed rate bonds in October 2018;
During the current and prior period, there were
no defaults or breaches on any of the borrowing
facilities.
12. Financial risk management
The group has a treasury policy which limits Further information on risk management is also
exposure to market risk for changes in interest contained in the corporate governance section of
rates and foreign currency, liquidity risk and the 2018 Annual Report.
counter-party credit risk. The group has no other
There have been no significant changes in the
material direct price risk exposure.
financial risk management objectives and policies
The interim consolidated financial statements since 30 June 2018.
do not include all financial risk management
information and disclosures and should be read
in conjunction with the group’s annual financial
statements for the year ended 30 June 2018.13. Fair value of financial instruments
There have been no transfers between levels of the The group’s bonds are classified as level 1.
fair value hierarchy used in measuring the fair value The fair value of the bonds is based on the
of financial instruments in the period to quoted market prices for these instruments at
31 December 2018 (30 June 2018: nil) balance date.
The following financial instruments are carried at The group’s USPP notes are classified as
amortised cost, which approximates their fair value: level 2. The fair value of the USPP notes has
been determined at balance date on a
• cash;
discounted cash flow basis using the USD
• trade and other receivables; Bloomberg Curve and applying discount factors
to the future USD interest payment and principal
• accounts payable and accruals; payment cash flows.
• other term liabilities; and The group’s AMTN notes are classified as level 2.
• borrowings issued at floating rates. The fair value of the AMTN notes has been
determined at balance date on a discounted cash
Borrowings issued at fixed rates, including bonds, flow basis using the AUD Bloomberg curve and
USPP notes and AMTN notes, are carried at applying discount factors to the future AUD interest
amortised cost, which may differ from their fair payment and principal payment cash flows.
value. The fair values are determined as follows.
Unaudited Audited
31 Dec 2018 30 Jun 2018
Carrying Fair Carrying Fair
amount value amount value
$M $M $M $M
Bonds 975.0 1,012.4 900.0 930.1
USPP Notes 608.4 607.3 592.2 599.8
AMTN Notes 292.7 293.4 296.3 303.2
The group’s derivative financial instruments are The forecast cash flows are discounted at a rate
carried at fair value and are classified as level 2. that reflects the credit risk of various counterparties
The fair values are determined on a discounted to the derivative financial instruments.
cash flow basis. The future cash flows are forecast
using the key inputs presented in the table below.
Unaudited Audited
Fair value Fair value
As at As at
31 Dec 2018 30 Jun 2018
$M $M Valuation key inputs
Interest rate swaps Forward interest rates (from observable
Liabilities (49.5) (40.2) yield curves) and contract interest rates.
Interest basis swaps Observable forward basis swap pricing
Assets 1.6 1.8 and contract basis rates.
Cross currency interest rate Forward interest and foreign exchange
swaps rates (from observable yield curves and
forward exchange rates) and contract
Assets 120.1 108.6 rates.
Interim report 2019 33Notes and accounting policies CONTINUED
FOR THE SIX MONTHS ENDED 31 DECEMBER 2018
14. Commitments
(a) Property, plant and equipment (b) Investment property
The group had contractual obligations to purchase The group had contractual obligations to purchase
or develop property, plant and equipment for or develop investment property for $214.1 million at
$63.8 million at 31 December 2018 (30 June 31 December 2018 (30 June 2018: $173.1 million).
2018: $77.2 million).
The group had contractual commitments for
repairs, maintenance and enhancements on
investment property for $4.2 million at 31
December 2018 (30 June 2018: $5.1 million).
15. Contingent liabilities
Noise insulation Firefighting foam clean up
The group has obligations to mitigate the impacts The group has an obligation to dispose of PFOS/
of aircraft noise on the local community in PFOA contaminated firefighting foam inventory.
accordance with a 2001 Environment Court PFOS/PFOA containing firefighting foam has been
determination. It offers acoustic treatment to widely used in the airport sector, globally and
schools and existing houses within defined areas. throughout New Zealand.
A total of 18 homeowners accepted offers during The Ministry for the Environment is yet to
the period and the group recorded a provision for determine if the airport sector will need to perform
the estimated cost of fulfilling its obligation to those any additional decontamination tasks other than
homeowners. disposing of surplus inventory, but our
investigations to determine the extent of any
It is estimated that, overall, further noise insulation
contamination are ongoing.
costs associated with the 2001 Environment Court
determination for the existing and planned second The group provided $1.2 million in the 2018
runway will not exceed $9.0 million (30 June 2018: financial year for the expected disposal costs.
$9.0 million). At this time, the potential cost of any yet to be
determined decontamination obligations has not
been provided for in the financial statements.
16. Events subsequent to balance date
On 22 February 2019, the directors approved On 14 February 2019, the directors of
the payment of a fully imputed interim dividend Queenstown Airport declared a dividend of
of 11 cents per share, amounting to $132.8 million $1.0 million. The group’s share of the dividend is
to be paid on 5 April 2019. $0.2 million and was received on 15 February 2019.You can also read