REGIONAL MARKETS INNOVATION LANDSCAPE BRIEF - IRENA
←
→
Page content transcription
If your browser does not render page correctly, please read the page content below

REGIONAL MARKETS INNOVATION LANDSCAPE BRIEF

© IRENA 2019
Unless otherwise stated, material in this publication may be freely used, shared, copied, reproduced, printed and/or stored,
provided that appropriate acknowledgement is given of IRENA as the source and copyright holder. Material in this publication that
is attributed to third parties may be subject to separate terms of use and restrictions, and appropriate permissions from these third
parties may need to be secured before any use of such material.

ISBN 978-92-9260-131-7

Citation: IRENA (2019), Innovation landscape brief: Regional markets, International Renewable Energy Agency, Abu Dhabi.

About IRENA
The International Renewable Energy Agency (IRENA) is an intergovernmental organisation that supports
countries in their transition to a sustainable energy future, and serves as the principal platform for
international co-operation, a centre of excellence, and a repository of policy, technology, resource and
financial knowledge on renewable energy. IRENA promotes the widespread adoption and sustainable
use of all forms of renewable energy, including bioenergy, geothermal, hydropower, ocean, solar and
wind energy in the pursuit of sustainable development, energy access, energy security and low-carbon
economic growth and prosperity. www.irena.org

Acknowledgements
This report was prepared by the Innovation team at IRENA’s Innovation and Technology Centre (IITC) and was authored by
Arina Anisie, Elena Ocenic and Francisco Boshell, with additional contributions and support by Harsh Kanani and Rajesh Singla
(KPMG India).

Valuable external review was provided by Hanspeter Höschle (VITO), Luiz Barroso (PSR) and Hélène Lavray (Eurelectric), along
with Carlos Fernández, Martina Lyons and Paul Komor (IRENA).

Disclaimer
This publication and the material herein are provided “as is”. All reasonable precautions have been taken by IRENA to verify the
reliability of the material in this publication. However, neither IRENA nor any of its officials, agents, data or other third-party
content providers provides a warranty of any kind, either expressed or implied, and they accept no responsibility or liability for
any consequence of use of the publication or material herein.

The information contained herein does not necessarily represent the views of all Members of IRENA. The mention of specific
companies or certain projects or products does not imply that they are endorsed or recommended by IRENA in preference to
others of a similar nature that are not mentioned. The designations employed and the presentation of material herein do not imply
the expression of any opinion on the part of IRENA concerning the legal status of any region, country, territory, city or area or of
its authorities, or concerning the delimitation of frontiers or boundaries.

Photographs are from Shutterstock unless otherwise indicated.

  This document does not represent the official position of IRENA on any particular topic. Rather, it is intended as a contribution
  to technical discussions on the promotion of renewable energy.
www.irena.org

  1 HOW IT WORKS                                          2 BENEFITS
  Regional markets require the harmonisation                 Increased flexibility through expanding
  of market rules for electricity to flow freely             balancing area
  in response to market-based price signals.                 Advantages of spatial complementarity
  The deeper the integration, the more rules needs           of VRE generation
  to be harmonised. There are different stages
  of market integration:                                     Co-ordinate generation planning

   Early stage of                                            Reduce system operation cost
                          Bilateral contracts
   market integration

        Shallow market        + Harmonisation of
        integration           wholesale market rules

                                  + Harmonisation
            Deep market           of ancillary service
            integration           markets, and possibly
                                  capacity markets

  4 SNAPSHOT                                              3 KEY ENABLING FACTORS
  ➜   The Western Energy Imbalance Market (EIM) in           Physical interconnections with sufficient
      US helped to avoid curtailment of                      capacity
      760 TWh of RE and provide more than                    Regional mindset, strong institutional
      USD 565 million since its inception in 2014.           arrangements and governance model

                                                             Robust IT system for market operation

                         REGIONAL MARKETS
      Coupling markets creates a larger balancing area with wider resource diversity.
                  This facilitates the integration of variable renewables.
I N N OVAT I O N L A N DS C A P E B R I E F
ABOUT THIS BRIEF
T his brief forms part of the IRENA project
“Innovation landscape for a renewable-powered
future”, which maps the relevant innovations,
to create actual flexibility solutions for power
systems. Solutions to drive the uptake of solar
and wind power span four broad dimensions
identifies the synergies and formulates solutions of innovation: enabling technologies, business
for integrating high shares of variable renewable models, market design and system operation.
energy (VRE) into power systems.
Along with the synthesis report, the project
The synthesis report, Innovation landscape for a includes a series of innovation landscape briefs,
renewable-powered future: Solutions to integrate each covering one of 30 key innovations identified
variable renewables (IRENA, 2019), illustrates the across those four dimensions. The 30 innovations
need for synergies between different innovations are listed in the figure below.
INNOVATION DIMENSIONS
ENABLING TECHNOLOGIES BUSINESS MODELS MARKET DESIGN SYSTEM OPERATION
1 Utility scale batteries 12 Aggregators 17 Increasing time 25 Future role of distribution
2 Behind-the-meter 13 Peer-to-peer electricity granularity in electricity system operators
batteries trading markets 26 Co-operation between
14 Energy-as-a-service 18 Increasing space transmission and
3 Electric-vehicle
granularity in electricity distribution system
smart charging 15 Community-ownership
markets operators
4 Renewable models
19 Innovative ancillary
power-to-heat 16 Pay-as-you-go models
services
27 Advanced forecasting
5 Renewable 20 Re-designing capacity
of variable renewable
power-to-hydrogen power generation
markets
21 Regional markets 28 Innovative operation
6 Internet of Things
of pumped hydropower
7 Artificial intelligence
22 storage
and big data 23 Market integration
8 Blockchain of distributed energy 29 Virtual power lines
resources 30 Dynamic line rating
9 Renewable mini-grids
10 Supergrids 24 Net billing schemes
11 Flexibility in conventional
power plants
4R EG I O N A L M A R K E TS
This innovation landscape brief applies to
liberalised, open electricity markets, where the The brief is structured as follows:
vertical integrated utilities are unbundled and
there is competition in electricity generation. I Description
It provides an overview of regional markets, a
market design innovation, that allows electricity II Contribution to power sector transformation
to be transported more easily within a larger
balancing market area across several control III Key factors to enable deployment
areas. In this way, a wider geographic diversity
of resources can be used to balance supply and IV Current status and examples of leading
demand by taking full advantage of weather initiatives
and resource diversity and differences in load
patterns. V Implementation requirements: Checklist
5I N N OVAT I O N L A N DS C A P E B R I E F
I. DESCRIPTION
A regional market is the outcome of
establishing a higher hierarchical level of
organisation of several national, sub-national or
enhance competition in power generation and
supply, and offer more choices for consumers.
Regional markets are gaining more importance,
local systems, so that their original spontaneous as these bring additional benefits to the grid
interactions become stronger and subject to integration of VRE. A well-integrated regional
well-defined, commonly agreed rules (Perez- market can create locational and temporal 1
Arriaga, 2013). In addition to the liberalisation synergies between renewable energy sources
of markets in the broader sense, the last two and demand patterns across the entire region.
decades have witnessed a trend towards the Regional markets can also facilitate the
creation of regional electricity markets via the investment planning in generation assets by
integration of existent national markets. Some exploring the existing advantages of different
of the examples include the European Union’s geographical locations, provided appropriate
(EU’s) Internal Electricity Market (IEM), the co-ordination rules and regulatory frameworks
Central American Electricity Market (Mercado are in place.
Regional de Electricidad, or MER), the Western
Energy Imbalance Market (EIM) in the United The creation of a regional electricity market
States, the Australian National Electricity Market requires the harmonisation of market rules so
(NEM), the market in the Mekong Delta region in electricity can flow freely in response to market-
Viet Nam, the West African Power Pool (WAPP) based price signals. There are different levels
and the South African Power Pool (SAPP). of regional market integration, as described in
Table 1. Deepening the level of market integration
The establishment of regional markets started requires the harmonisation of different market
long before the takeoff of VRE. Their role has rules. Figure 1 depicts the relationship between
been to enhance the security of supply and increased market integration levels and the
reduce costs as liberalised and integrated corresponding harmonisation needed for various
markets allow relatively free cross-border flows, market design features.
1 When participating electricity markets are not in the same time zone.
6R EG I O N A L M A R K E TS
Table 1 Different levels of regional market integration
Market Interconnectivity Trading Harmonisation
integration level level arrangements rules
Early stage of market Physical interconnection Long-term, bilateral, over- Simple rules agreed for
integration between two countries the-counter (OTC) ³ power the operation of the
purchase agreements interconnected system
(PPAs)
Shallow market Physical interconnection Long-term PPAs Harmonisation of market
integration between several supplemented with short- rules, grid codes, and
neighbouring countries term wholesale markets transmission tariffs
Deep market integration Full synchronous operation Well-functioning markets Regional regulatory
of a multi-country with competition achieved agencies, regional
interconnected system through trading in different market operators and
timeframes and various harmonisation of market
markets (OTC vs. power rules, grid codes, and
exchanges, capacity vs. transmission tariffs
power markets, day-ahead
vs. intraday markets, etc.)
Source: Adapted from ESMAP (2010)
Figure 1: Market integration levels depending on the regional market design
Capacity market
harmonisation
Internal Electricity
Market in EU
Western Energy
Imbalance Market
Ancillary market in US
harmonisation
Central America
Power Market
South African
Power Pool
Wholesale market
harmonisation
Eastern African Power Pool
Bilateral contracts Greater Mekong Sub-region
Nile basin initiative
West Africa Power Pool
Early stage of market Shallow market Deep market
integration integration integration
2 OTC trading refers to bilateral contracts signed outside an organised market place (i.e., power exchange).
7I N N OVAT I O N L A N DS C A P E B R I E F
II. C
ONTRIBUTION TO POWER
SECTOR TRANSFORMATION
In general, each jurisdiction lays down its own
required standards for power quality and
subsequently on the required quantity of reserve,
power systems to agree on various regulatory
aspects, including time and space granularity,
cost sharing and recovery, a strategic road map,
as well as institutional and policy frameworks. and contractual details such as the co-operation
A truly integrated regional market implies between system and market operators, etc.
harmonised rules across different markets, (ENTSO-E, 2018a).
as well as different trading time frames. For
example, in the ideal case, a well-functioning and Harmonising rules among different markets
deeply integrated regional market would have improves flexibility in the power systems
harmonised rules across the entire region for the involved by increasing the trading opportunities
wholesale electricity market, ancillary service for market participants, increasing the balancing
market and the capacity market. area, reducing the balancing costs, taking
advantage of complementarities between
Similarly, in the wholesale electricity market different renewable energy sources and helping
as well as the ancillary service market, all time to plan the best-suited generation capacity
frames (long term and short term) would have the investment across multiple power systems.
same regulatory framework. A well-functioning Figure 2 shows the key benefits of deeply
regional market would require participating integrated regional markets.
Figure 2: Benefits of deeply integrated regional markets
Harmonised rules
Electricity wholesale markets Ancillary service markets Capacity markets
Benefits
Increased flexibility by
Advantages of spatial
expanding the balancing area Co-ordinated generation
complementarity of VRE
and operating a large capacity planning
generation across borders
synchronous area
High share of grid-integrated VRE and reduced cost of system operation
8R EG I O N A L M A R K E TS
Advantages of the spatial Regional markets enable synergies in spatial
complementarity of VRE generation complementarities of VRE sources. For instance,
across borders when the wind does not blow in France, the
sun might be shining in Spain. The possibility of
Harmonised rules in the wholesale electricity importing electricity from Spain in such cases could
markets, such as harmonised gate opening reduce the need for local flexibility or balancing
and closure times and market time units reserves in France. Better integration of markets
(scheduling intervals) of the day-ahead and allows power systems to take advantage of clean
intraday markets, allow all market participants electricity sources beyond the borders of the
in the region to submit their bids and offers system, allowing for the co-ordination between
within the same trading intervals, therefore different renewable energy resources. (Newbery,
increasing their trading opportunities. Pollitt and Ritz, 2017).
Considering the available transmission network
capacity, supply and demand orders are Complementarity patterns have been observed
matched more efficiently from an economic between wind and solar at both daily and seasonal
point of view within a wider regional market scales. Figure 3 shows the expected daily profile of
with different demand patterns, especially demand, wind and solar PV generation in Uruguay.
when the participating regions are in different It highlights the complementarity between wind
time zones. This allows greater integration of generation, which decreases during daytime hours,
wind and solar PV generation, as it reduces the and solar generation, which increases during the
VRE curtailments that are more likely to occur same hours (IRENA, 2016). In regional markets,
in smaller systems. such complementarity can be even stronger
because abundant solar resources are usually
distant from abundant wind resources.
Figure 3: Daily complementarity between renewable energy sources in Uruguay
1 600
Demand
1 400
1 200
1 000
MW
800
1600 Wind
400
Solar
200
0
0 1 3 5 7 9 11 13 15 17 19 21 23
Source: Chaer et al. (2014) and IRENA (2016)
9I N N OVAT I O N L A N DS C A P E B R I E F
Central American countries have expanded their Increased flexibility by expanding the
transmission systems to facilitate the incorporation balancing area and operating a large
of large amounts of renewable energy. They have synchronous area
jointly developed a regional transmission line, the
Central American Electrical Interconnection System System balancing refers to actions taken by the
(SIEPAC), to enable international power exchanges transmission system operators (TSOs) to ensure
(ECA, 2010). The SIEPAC was completed at the that system frequency is maintained within a pre-
end of 2013 and allows for the trade of electricity defined range (Emissions-EUETS, 2009). Supply
among Costa Rica, El Salvador, Guatemala, and/or demand may vary due to unexpected
Honduras, Nicaragua and Panama. This facilitates events (e.g., an increase/decrease in power supply
the incorporation of large amounts of renewable from conventional generators, VRE, weather-
energy by capitalising on different VRE resources determined high-power demand, etc.), causing
and demand profiles in different countries. The imbalances in the system. In this context, ancillary
region’s dependence on hydropower has led to services are defined as services necessary for
concerns about energy security, especially given the operation of a system (ENTSO-E, n.d.) and
recent extreme droughts that resulted in electricity can be clustered into frequency ancillary services
shortages. The creation of SIEPAC, along with a (balancing), and non-frequency ancillary services
higher penetration of renewable power, helped (voltage control and black-start capability).
Central American countries to cope with droughts
without any rationing of electricity 3 (Lippmann and Trading ancillary services with neighbouring TSOs
DiPippo, 2017; IRENA, 2016). SIEPAC also resulted within a regional market is key to increasing the
in the establishment of a regional electricity overall flexibility of the transmission system and
market, a regional system operator and a regional reducing balancing costs. Large power grids can
regulator. absorb more fluctuations in power demand and
generation compared to smaller grids, leading
Regional markets can help reduce the overall to more flexibility in the system (Pariente-David,
operation costs of power generation because they 2014). Regional markets result in a larger underlying
allow for the more efficient use of existing assets power grid, which thereby helps to reduce the
across countries, dispatching the most efficient reserve requirements. The development of regional
generators in the region. Generators operate in markets allows electricity to be transported more
a more stable point that is closer to their most easily within a larger balancing area, meaning that
efficient operation point, which leads to further more resources are available to be used to balance
reductions in operation costs. Such resource power supply and demand. Harmonising products
sharing and diversification of resources in regional and rules in the ancillary service market across
markets lower the risk associated with a shortage different countries allows access to a broad range
of any given fuel, ensure the regional supply of services from an expanded balancing area,
at a lower cost, and in some cases, even avoid giving system operators more flexibility, which
expensive shortages. allows them to ensure the security of supply at a
lower cost.
3 Central America is heavily dependent on hydropower and fossil fuel for power generation (Lippmann and DiPippo, 2017).
10R EG I O N A L M A R K E TS
A regional balancing reserve market in deeply Moreover, ENTSO-E is working on the
integrated regions can help reduce the overall implementation of an integrated market for
power reserve requirements, as reserves are shared balancing services in Europe, which is expected
across the whole region. Several stakeholders in to ensure the security of the power supply
the EU, including the Agency for the Cooperation while reducing the need for back-up generation
of Energy Regulators (ACER), national regulatory (ENTSO-E, n.d.). ENTSO-E conducted a pilot to
authorities, and TSOs within the European Network establish a common market for the procurement
of Transmission System Operators for Electricity of frequency containment reserves (FCRs)
(ENTSO-E), developed a guideline on electricity based on the TSO-TSO model 4 in the following
balancing that entered into force in November seven countries and involving the respective
2017 (Commission Regulation, 2017). The European TSOs: Austria (APG), Belgium (Elia), Western
guideline on electricity balancing sets down Denmark (Energinet), France (RTE), Germany
the rules on the operation of balancing markets (50Hertz, Amprion, TenneT DE, TransnetBW),
throughout the EU, referring to those markets that the Netherlands (TenneT NL), and Switzerland
TSOs use to procure balancing services to keep (Swissgrid). The pilot showed that with
the system balanced in real time. On top of that, geographical extension, between 2014 and 2017,
the regulation provides opportunities for cross- balancing capacity prices steadily decreased
border trading within such balancing markets. As and converged across the markets involved in
such, this framework enables greater cross-border the FCR co-operation project, as illustrated in
availability of resources for balancing the system Figure 4.
and in turn lower costs for procuring these services.
Figure 4: Average prices of balancing capacity (from FCRs) in the markets involved in the FCR co-operation
project
80
70
60
euros/MW/h
50
40
30
20
10
0
2014 2015 2018 2017
Austria Belgium Switzerland Germany France The Netherlands
Source: ACER (2018)
4 The TSO-TSO model refers to a model for the exchange of balancing services exclusively operated by TSOs, as opposed to a TSO-balancing responsible
party (BSP) model, in which a BSP has a contractual relationship with another TSO other than the TSO to which the BSP is connected.
11I N N OVAT I O N L A N DS C A P E B R I E F
Co-ordinated generation capacity Co-ordinated capacity planning among countries
planning helps to lower capital investments to meet future
demand. For instance, in the SAPP 2025 plan, 57
In the absence of well-functioning wholesale gigawatts (GW) of capacity was expected to be
electricity markets or where a generation added at a cost of USD 89 billion (US dollar), which
adequacy issue has been identified across a was USD 48 billion less than the total of the national
region, regional capacity markets can play an power development plans to meet the same level of
important role in co ordinating the investment demand (ESMAP, 2010). On the contrary, if capacity
plans for generation capacity. The harmonisation markets are introduced at the national level in an
of rules in capacity markets across a region unco-ordinated manner across a deeply integrated
sends a clear price signal regarding the region with a well-functioning wholesale market,
investment needs for capacity generation at capacity markets could have a negative impact on
a regional level, rather than sending several the regional electricity-only market.
price signals at national or sub-national levels.
Co ordinated planning across an entire region Regional markets can also help improve the
has several benefits, including the efficient financial feasibility of large power generators,
use of renewable energy resources from areas which may otherwise not be doable. For instance,
where these are abundant, as well as the the Grand Inga project (a 20 000 MW hydro
capitalisation on the spatial complementarity power project in the Democratic Republic of
of such resources. Capacity-expansion models Congo), which is one of the largest clean energy
can take into account the regional integration power generation projects in the SAPP, will only
of the system, the stochastic nature of the be economically viable under the inter-country
VRE and the ability of the system to address transmission capacity (IRENA, 2017). The same
intermittency with minimal back-up reserves applies to large onshore and offshore wind
(Pariente-David, 2014). projects, which may only be economically feasible
if they serve the demand of a larger system.
12R EG I O N A L M A R K E TS
Potential impact on power sector transformation
Regional markets bring several advantages, to an outage in one of the interconnectors
including better economic utilisation of the (Danish Energy Agency, 2015). The excess
interconnections between countries and wider wind power is traded with neighbouring
welfare benefits for end-customers. Efficient countries, for example by using it to charge
utilisation of the existent interconnection pumped hydro storage facilities (IEEFA, 2018).
infrastructure helps reduce the short-term
costs of integrating VRE into the power grid • The Western Energy Imbalance Market (EIM)
(Newbery, Pollitt and Ritz, 2017). Examples has helped to avoid curtailment of almost
with potential positive impacts on power sector 720 TWh of renewable energy since its
transformation, including enhanced security of inception, thereby avoiding the emission of
supply, reduced system costs and efficient use 306 112 equivalent tonnes of carbon dioxide
of resources, are provided below: (CO₂) (CAISO, 2018). The EIM has provided
USD 400 million in gross benefits to market
• Across Europe, the successful exchange of participants since its launch in November
balancing services resulted in the utilisation 2014 (Larson, 2018).
of imbalance netting ⁵ across borders, which
covers more than half of the need for balancing • The World Bank has estimated that the
energy in several European markets, including economic benefits of regional trade in the
Austria, Germany, Latvia, Germany and the Western African Power Pool (WAPP) would
Netherlands. In these countries, imbalance reach USD 5–8 billion per year due to
netting helped to avoid 83 %, 60 %, 55 %, and reduced operation costs while making power
51 %, respectively, of the system’s balancing generation more sustainable by displacing
energy needs in 2017. Overall, the potential baseload oil-fired power generation with
welfare benefits from efficient imbalance cleaner sources of electricity such as natural
netting and the exchange of balancing energy gas, solar and hydropower (The World
across European borders is estimated to be Bank, 2018).
EUR 1.3 billion per year. In this context, the
effective implementation of the harmonised • Exports of power to the United Kingdom from
rules set out in the Commission Regulation Ireland (via sub-sea interconnection) helped
(EU) 2017/2195 establishing a guideline on reduce power curtailment by approximately
electricity balancing would materialise these 50 % in 2013 (IEEFA, 2018). By 2017, Ireland’s
welfare gains (ACER, 2018), (Commission cross-border interconnections reached 7 % of
Regulation, 2017). total installed generation, compared to the
EU target of 10 % by 2020 (although Ireland
• Significant interconnection ⁶ with neighbouring is expected to increase the interconnection to
countries (Germany, Norway and Sweden) 18 % by 2020) (European Commission, 2017).
allowed Denmark to integrate around 53 % of
wind power without significant curtailments • The economic benefits of fully integrating
in 2017 (IEEFA, 2018). Over the years, wind the European market could be as high as
power generation has been curtailed only EUR 40 billion per year by 2030 in a high
twice: for six to eight hours in 2008 and 2010, renewable energy scenario (Newbery, Pollitt
curtailing 200–300 megawatts (MW), due and Ritz, 2017).
56
5 Imbalance netting refers to the process agreed among TSOs of two or more load-frequent control areas which avoids the simultaneous activation of
frequency restoration reserves in opposite directions.
6 Denmark has cross-border connection equivalent to 51 % of its total power generation capacity with target to increase the interconnection capacity to 59 %
by 2022 (European Commission, 2017).
13I N N OVAT I O N L A N DS C A P E B R I E F
III. KEY FACTORS TO ENABLE
DEPLOYMENT
Physical interconnections with sufficient Regional mindset, strong institutional
capacity made available to the market arrangements and governance model
The underlying requirement for functioning Perhaps the most challenging issue in the design
regional markets (regardless of the market and implementation of a regional market is
integration level) is the availability of sufficient the shift from a “national/system mind-set” of
transmission capacity among the participating institutions and consumers towards a “regional
countries. As mentioned, Denmark has low mind-set” with the prime objective of maximising
curtailment levels of VRE thanks to the the social welfare of the entire region while
interconnector capacity with neighbouring ensuring that each system participating in the
countries, which is nearly equal to the peak load regional market is better off within the regional
of 6.5 GW. The EU target is for cross-border market integration. Successful regional integration
interconnections to reach 10 % of total installed requires political buy-in along with strong
generation by 2020 (European Commission, institutional arrangements and a governance
2017). In its Ten Year Network Development Plan, model to address any future issues that may lead
ENTSO-E is proposing investments in transmission to distrust among participating entities.
projects worth EUR 114 billion by 2030 that would
result in annual savings of up to EUR 5 billion in For instance, important savings are to be made
generation costs (ENTSO-E, 2018b). when the security of supply is considered at
the regional level rather than at the individual
In addition to the construction of new country level. This requires a high level of trust
interconnections, another aspect that enables the among countries that, in case of supply scarcity,
integration of regional markets is a sufficient level neighbouring countries will share generation
of transmission capacity made available to the capacity according to established rules rather
market by the TSOs. For example, in the European than giving priority to a single country’s local
wholesale markets, in 2017, the cross-zonal demand. This represents a major challenge if
capacity made available for trading remained every country installs local generation capacity
significantly below an estimated “benchmark to meet its demand without benefiting from the
capacity”, i.e., the maximum capacity that could wider regional generation capacity, therefore
be made available to the market while preserving reducing the potential welfare benefits derived
operational security. from regional integration (Perez-Arriaga, 2013).
14R EG I O N A L M A R K E TS
Regional planning of resources helps optimise Robust information technology for
capital investments in the generation and market and transmission system
transmission network. Along with a strong operation
governance model, formal endorsement from
heads of participating countries or regions may Regional market operators are expected to
increase trust and help with future investments, handle orders from all participating countries,
as has been done in WAPP (ESMAP, 2010). which need to be processed in a transparent
Participating countries need to strictly adhere to manner and for which a robust information-
the regional framework to reap the benefits of technology (IT) system is essential. For example,
the integrated regional market. the cross-border intraday (XBID) project in
Europe has created an integrated platform
For the successful implementation of a well- based on the shared order book (SOB) concept
functioning regional market and to create of trading modules, the Capacity Management
trust, the regulator is required to oversee and Module (CMM) and the Shipping Module (SM).
sanction activities of market participants that The platform allows multiple exchanges across
would violate the set of rules agreed regionally. participating regions to trade power continuously
The regulator would need to take proactive on a centralised platform (Nord Pool, 2018).
measures to prevent predatory pricing and
other forms of unruly market conduct. Cross- With the increasing penetration of VRE,
border agreements among institutions (dealing increasing the granularity of power markets
with power sector-related issues on the national in terms of time and space can help integrate
and regional levels) are essential for sustainable more VRE into the grid. As the granularity
regional market operations (Oseni and Pollitt, increases, the operation of power markets
2016). Some form of regulatory oversight has becomes increasingly complex, especially within
made Nord Pool and MER successful power a wider regional market. Similarly, the number
pools (Oseni and Pollitt, 2016). of bid and ask orders, as well as the number
of transactions (contracts) is also expected to
For deeply integrated markets, an appropriate increase significantly once the power markets
institutional arrangement is necessary to merge at a regional level. Calculation of the
facilitate the co-operation and co-ordination available cross-zonal capacity requires an
required to align national regulatory frameworks. extensive alignment, and the calculation process
This institution must work in close co-ordination involves more parties compared to the process
with relevant national-level entities and with within one single market area (Nord Pool, 2018).
electricity regulators and TSOs. The European Hence, market and system operators should
regional market offers a good example: the have state-of-the-art IT systems that can provide
Agency for the Cooperation of Energy Regulators higher computational power at a low cost.
(ACER) defines the guidelines for transnational
electricity networks and markets, while national As the market becomes more complex and
regulators set the rules for system operations automated, market operators need to ensure a
in electricity markets within their jurisdictions. clear and transparent methodology to price the
ENTSO-E, the European TSO representative power at different times and across different
body, further develops the frameworks, i.e., the locations. Clear and transparent methodologies
grid codes, ensuring overall alignment, which also help create confidence among market
are then approved and implemented by the participants, especially those with long-term
TSOs. Similarly, in the Central American Power investments across the value chain (e.g., in
Market, the CRIE (the Regional Commission for generation assets).
Electricity Interconnection) is the regulatory
body for the regional market. The CRIE’s
board of commissioners is composed of one
commissioner from each of the six countries.
15I N N OVAT I O N L A N DS C A P E B R I E F
IV. C
URRENT STATUS AND
EXAMPLES OF LEADING
INITIATIVES
Some of the key indicators of selected regional electricity markets have been captured in the Table 2.
Table 2 Leading initiatives of regional markets and key indicators
Regional Participating Year of
market countries/systems establishment
Central America 6 countries: 2013
Power Market¹ Costa Rica, El Salvador, Guatemala, Honduras, Nicaragua and Panama
European Union² 23 countries (day-ahead market): 1990s (NordPool
Austria, Belgium, the Czech Republic, Germany, Denmark, Estonia, Finland, France, was created)
Great Britain, Hungary, Italy, Lithuania, Latvia, Luxembourg, the Netherlands,
Norway, Poland, Portugal, Romania, Spain, Slovenia, Slovakia and Sweden
14 countries (intraday market): 2018
Austria, Belgium, Denmark, Estonia, Finland, France, Germany, Latvia, Lithuania, (XBID Project –
Norway, the Netherlands, Portugal, Spain and Sweden intraday market)
Eastern Africa 10 countries: 2005
Power Pool³ Burundi, the Democratic Republic of Congo (DRC), Egypt, Ethiopia, Kenya,
Rwanda, Tanzania, Libya, Uganda and Sudan
Greater Mekong 6 countries: 1995
Sub-region⁴ Kingdom of Cambodia, Guangxi Zhuang Autonomous Region and Yunnan
Province of the People’s, Republic of China (PRC), Lao People’s Democratic
Republic (Lao PDR), Union of Myanmar, Kingdom of Thailand and the Socialist
Republic of Viet Nam
South African 12 countries: 1995
Power Pool (SAPP)⁵ Angola, Democratic Republic of Congo (DRC), Tanzania, Malawi, Zambia,
Zimbabwe, Mozambique, Swaziland, South Africa, Lesotho, Namibia, Botswana
Western Energy 8 active members: 2014
Imbalance Market Idaho Power Company, Powerex, Portland General Electric, Puget Sound
(EIM), United States⁷ Energy, Arizona Public Service, NV Energy, PacifiCorp, CAISO and Balancing
Authority of Northern California/SMUD
Sources:
1. Navarrete (2016) 4. Asian Development Bank (2016)
2. ENTSO-E (2018c) 5. SAPP (2016)
3. The Eastern Africa Power Pool (2016); Olingo (2018) 6. Westerneim (2019)
16R EG I O N A L M A R K E TS
Total % penetration Level of
Impact on VRE grid integration
capacity of VRE integration
16.5 GW From 3 % in to Increased the power generation from renewables, displacing generation Shallow market
(2016) 8.7 % in 2016 from fossil fuel based plants integration
995 GW 14.7 % Significant interconnection between Germany, Sweden and Norway allows Deep market
(2017) (2017) Denmark to integrate ~49 % of wind power without significant curtailments integration
Spatial complementarities between VRE in different countries and larger
balancing area
60.7 GW n.a. The Kenya and Ethiopia electricity transmission interconnector is expected Early stage
(2015) to be completed by mid-2019, concluding the first phase of the region's of market
power pool project integration
118.9 GW 3% New interconnections expected to improve gird integration of renewables: Early stage
(2012) •A
North West pole connecting the PRC, Myanmar, and Thailand to of market
replace coal and gas-fired power generation in the PRC and Thailand by integration
hydro power from Myanmar (about 26 000 MW)
•A
n East West pole to connect Thailand, northern Lao PDR, and northern
Viet Nam to substitute Lao hydro for thermal generation (about 4 500 MW)
•A
Southern pole to connect southern Lao PDR to central Viet Nam, and
to a lesser extent, Cambodia and southern Viet Nam to strengthen supply
in these regions and to displace coal and possibly some gas-fired plants
62 GW n.a A large hydro power project in the Democratic Republic of Congo Shallow
(Grand Inga project: 20 000 MW) is economically viable only with market
interconnections (Lippmann and DiPippo, 2017)(IRENA, 2016) integration
The EIM has avoided curtailment of 757 862 GWh since its inception Deep market
(2014–2018), avoiding 324 284 eq. tonnes of CO₂ and has netted USD integration
564.88 million in gross benefits (2014–2018) for market participants
17I N N OVAT I O N L A N DS C A P E B R I E F
Internal day-ahead market for electricity The day-ahead market timeframe foresees a
in the EU single day-ahead market coupling that enables
cross-zonal transmission capacity to be used
In the EU, regional market integration is already efficiently from an economic point of view. In 2018,
well advanced in several aspects and further day-ahead market coupling was implemented
pan-European harmonisation of rules is ongoing on 30 out of 42 EU borders (excluding the four
(ACER, 2018). Significant progress has been borders with Switzerland), covering 23 European
made especially towards the implementation countries: Austria, Belgium, the Czech Republic,
of single day-ahead coupling (SDAC) via the Denmark, Estonia, Finland, France, Germany,
Commission Regulation (EU) 2015/1222 of 24 Great Britain, Hungary, Italy, Latvia, Lithuania,
July 2015 establishing a guideline on capacity Luxembourg, the Netherlands, Norway, Poland,
allocation and congestion management (CACM), Portugal, Romania, Slovakia, Slovenia, Spain and
which sets the rules for co-ordinated European Sweden. The gradual integration of the European
day-ahead and intraday markets (Commission day-ahead market coupling is depicted in the
Regulation, 2015). figure below.
Figure 5: Gradual integration of the European regional wholesale market (day-ahead timeframe)
1990s – NORD POOL 2006 2011
FEBRUARY 2014 MAY 2014 FEBRUARY 2015
Source: ENTSO-E (n.d.)
Disclaimer: Boundaries shown on these maps do not imply any official endorsement or acceptance by IRENA.
18R EG I O N A L M A R K E TS
Internal intraday market for electricity Internal balancing market for electricity
in the EU in the EU
An important step towards further integration of Commission Regulation (EU) 2017/2195 of 23
European wholesale markets across Europe was November 2017 establishing a guideline on
taken on 12 June 2018 with the go-live of the XBID electricity balancing will play a crucial role in
project establishing a single intraday coupling the further integration of the internal energy
(SIDC), which is one of the key elements of market market across Europe (Commission Regulation,
design envisaged in the CACM Regulation. TSOs 2017). ENTSO-E conducted various cross-border
of 11 countries and 4 power exchanges (EPEX electricity balancing pilot projects with the purpose
SPOT, GME, Nord Pool and OMIE) jointly started of testing the feasibility of the European target
the XBID project, initially covering 14 countries. 7 model (i.e., envisaged design for balancing markets),
A second go-live with further countries is its intermediate steps, as well as evaluating the
foreseen in 2019, the objective being to extend associated implementation impact and with the
the mechanism for XBID trading to all Europe purpose to report on the experience gained.
and, potentially, interconnected countries.
For example, the Frequency Containment
The project is expected to increase liquidity Reserves (FCR) Cooperation is a common market
in the intraday markets, as bid and ask orders for the procurement and exchange of balancing
that were not met in local markets can now be capacity, which involves ten TSOs in seven
matched within the larger integrated regional countries: Austria (APG), Belgium (Elia), Germany
market. This project is also expected to increase (50Hertz, Amprion, TenneT DE, TransnetBW),
market efficiency since the cross-border Western Denmark (Energinet), France (RTE),
transmission capacity allocation and energy the Netherlands (TenneT NL) and Switzerland
matching process is being carried out (implicitly) (Swissgrid). As a result of this project, where FCR
at same time. The increased market liquidity and are procured through a common merit order list,
efficiency is expected to facilitate the integration FCR capacity prices have been steadily decreasing
of renewable energy into the energy market and and converging across the participating countries.
therefore a better absorption of this energy into
the grid. As it becomes challenging for market The Trans European Replacement Reserves
participants to be in balance after the closing Exchange (TERRE) is the project selected by
of the day-ahead market, trading interest in the ENTSO-E to become the European platform
intraday market is increasing. Being balanced for the exchange of balancing energy from
on the network closer to physical delivery Replacement Reserves pursuant to the guideline
time is beneficial both for market participants on electricity balancing, in which nine TSOs
and for the power systems, among others by participate: France (RTE), Great Britain (National
reducing the need of balancing reserves and the Grid), Italy (Terna), Portugal (REN), Spain (RED),
associated costs (NordPool, 2018). Switzerland (SwissGrid), Czech Republic (ČEPS),
Poland (PSE) and Romania (Transelectrica).
Other initiatives in Europe aim to net imbalances
or exchange balancing energy across TSOs’
scheduling areas, such as the project to exchange
energy from aFRR (automatically activated
frequency restoration reserves) between Austria
and Germany. As a result, the overall cross-
zonal exchange of balancing energy (including
imbalance netting) almost doubled between 2015
and 2017 (ACER, 2018).
7 Austria, Belgium, Denmark, Estonia, Finland, France, Germany, Latvia, Lithuania, Norway, the Netherlands, Portugal, Spain and Sweden.
19I N N OVAT I O N L A N DS C A P E B R I E F
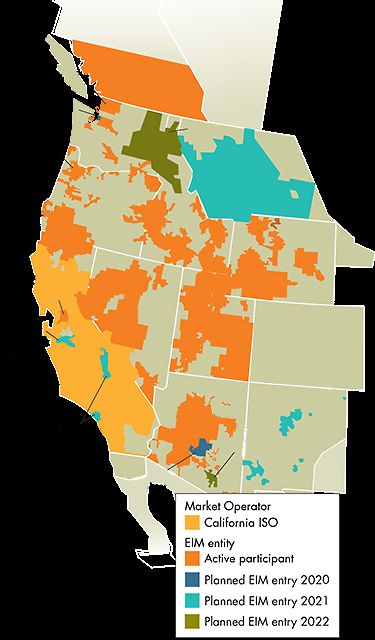
Western Energy Imbalance Market Currently, there are nine active members 8 of this
(EIM), United States EIM with other five members 9 to join by 2021
(Westerneim, 2019). The Western EIM aimed
In November 2014, the California independent to balance the power demand for every five
system operator (CAISO) and PacifiCorp minutes with the lowest cost energy available
launched the Western Energy Imbalance Market across the combined grid. The EIM leverages the
(EIM) (PacifiCorp, 2019). The EIM is a “real time” flexible backup resources and demand across the
market involving eight western states that trades combined grid. Apart from reducing the cost of
the difference between the day-ahead forecast of power, 10 the Western EIM also improves the grid
power and the actual amount of energy needed integration of renewable energy (Westerneim,
to meet demand in each hour. 2019).
Western EIM also manages congestion on
Figure 6: Western EIM active and pending transmission lines to maintain grid reliability and
participants makes excess renewable energy available at a low
cost to participating utilities rather than forcing
generating assets offline. The EIM has helped
to avoid curtailment of almost 760 TWh since
its inception (2014–2018), avoiding 324 284 eq.
Puget Sound Powerex tonnes of CO₂ emission (CAISO, 2019) as Table 3
Energy
Seatle
details.
City Light
Avista
Portland CAISO’s Western EIM showed benefits to the
General eight market participants of more than USD 62
Electric North Western million during the fourth quarter of 2018. That
Energy
brought the total gross benefits attributable to
PacifiCorp Idoho the real-time western energy market to nearly
Power USD 565 million since it began operation in 2014
(CAISO, 2019).
BANC/ PacifiCorp
SMUD NV
Energy
Turlock
Irrigation
District
Public Service
Company of
Arizona Public New Mexico
Los Angeles Service Tucson
Dept. of Electric
Water & Power
Power Salt River
Project
Market Operator
California ISO
EIM entity
Active participant
Planned EIM entry 2020
Planned EIM entry 2021
Planned EIM entry 2022
Source: Westerneim (2019)
Disclaimer: Boundaries and names shown on this map do not imply any official endorsement or acceptance by IRENA.
8 Idaho Power Company, Powerex, Portland General Electric, Puget Sound Energy, Arizona Public Service, NV Energy, PacifiCorp, CAISO and Balancing
Authority of Northern California/SMUD.
9 Los Angeles Department of Power & Water, Salt River Project, Seattle City Light, Public Service Company of New Mexico, and NorthWestern Energy.
10 Western EIM has helped save USD 401 million since its inception in the second quarter of 2018 in power costs (CAISO, 2018).
20R EG I O N A L M A R K E TS
Table 3 Maximising green energy, minimising greenhouse gases
Year Curtailment avoided CO2 emissions avoided
(MWh) (metric tonnes)
2015 31 082 13 220
2016 328 238 140 486
2017 161 097 68 951
2018 237 445 101 627
Total 757 862 324 284
Note: CAISO calculates CO₂ emissions reductions attributable to the EIM from avoided renewable energy curtailments
based on a default emission rate of 0.428 metric tonnes CO₂/MWh.
Source: CAISO (2019)
Through increased co-ordination and of this energy to meet demand across the EIM
optimisation, utilities like Western EMI can realise footprint is likely replacing less clean energy
cost benefits and reduce carbon emissions. sources. The quantified benefits from avoided
Sharing resources across a larger geographic curtailments of renewable generation from
area, even if it is only in real-time, continues to 2015 to date reached 324 284 metric tonnes
have the positive effect of reducing greenhouse of CO₂, roughly the equivalent of avoiding the
gas emissions by using renewable generation emissions from 68 179 passenger cars driven for
that otherwise would have been turned off. Use one year.
21I N N OVAT I O N L A N DS C A P E B R I E F
V. IMPLEMENTATION
REQUIREMENTS: CHECKLIST
TECHNICAL Hardware:
REQUIREMENTS • Physical interconnection capacity among countries/systems in the region
• Sufficient capacity made available by system operators to the market
Software:
• Robust IT system and higher computational power required to process bids from
market participants across the entire region
• Automation of various processes and information exchange related to scheduling
of power plants
REGULATORY Wholesale market and system operation:
REQUIREMENTS • Strong institutional arrangements and a regulatory framework for cross-border
co-ordination among various stakeholders (TSOs, market operators, regulators, etc.)
• Co-ordination of scheduling and dispatch across different trading timeframes
• Regional grid code to achieve co-ordinated operations and investment planning
• For deeply integrated markets, a harmonised market design
(e.g., same gate opening and closure time, same scheduling intervals and products),
while considering the specificities of participating countries
• Effective, efficient and timely implementation of all legal provisions among
participating countries
• Clear, transparent and consistent pricing methodology
• Surveillance of the market to ensure market manipulation does not occur
STAKEHOLDER • Establishment of regional regulatory agencies and market operators
ROLES AND
RESPONSIBILITIES • Regional mindset and trust of policy makers, regulators, TSOs, market
participants, etc.
22R EG I O N A L M A R K E TS
ABBREVIATIONS
ACER
Agency for the Cooperation of IT Information technology
Energy Regulators
MER Mercado Regional de Electricidad
aFRR Automatically activated frequency
restoration reserves MRC Multi-Regional Coupling
BSP Balancing responsible party MW Megawatt
CACM Capacity allocation and congestion NEM National Electricity Market
management
OTC Over-the-counter
CAISO California independent system
operator PPA Power purchase agreement
CMM Capacity Management Module SADC Single day-ahead coupling
CO₂ Carbon dioxide SAPP South African Power Pool
CRIE Regional Commission for Electricity SIDC Single intraday coupling
Interconnection
SIEPAC Central American Electrical
EIM Energy Imbalance Market Interconnection System
ENTSO-E European Network of Transmission SM Shipping Module
System Operators for Electricity
SOB Shared order book
EU European Union
TERRE Trans European Replacement
EUR Euro Reserves Exchange
FCR Frequency containment reserves TSO Transmission system operator
GW Gigawatt TWh Terawatt-hour
GWh Gigawatt-hour USD US dollar
IEEFA Institute for Energy Economics and VRE Variable renewable energy
Financial Analysis
WAPP West African Power Pool
IEM Internal Electricity Market
XBID Cross-border intraday
IRENA International Renewable Energy
Agency
23I N N OVAT I O N L A N DS C A P E B R I E F
BIBLIOGRAPHY
ACER (2018), ACER/CEER – Annual report on the Emissions-EUETS (2009), Electricity balancing,
results of monitoring the internal electricity and European Union Emissions Trading Scheme,
natural gas markets in 2017, electricity wholesale www.emissions-euets.com/internal-electricity-
markets volume, Agency for the Cooperation market-glossary/593-balancing.
of Energy Regulators, https://www.acer.europa.
eu/Official_documents/Acts_of_the_ Agency/ ENTSO-E (2018a), Cross Border Intraday (XBID)
Publication/MMR%202017%20-%20ELECTRICITY.pdf. trading solution pre-launch event, XBID, European
Network of Transmission System Operators for
Asian Development Bank (2016), Greater Mekong Electricity, Brussels.
Sub-region: Energy Sector Assessment, Strategy,
and Road Map, ADB. ENTSO-E (2018b), TYNDP 2018 executive report
– Connecting Europe: Electricity, European
CAISO (2019), Western EIM benefits report – Network of Transmission System Operators for
Fourth quarter 2018, California ISO. Electricity, Brussels, https://tyndp.entsoe.eu/
Documents/TYNDP%20documents/TYNDP2018/
CAISO (2018), Western EIM benefits report – consultation/Main%20Report/ T YNDP2018 _
Second quarter 2018, California ISO. Executive%20Report.pdf.
Chaer, R., M. Gurin, E. Cornalino and M. Draper ENTSO-E (2018c), Statistical factsheet 2017,
(2014), “Complementariedad de las Energias European Network of Transmission System
Renovables en Uruguay y valorizacion de Operators for Electricity, https://docstore.entsoe.
proyectos para el filtrado de su variabilidad” eu/Documents/Publications/Statistics/Factsheet/
[Complementarity of renewable energies in entsoe_sfs_2017.pdf.
Uruguay and valuation of projects for filtering
their variability], Fundacion Julio Ricaldoni – ENTSO-E (n.d.), Market committee, European
Ingenieria en el Uruguay, Montevideo. Network of Transmission System Operators for
Electricity, www.entsoe.eu/about/market/.
Commission Regulation (2017), (EU) 2017/2195
of 23 November 2017 establishing a guideline on ESMAP (2010), Regional power sector integration,
electricity balancing, https://eur-lex.europa.eu/ Energy Sector Management Assistance Program.
legal-content/EN/TXT/PDF/?uri=CELEX:32017R21
95&from=EN. European Commission (2017), Communication
from the commission to the European Parliament,
Commission Regulation (2015), (EU) 2015/1222 the Council, the European Economic and Social
of 24 July 2015 establishing a guideline on Committee and the Committee of the Regions,
capacity allocation and congestion management, European Commission, Brussels.
https://eur-lex.europa.eu/legal-content/EN/TXT/
PDF/?uri=CELEX:32015R1222&from=EN. IEEFA (2018), Power-industry transition, here and
now: Wind and solar won't break the grid, Institute
Danish Energy Agency (2015), System integration for Energy Economics and Financial Analysis.
of wind power – Experiences from Denmark,
Danish Energy Agency. IRENA (2016), Renewable energy market analysis
– Latin America, International Renewable Energy
ECA (2010), “The potential of regional power Agency, Abu Dhabi.
sector integration”, Central American Electric
Interconnection System (SIEPAC): Transmission IRENA (2017), Adapting market design to high
& Trading Case Study, Economic Consulting shares of variable renewable energy, International
Associates. Renewable Energy Agency, Abu Dhabi.
24R EG I O N A L M A R K E TS
IRENA (2019a), Innovation landscape for Oseni, M. and M.G. Pollitt (2016), "The promotion
a renewable-powered future, International of regional integration of electricity markets:
Renewable Energy Agency, Abu Dhabi, Lessons for developing countries", Energy Policy,
http://www.irena.org/publications/2019/Feb/ Vol. 88, pp. 628–638.
Innovation-landscape-for-a-renewable-powered-
future. PacifiCorp (2019), Western Grid Coordination,
www.pacificorp.com/about/eim.html.
Larson, A. (2018), "How does the Western
Energy Imbalance Market work?", Powermag, Pariente-David, S. (2014), Successful grid
www.powermag.com/how-does-the-western- integration of renewable energy: Integration is the
energy-imbalance-market-work/?pagenum=2. name of the game, International Association for
Energy Economics.
Lippmann, M.J. and R. DiPippo (2017), Electricity
generation in Central America: Some relevant Perez-Arriaga, I.J. (2013), Regulation of the
comments on the importance of renewables, Power Sector, Springer-Verlag, London.
including geothermal, GRC Bulletin.
SAPP (2016), SAPP experience on regional power
Navarrete, M.E.R. (2016), Estadísticas del market development & operation, The Southern
Subsector Eléctrico de los Países del Sistema de African Power Pool, https://sari-energy.org/wp-
la Integración Centroamericana (SICA) [Statistics content/uploads/2016/03/Session-3-Mr-Musara-
of the electric sub-sector of the countries of the BETA-SAPP.pdf.
Central American Integration System (SICA)],
CEPAL, https://repositorio.cepal.org/bitstream/ The Eastern Africa Power Pool (2016),
handle/11362/42720/4/S1701275_es.pdf. http://eappool.org/
Newbery, D., M. Pollitt and R. Ritz (2017), "Market The World Bank (2018), Regional power trade in
design for a high-renewables European electricity West Africa offers promise of affordable, reliable
system", EPRG Working Paper, Cambridge electricity (20 April), www.worldbank.org/en/
Working Paper in Economics 1726; EPRG Working news/feature/2018/04/20/regional-power-trade-
Paper 1 711. west-africa-offers-promise-affordable-reliable-
electricity.
NordPool (2018), Cross-Border Intraday: Questions
& Answers (24 July), www.nordpoolgroup.com/ Westerneim (2019), Western Energy Imbalance
globalassets/download-center/xbid/xbid-qa_ market, www.westerneim.com/Pages/About/
final.pdf. default.aspx.
Olingo, A. (2018), "Phase One of regional power
pool project set for completion by mid-2019",
The EastAfrican, www.theeastafrican.co.ke/
business/Phase-One-of-regional-power-pool-
project-set-for-completion/2560-4699790-
g706gj/index.html.
25You can also read


