Sustaining Great Art and Culture - Environmental Report 2017/18
←
→
Page content transcription
If your browser does not render page correctly, please read the page content below

Sustaining Great
Art and Culture
Environmental Report 2017/18
Contents
Introduction
Foreword
Introduction

2017/18 Engagement
Key findings
Energy efficiency and carbon reductions
Increasing resilience
Benefits beyond carbon
New creative ecology
Key resources

Looking ahead
Appendices
About Julie’s Bicycle
Appendix 1: Methodology
Appendix 2: Data analysis
                                          Above: I am the Universe anthology FC
                                          Cover: Old & New View of the grid from the stage – New Theatre
                                          Royal Portsmouth. Photo © New Theatre Royal Portsmouth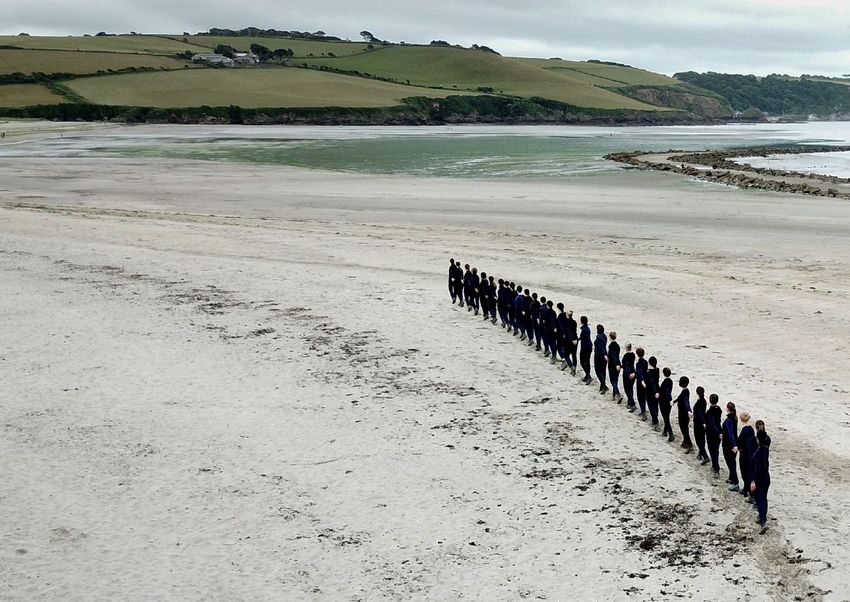
Introduction      2017/18 Engagement          Key findings        Looking ahead         Appendices                                                                                                               3

Foreword
                                                             benefits as a direct result of environmental initiatives.   work that engages with environmental issues and
                    “[Arts and cultural                      In the last six years, participating organisations saved    shifting social attitudes. By highlighting the steps that
                     organisations] show                     £16.5 million in energy costs.                              arts and cultural organisations are taking to become
                     us by example how we                                                                                more sustainable, they show us by example how we
                     can all take real action                These figures only scratch the surface. Organisations
                                                                                                                         can all take real action and drive change.
                     and drive change.”                      can demonstrate significant benefits by embedding
                                                             environmental sustainability into their business            I am impressed by the lead that NPOs have taken.
                                                             practice. These include improving staff engagement          The Arts Council is also committed to reducing its
It’s been more than ten years since Arts Council             and motivation, encouraging more consistent building        own environmental impact and we’ve had some
England started working with Julie’s Bicycle –               management and enhancing reputation in the eyes of          encouraging results from the Smart Working approach
the leading global charity in helping the creative           audiences and stakeholders. They are also part of the       we are currently trialling. In our Cambridge office we
community act on climate change. Together, we have           new creative ecology, with suppliers responding to the      have reduced staff travel mileage by 30% and paper
found practical and effective ways to help the sector        demand for greener products and services. Nearly a          use by 48%.
reduce its environmental impact. Our collaboration led       quarter of the National Portfolio has now switched to
                                                                                                                         Changing the way things are done is never easy, but
to a ground-breaking policy intervention in 2012, when       a green energy tariff, helping to drive demand for clean
                                                                                                                         the Arts Council England Environmental Programme
the Arts Council became the first cultural body in the       energy across the UK.
                                                                                                                         has shown that creative thinking and hard work can
world to include action on environmental sustainability      Arts and cultural institutions, and the artists they        bring results. There is much more to be done, but I
in our funding agreements with National Portfolio            work with, teach us about ourselves and our place in        know the sector will continue to promote innovative
Organisations (NPOs)1. These organisations have              the wider world, delighting, stimulating and inspiring      ways that will help us to build an environmentally
risen to the challenge, with a 23% reduction in energy       in equal measures. We need their influence now              sustainable future.
consumption and a corresponding 35% reduction in             more than ever. In October, a landmark report by the
carbon emissions since 2012/132.                                                                                         Sir Nicholas Serota
                                                             UN Intergovernmental Panel on Climate Change
                                                                                                                         Chair, Arts Council England
One of our priorities at the Arts Council is to help         warned that “rapid far-reaching and unprecedented
improve the all-round resilience of arts and cultural        changes in all aspects of society” are required to limit
organisations. As the findings of this Annual Report         global warming to 1.5C, highlighting the devastating
show, environmental action isn’t just responsible,           difference between this temperature increase
it makes economic sense. Many arts and cultural              compared with 2C. The arts can help communicate the         1 Including Major Partner Museums (MPMs). As of April 2018 we have fully integrated
                                                                                                                           MPMs into the National Portfolio, so for the purpose of this report will be referring to
organisations report that they generate financial            urgency of this message to the public, programming            all organisations as NPOs
                                                                                                                         2 Based on a core group of 136 organisations who have consistently reported since 2012/13
Introduction      2017/18 Engagement         Key findings        Looking ahead        Appendices                                                                                                          4

Introduction
                   “Arts Council England’s                  The programme has asked for annual data, policies        energy use, biodiversity, packaging, food sourcing and
                    policy intervention has                 and action plans from all National Portfolio             merchandise, and much else besides. The application
                    prompted hundreds of                    Organisations (NPOs). To support this, Julie’s Bicycle   of sustainability principles is continually extending,
                    creative organisations                  has delivered a rich programme: guides, events,          generating valuable new knowledge that helps drive
                    to demonstrate how a                    demonstrations, blogs, research, analysis, networks      a sustainable cultural economy readying for change.
                    creative ecology can work.”             and knowledge-sharing, all of which has amplified
                                                                                                                     Midway through the programme, in late 2015,
                                                            and nourished sector collaboration.
                                                                                                                     the Paris Agreement was adopted by almost 200
This report is a concise review of 2017/18, and the         The creative industries account for £92 billion of       countries; in June 2017 the USA stated its intention
end of a six-year policy intervention in climate action     Gross Value Added (GVA) and two million jobs, and        to withdraw. While 195 countries remain committed
by Arts Council England, Julie’s Bicycle and an             they are growing twice as fast as the economy as         to it, citizens and cities have pushed ahead of national
exceptional community of culture, arts and creative         a whole3. The material impacts associated with an        governments to meet its targets – Leeds, Liverpool,
organisations. It’s a story anchored in hard data –         economy of this size are significant. Simultaneously,    London and Manchester are part of a major global city
environmental impacts, numbers, comparisons and             the UK low carbon and renewable energy (LCRE)            resilience movement organising and scaling together.
scenarios. They help us to learn, to collaborate, to        economy grew by 5% to £42.6 billion in 2016              Big science has become citizen action: Blue Planet 2
plan and to scale. The story tells how carbon literacy      (from £40.5 billion in 2015) and continued to account    gave voice to the outrage of plastic pollution, leading
across a rich cultural community can yield so much          for around 1% of total UK non-financial turnover4.       to business, government and manufacturers pledging
more than carbon reductions. Starting from the basics                                                                to act; it is remarkable how quickly once ubiquitous
                                                            The programme results show we are ahead of
– carbon footprints – this deceptively simple policy                                                                 plastic straws are disappearing. This shows how
                                                            the game: strong year-on-year reductions in
is demonstrating how a sustainable cultural sector                                                                   a cultural intervention with impeccable timing,
                                                            energy use across the National Portfolio – and
might actually work; inspiring deeper exploration                                                                    a cool and trusted advocate, and a clear message
                                                            the resulting £16.5m financial savings created
and connections between climate and social justice,                                                                  can change everything.
                                                            since 2012/13 – is evidence that this is working.
investment and innovation, clean energy and new
                                                            Together, the creative and the green economies           But it isn’t enough.
materials, empathy and biodiversity. Some may argue
                                                            could be exponentially powerful agents of change.
that focusing on impacts is missing the point,                                                                       Coming between the landmark Intergovernmental
                                                            The figures alone do not capture the detail of
that environmental action across the arts is best                                                                    Panel on Climate Change (IPCC) Special Report on
                                                            change, the daily acts of commitment: tour planning,
served by focusing on artists and content.
                                                            procuring for exhibitions, concessions for festivals,
This is a misconception: we need both.                                                                               3 https://www.gov.uk/government/publications/creative-industries-sector-deal/creative-
                                                            communicating to audiences, recycling decisions,           industries-sector-deal-html#fn:1
                                                                                                                     4 https://www.ons.gov.uk/economy/environmentalaccounts/bulletins/finalestimates/2016
Introduction                2017/18 Engagement                         Key findings       Looking ahead     Appendices                                                                       5

Global Warming, launched on October 8th5, and the
COP24 talks in Poland6, this report is a rallying cry for
                                                                                                                                     The Arts Council England
greater ambition. The IPCC assessment calls for direct
action from governments and citizens, with just 12
years in which to stabilise global warming so that it
does not exceed 1.5 degrees. Climate change and the
environment are moral issues that require visible and
                                                                                      ''
                                                                                      It’s wonderful to see the
                                                                                      collaboration between
                                                                                                                                     Environmental Programme
                                                                                                                                     Arts Council England’s 2012 policy intervention
                                                                                                                                     requires National Portfolio Organisations to annually
                                                                                                                                     monitor their environmental impacts using a carbon
                                                                                                                                     foot-printing tool developed by Julie’s Bicycle and
tangible responses.
                                                                                      Julie’s Bicycle, the Arts                      to have an environmental policy and action plan.
In uncertain times, arts and culture become even more
important. As we experience climate change unfolding
                                                                                      Council and the creative                       Organisations are supported with an ongoing
                                                                                                                                     programme of events, training, advice, resources
around us, arts and culture can intervene, disrupt,                                   sector succeeding in                           and community-building provided by Julie’s Bicycle.
generate new knowledge and foster cultural practice
that illuminates pathways through the complexities                                    bringing together so                           The 2017-18 programme has aimed to:
of climate and the environment. So much has been                                      many different cultural                        • help Arts Council England’s National Portfolio
achieved in the last six years. As anthropologist
Margaret Mead said in 1978 as she received her                                        organisations to transform                       Organisations meet their funding requirements
                                                                                                                                       of impact measurement and action-planning
Planetary Citizen Award for her contribution to culture:                              the public conversation                        • encourage and champion the sector’s
“Never doubt that a small group of thoughtful,
committed citizens can change the world.”
                                                                                      on climate change, while                         sustainable development

The stakes are high. What will we achieve
                                                                                      tackling their own impact                      • deepen understanding of the sector’s
                                                                                                                                       environmental performance
in the next four years?                                                               as well. Thank you for all
                                                                                                                                     • support the development
Alison Tickell                                                                        your commitments so far                          of Arts Council England’s
Director, Julie’s Bicycle
                                                                                      and let’s keep blazing the                       approach to environmental
                                                                                                                                       sustainability
                                                                                      trail, this work has never
                                                                                      been more important.

5 https://www.ipcc.ch/pdf/session48/pr_181008_P48_spm_en.pdf – calls for renewed
  urgency and action on climate to keep global temperatures at 1.5 degrees Celsius
  warming (below the landmark Paris target of 2 degrees)
6 https://unfccc.int/katowice
                                                                                      ''
                                                                                      Christiana Figueres
                                                                                      Founding Partner, Global Optimism and
                                                                                      Former Executive Secretary, UNFCCC 2010-2016
Right: Oxford Playhouse: The Tempest, Oct 2015. Photo by Topher McGrillis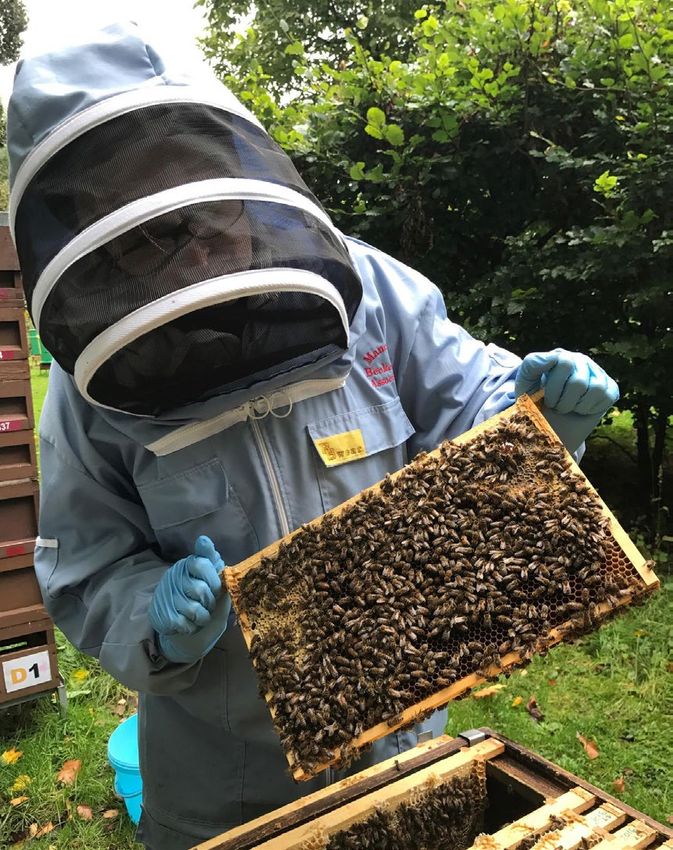
Introduction                    2017/18 Engagement                              Key findings      Looking ahead    Appendices                                                                                                   6

Achievements
                                   Energy efficiency and
                                                                                                                                                          Increasing resilience
                                    carbon reductions

            23% 35%                                                                            7%                               £16.5 m                                                                      75%
          decrease in                             decrease in energy                        average annual                                 saved by the reporting                                 of organisations find their
          energy use                            use emissions (based                      reduction in energy                             portfolio since 2012/13                                environmental policy useful
       between 2012/13                          on electricity and gas)                     use emissions                                   due to year-on-year                                    for supporting funding
         and 2017/18                            from 67,600 to 44,000                          (based on                                 reductions in energy use8                                       applications
                                               tonnes of CO2 between                      electricity and gas)
                                                2012/13 and 2017/187                         since 2012/13

                                                                                                                                                 Carbon literacy is creating
                    Signs of a new creative ecology
                                                                                                                                                      wider benefits

                 ¼                                      78%                                    43%                                                65%                                                    70%
      of NPOs are now        of NPOs find their                                          of organisations find                                 of organisations                                       of organisations
   either on a green tariff environmental policy                                         their policy useful for                                are producing                                       feel the programme
      or purchase their      useful for business                                         new partnerships and                               creative work with an                                    positively impacts
    energy from a 100%            planning                                                  collaborations                                  environmental theme                                        staff wellbeing
    renewable supplier

7 This reduction is partly related to the UK’s grid decarbonisation as fossil                                            8 Based on results from applying the 5% average annual reduction achieved by the core group on
  fuel energy generation is phased out and replaced with renewables.                                                       energy spend to the whole portfolio (based on 2012/13 electricity and gas of 469 organisations)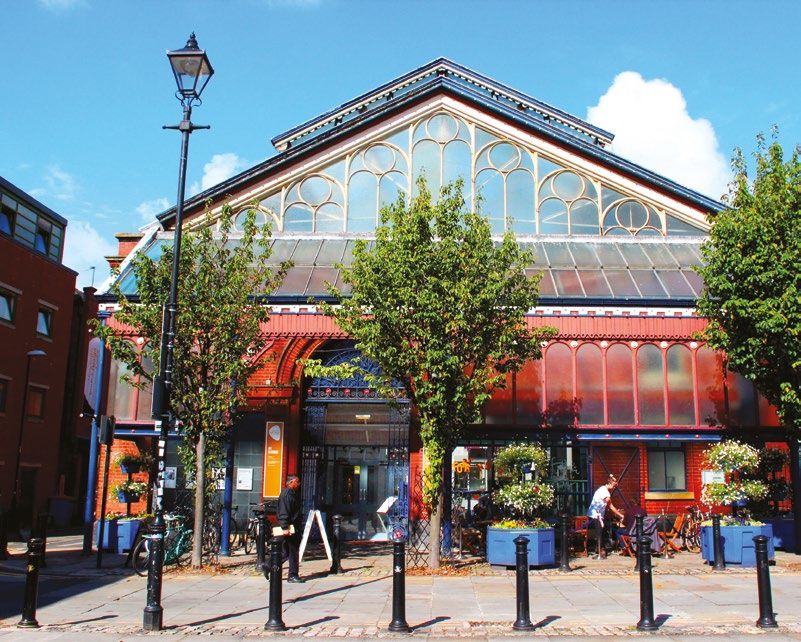
Introduction       2017/18 Engagement   Key findings       Looking ahead       Appendices                                              7

2017/18 Engagement

The arts and cultural sector
is connecting with climate
change and the environment
through the programme.
                                                                                            ''
                                                                                            Midlands Arts Centre has a strong
                                                                                            commitment to environmental
                                                                                            sustainability across the organisation.
  87           %
                                        58         %             An average of

  consider themselves engaged
  or very engaged in line with
                                        of organisations
                                        have been
                                                                 81         %
                                                                 of organisations use
                                                                                            As well as practical initiatives,
                                                                                            we recognise the important role
                                                                                            that the arts has to play in increasing
  engagement since 2012/13
                                        using their              their environmental
                                        environmental            policy and action plans
                                                                                            environmental awareness. MAC’s

  88
                                                                                            Green Group continues to demonstrate
               %                        data to inform
                                        decision-making
                                                                 for business-planning,
                                                                 funding applications
                                                                                            that it is possible to have a relatively
                                                                 and developing new
  agree environmental reporting                                  partnerships               large impact with a little effort
  has or can make a positive
  difference to the sector                                                                  and imagination.
                                        An average of

  77           %                        71        %
  agree environmental reporting has
  or can make a positive difference
  to their organisations
                                        of organisations say action plans bring about
                                        recognisable positive change
                                                                                            ''
                                                                                            Lizzie Moran
                                                                                            Head of Technical Resources,
                                                                                            Midlands Arts Centre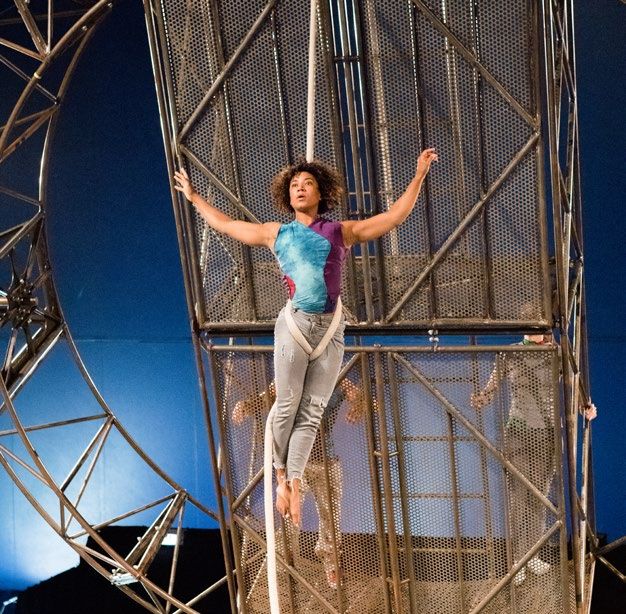
-   ,. ·,i ,         , .   , .
                                                                                                                 l          ~,.     •   1

Introduction                 2017/18 Engagement                         Key findings   Looking ahead   Appendices                             8

Key findings
Methodology
The findings in this report were drawn from:
• Environmental reporting by National Portfolio Organisations
  on the Creative IG Tools
• An evaluation survey completed annually by NPOs
  and Major Partner Museums since 2012
• Case studies of best practice
For the methodology, analysis and sources, see Appendices

Above: Broken Tusk, Festival of the Imagineers, Coventry. Photo © Marcin Sz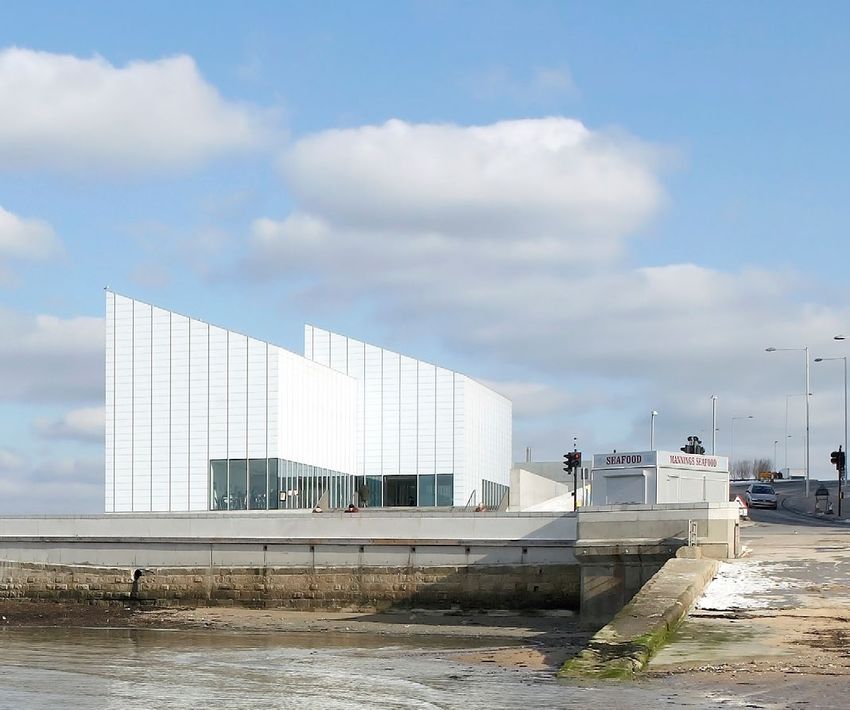
Introduction                  2017/18 Engagement                      Key findings     Looking ahead        Appendices                                                                 9

Energy efficiency and carbon reductions
Organisations’ environmental data
show us that energy use emissions                                     Stories from the sector:                               Since 2012/13, core group CO2         There has been an
have decreased by 35% since 2012/13                                   carbon reduction                                       emissions have decreased by           average annual

                                                                                                                             35%
– an average annual reduction of 7%.9                                                                                                                              reduction in CO2
                                                                      Pegasus Theatre (Oxford) has reduced its                                                     emissions of
The number of organisations reporting                                 carbon emissions by 4.3 tonnes in 2018. Aside

                                                                                                                                                                   7%
robust data can vary from year to year:                               from optimising energy efficiency, the building
                                                                                                                             (based on electricity and gas) from
therefore, for accurate analysis of                                   management system monitors carbon dioxide
                                                                                                                             67,600 to 44,000 tonnes of CO2
longitudinal data in a changing portfolio,                            levels, supplying fresh air and cooling with minimal
                                                                                                                             between 2012/13 and 2017/18
a cohort of 136 organisations (this ‘core                             use of refrigerant gasses. Lighting is controlled                                            per year over
group’ representative of the diversity of                             by motion sensors, and solar panels are installed                                            six years
the sector at large) has provided strong                              on the south-facing roof. An environmental
and consistent data since 2012/13.                                    working group drives forward new initiatives and
The core group’s energy use emissions                                 champions sustainability across the organisation.
represent 56% of the whole reporting
portfolio’s emissions. This group, with                               Manchester Craft & Design has reduced its
six years of consistent data, provides a                              carbon emissions by 29% in 2017/18 compared
reliable source of analysis from which                                to 2016/17, mainly due to reduced electricity
we can infer longer-term trends and                                   consumption with support from the ERDF-funded
extrapolate findings and avoided costs.                               Carbon Reduction programme (Green Business
                                                                      Growth Hub).

9 This reduction is partly related to the UK’s grid decarbonisation
  as fossil fuel energy generation is phased out and replaced
  with renewables.

Right: Manchester Craft & Design Centre
Introduction   2017/18 Engagement   Key findings       Looking ahead        Appendices                                                                                  10

                                                   The arts and cultural sector has continued to focus
                                                   on reducing energy use. From upgrading lighting to         Stories from the sector:
                                                   installing onsite renewable energy sources, small and      energy efficiency
                                                   large organisations across England are demonstrating
                                                                                                              In 2017, Turner Contemporary (Margate)
                                                   how even the smallest contribution makes an impact.
                                                                                                              automatically shut down computers to reduce
                                                   Efficient and responsible use of energy is building
                                                                                                              electricity at night, contributing to a 50% reduction
                                                   resilience and maximising resources.
                                                                                                              in administration-specific energy use. Lighting-
                                                                                                              specific energy use has been reduced by 12%,
                                                                                                              keeping energy consumption under control
                                                                                                              despite an increase in opening hours during
                                                                                                              the summer.
                                                                                                              The gallery is re-using exhibition furniture several
                                                                                                              times before it is recycled. Plinths and Perspex,
                                                                                                              which account for much exhibition ‘waste’, are
                                                                                                              re-used by local artists, schools and businesses.
                                                                                                              Turner’s bespoke gallery modular wall system
                                                                                                              enables plasterboard to be added, removed and
                                                                                                              recycled, reducing consumption of materials.

                                                                                                              Direct energy consumption in 2017/18
                                                                                                              decreased by

                                                                                                              23
                                                                                                              since 2012/13
                                                                                                                               %

                                                                                                              There has been an average reduction
                                                                                                              in energy use of

                                                                                                              5%
                                                                                                              per year over six years

                                                                                                           Left: Turner Contemporary exterior. Photo by Hufton + Crow
Introduction 2017/18 Engagement Key findings Looking ahead Appendices 11
Increasing resilience
The reporting portfolio’s drive to reduce
£16.5m
energy consumption has created Stories from the sector: financial resilience
savings of £16.5 million since 2012/1310
Rural Arts North Yorkshire’s sensor heating system and
– 51% of NPOs say they experience
energy-efficient lighting, both installed as part of Arts Council of savings created since 2012/13
financial benefits as a result of their
England’s Capital Fund, have improved efficiency and reduced
environmental initiatives, and over
costs by 5%. In addition, its solar panels produced a return of
70% of NPOs find their environmental
£495 in this financial year. The company regularly uses discarded
policy useful for supporting funding.
materials such as textiles, cardboard and plastics in its creative
Across the portfolio, those who are workshop programme, uses locally sourced products and
investing time and effort to better produce in its cafe, and has dramatically reduced its postage and
understand their environmental paper usage. The gallery regularly features work made from a
impacts, including simple good range of upcycled materials including glass, metal and textiles.
housekeeping measures like switching
off lights and computers at night, As a part of an upgrade project, Wiltshire Music Centre Trust
are realising these financial benefits. (Bradford on Avon) is gradually replacing its building lights with
Engagement with the programme LED lights, which, combined with the planned upgrade of its
demonstrates to audiences that the auditorium’s lights, should enable it to reduce CO2 emissions.
arts and cultural sector is committed This investment is at the heart of its 20th Anniversary Fundraising
to climate action. This is beneficial for Appeal; to date it has gathered half of the funding required,
reputation, helping secure funding for including £12,000 in winnings from the M&S Energy Fund
further improvement and showing that competition and Climate Friendly Bradford on Avon.
the arts and cultural sector is engaging The Trustees have agreed to underwrite the rest of the funding
with the complex environmental while fundraising efforts continue and the lights upgrade in
challenges society is facing. the Auditorium was successfully completed in August 2018.
Half Moon Young People’s Theatre (London) reduced its gas,
electricity and water usage (gas by 7.5%, electricity by 4.5%,
water by 28%) compared to 2016/17. In 2017/18 it received
10 Based on results from applying the 5% average annual
reduction achieved by the core group on energy spend to a grant of just over £3,000 to replace light fittings with more
the whole portfolio (based on 2012/13 electricity and gas
of 469 organisations)
energy-efficient versions and specialist LED theatre lights.
Right: Love and Spice. Photo: BSDCIntroduction 2017/18 Engagement Key findings Looking ahead Appendices 12
Benefits beyond carbon
A wider understanding of climate change and
environmental impacts is helping organisations Stories from the sector: Creative responses:
65%
link environmental practice with other creative responses
organisational priorities.
In 2017, The Poetry Society (London) ran
The programme has strengthened literacy around four programmes about climate change and
of organisations are producing (or planning to
reporting requirements, and also enabled many the environment with young writers aged 11
produce) work with an environmental theme.
organisations to embrace environmental action as to 25, generating nearly 500 new poems. The
part of their culture, understanding the wide-ranging programmes – I Am The Universe (in association
benefits of action. Organisations are including with University of Leeds), Turn Up The Volume Team morale and wellbeing:
70%
environmental sustainability in business strategies, (with Oxfam), Namedropping (with People Need
stimulating new jobs, supporting the circular economy Nature) and Melting Ice (with National Maritime
and increasing the use of sustainable technology and Museum) – involved publications, live workshops
services in the sector. This shift is also seen in new and performances in Harrogate, Leeds, London of organisations declare that involvement
collaborations and creative climate action: in 2017/18, and York, reaching an audience of 11,000 people. with the programme has led to an improvement
26% of the portfolio contributed to wider city or
in team morale and wellbeing.
neighbourhood environmental policy and strategy. Modern Art Oxford’s Future Knowledge
exhibition combined artistic visual research
Strategic decision-making:
with creative methods from design, ecology,
People of Oxford!
What actions did you take last week
to contribute to a sustainable future?
biomimicry and systems thinking. Diverse
perspectives and themes were explored through
conversation, events and images, examining
our attitudes to the past, present and future in
78%
of NPOs find their environmental policy
a degrading environment, combining reflection useful for business-planning.
and loss with inspirational solutions.
...,..
""",
~J~·"",..,._-
,t.:P'°' ~
Left: Future Knowledge. Photo © Modern ArtIntroduction 2017/18 Engagement Key findings Looking ahead Appendices 13
Stories from the sector: Reputation and risk management:
''
It’s the little things that
make a difference; from
place-making and
community engagement
The Middlesbrough Institute of Modern Art’s
garden, with Gold Ecocampus accreditation, is a
flourishing ecological project involving students
46%
of NPOs have experienced reputational
benefits as a result of being part of the
environmental programme.
paper Jiffy bags to reusable and local people, and helping drive action on
pollution, biodiversity, food production and
cups, it all helps staff feel recycling of materials. Collaboration:
they are doing their bit and
this is then projected to
audiences… plus, chipping
Leicester’s Phoenix Arts Centre has continued
to connect audiences to environmental issues
through their programme. In The Eyes Of The
43%
of organisations, on average, find their policy
Animal (a VR installation showcased at its useful for developing new partnerships and
away at little things does Spark Festival Digital Playground event) raised collaborations – this in turn can help improve
have an impact and staff awareness of the biodiversity of UK woodlands, their chances to influence the wider sector.
while the student film festival was programmed
feel good! around the theme of wilderness. It also continues
to grow its own kitchen produce in the garden and
manages a volunteer scheme, Green Fingers.
''
Julie Hewitt
Creative Arts East, Norfolk
Focal Point Gallery (Southend-on-Sea)’s
programme Maximum Overdrive, in collaboration
with Spiralseed, developed a vegetable garden
in the gallery and public square in the summer
of 2017. The garden was managed by Project 49,
a group for adults with learning difficulties. The
vegetables were harvested and cooked as part of
Club Critical Theory’s Food Cultures programme,
which included discussions on food sustainability
and the environment.
Right: Spark Festival 2017. City Playground.Photo by Pamela RaithIntroduction 2017/18 Engagement Key findings Looking ahead Appendices 14
Stories from the sector: stakeholder engagement
Brewery Arts Centre (Kendal) hosted an exhibition by emerging artist Tilly
Henry entitled Plastic On The Menu, highlighting issues around plastic in
drinking water. The venue also programmed five film screenings with strong
environmental themes, including Human Flow by Ai Weiwei and A Plastic
Ocean by Craig Leeson. The Brewery used these as a forum for discussion, and
groups involved included all the major political parties, South Lakes Action on
Climate Change, Cumbria Action for Sustainability, the Landworkers’ Alliance and
Amnesty International.
University of Cambridge Museums are committed to using their collections
to engage audiences with environmental issues. Projects include Climate Hack,
which challenged four teams of makers, artists, and environmental experts to
design a prototype exhibit about climate change for four of their museums; and
Operation Survival, a collaboration with Fire Hazard Games, which engages
participants with the environment through a high-energy competition across
multiple museum sites.
HOME (Manchester) is committed to working on a zero-carbon culture road map
and action plan, as part of the city’s zero-carbon ambition. A joint collaboration
with the Business Growth Hub helped to develop a sustainable procurement
approach to all operational contracts. HOME has established a strong leadership
position through partnerships with Transport for Greater Manchester and
Manchester Arts Sustainability Team, the Clean Air Day, the Walking Festival,
Manchester Climate Change Conference, Carbon Literacy Project and URBACT.
Left: Heaton Park Training, HOMEIntroduction 2017/18 Engagement Key findings Looking ahead Appendices 15
New creative ecology
Inevitably, action is changing the way the creative
43%
sector goes about its business. New priorities, Stories from the sector:
practices, skills and investment are kick-starting a circular economy
new creative ecology, which is generating jobs and
Glyndebourne Opera House (Lewes) reuses are now actively seeking out and purchasing
driving demand for greener products and services.
and recycles props, costumes and sets as much or procuring products, materials and/or services
New skills, roles and knowledge are supporting clean
as possible. Costumes that are in good condition with strong environmental credentials
technologies, sustainable goods and services, waste
are sold to staff, other theatre companies or
solutions and the emergent circular economy.
costume hire companies, while props are recycled
¼
Organisations are demonstrating that everything through schemes like Set Exchange. Recently,
is connected: activities to reduce electricity use Glyndebourne began listing props of value on
engage audiences with environmental issues, its website, investing the proceeds into their
improve staff wellbeing and foster collaboration state-of-the-art Production Hub, opening in 2019. of the portfolio are now either on a
to procure clean energy – in short, everything is Environmental concerns have been carefully green tariff or purchase their energy
driving a new creative ecology. integrated ensuring the final building meets the from a 100% renewable supplier
BREEAM excellent standard for sustainability.
Many organisations are switching to clean
This builds on Glyndebourne’s wide-ranging efforts
energy providers or green tariffs, accelerating the
to reduce its environmental impacts – such as the
transition towards a 100% renewable energy market.
wind turbine, which in six years has generated, on
The number of organisations on green tariffs
average, the equivalent of 102% of the company’s
has increased throughout the programme,
annual electricity requirements.
reducing emissions and driving the demand
for clean energy in the UK.
A 20-fold increase in onsite renewable energy
generation compared to 2012/13 – doubling since
2016/17 – is an exciting indication of a potentially
very significant shift towards clean energy.
Right: Glyndebourne Opera House and turbine. Photo by Sam StephensonIntroduction 2017/18 Engagement Key findings Looking ahead Appendices 16
Stories from the sector: Stories from the sector:
energy generation
Artsadmin (London)’s solar panels generated
8.51 MWh of electricity in 2017/18, saving 4.84
tonnes of CO2. It received £1,084 for electricity
provided to the National Grid in 2017/18. At 11.65p
supply chain
Lyric Hammersmith (London) ran a four-week
staff and audience campaign exploring ways to
switch from single-use plastic supplies. On the
last day of the campaign Lyric hosted one of the
''
The key shift is that,
from now on, we have
per kWh, the solar panels’ generation represents researchers for Blue Planet 2. The campaign placed our work in
a cost saving of approximately £992 per annum. resulted in:
Artsadmin’s electricity and gas are from a the context of the UN
• removing all single-use plastic bottles from
renewable energy supplier.
sale in its bar Sustainable Development
Arts Services Grants (London) has received • removing all plastic straws and replacing them Goals. Following
over £8,000 from the energy generated by its solar
with paper alternatives
workshops on the policy,
panels (approximately 10,000kW). • selling reusable water bottles and eco-coffee
cups to audiences, offering discounts on hot the staff – especially
drinks to those who use them frontline staff in the bar
• increasing the number of water fountains and kitchen and production
around the building
– have whole-heartedly
• switching energy and gas supply to Ecotricity
engaged with this context
Contact Theatre (Manchester) switched to and mission.
an electric-powered van: its low running costs
enabled savings of nearly £4,000 and the theatre’s
green energy supplier means it is charged from
renewable sources. Through its membership
of the Fit for the Future Network, Contact has
offered advice and support to other organisations
considering electric vehicles.
''
Lucy Davies
Executive Producer,
Royal Court Theatre
Left: Extraordinary Bodies - What Am I Worth, Glasgow 2018. Photo © Alfa MarksIntroduction 2017/18 Engagement Key findings Looking ahead Appendices 17
Key resources
Over the length of the programme,
Julie’s Bicycle has developed and
produced a wide range of key resources.
Season for Change Creative Climate Leadership
4
factsheets: renewable
2
Creative Climate Census
Across the country, 198 organisations
also signed up to Season for Change,
a programming invitation to celebrate
In 2016, Julie’s Bicycle launched the Creative Europe
co-funded Creative Climate Leadership programme for
artists and cultural professionals from across the world
the environment and highlight the to explore the cultural dimensions of climate change
and green electricity
urgency of action on climate change. and take action with impact, creativity and resilience.
factsheet
This initiative, facilitated by Artsadmin Participants include artists, cultural professionals,
and Julie’s Bicycle, has generated 100 and representatives from organisations and funders
22 30
events in venues ranging from the across a wide range of creative disciplines from
Eden Project in Cornwall to Lakes Alive Australia, Belgium, China, France, Indonesia, Ireland,
Festival in Cumbria, from carparks to Montenegro, Netherlands, Slovenia, Spain, Taiwan,
case studies events with 1.4k delegates Kew, allotments to Sadler’s Wells. Turkey, the UK and Zimbabwe. Among the alumni of
Leading cultural institutions including the programme’s five-day intensive trainings in Wales
the Victoria and Albert Museum, and Slovenia are six Creative Climate Leaders from
11
guides: Towards the Circular
18
webinars with 600
Curzon Cinema Group and the National
Theatre have thrown significant support
behind the campaign, organising
industry events and promoting
NPOs, as well as an Arts Council England employee.
As part of Julie’s Bicycle partnership with Arts Council
England to support the 2018–2022 NPOs, two cohorts
of ten organisations will, through the Accelerator
Economy, Biofuels attendees: Green Touring, their commitment. The increased Programme, receive the opportunity to take part in a
Making Data Meaningful, momentum for programming on climate three-day training initiative adapted from the Creative
Museums’ Environmental and the environment has demonstrated Climate Leadership programme in 2018 and 2020.
Framework an inspiring range of creative content.Introduction 2017/18 Engagement Key findings Looking ahead Appendices 18
Looking ahead
Julie’s Bicycle shows that a small proportion of
organisations with large infrastructures generate over
“The sector’s ambition half of the portfolio’s total emissions. In response,
has been raised, we are rolling out a new dedicated scheme for
and so has ours.” these organisations – the Spotlight Programme.
On the programme, organisations will work with
Julie’s Bicycle to set achievable, yet ambitious,
As of April 2018, Arts Council England embarked Environmental Impact Reduction Objectives, resulting
on a new four-year contract with Julie’s Bicycle, in a significant change to the sector’s carbon footprint.
considering how we can support organisations These new programmes will complement the
going even further to improve their environmental incredible achievements already being made by
sustainability. Over the years we have seen carbon arts and cultural organisations, who have shown
literacy and environmental action plans become the substantial enthusiasm and dedication over the
new normal for arts and cultural organisations, who past six years. The results of their hard work – as
are imbedding sustainability across all elements of demonstrated by this report – highlight tangible
their business. The sector’s ambition has been raised, benefits to the organisations, their audiences, the
and so has ours. sector and to society. Looking ahead, we are excited
In May, we launched the Accelerator Programme, to keep championing their efforts and are committed
which will see two cohorts of ten organisations to helping the arts and cultural sector become
leaders in environmental sustainability.
or consortia work with Julie’s Bicycle to advance
their sustainability practice. Julie’s Bicycle will help Francis Runacres
these organisations develop their ambitious ideas Executive Director, Enterprise & Innovation
into deliverable projects, encouraging enterprise, Arts Council England
innovation and creative perspectives on climate
and the environment.
We also want to ensure our efforts are achieving
the greatest possible impact. Data collated by
Right: Salisbury Arts TheatreIntroduction 2017/18 Engagement Key findings Looking ahead Appendices 19
About Julie’s Bicycle
Climate change is a consequence of a global economic Acknowledgements
system predicated on the over-exploitation of
Special thanks to Julie’s Bicycle and
natural resources which doesn’t account for – nor
all of the Arts Council England NPOs.
fully understand – the implications of large-scale
environmental destruction. We need positive and Content: Laura Pando, Paul Crossley and Alison Tickell
inspirational action that respects the planetary
Data analysis and research: Claire Buckley,
systems upon which humanity relies, and which
Catherine Bottrill and Russell Layberry
builds our sustainable future.
Design: Cog Design
Julie’s Bicycle, a London-based not-for-profit,
is dedicated to encouraging, accelerating and Proofreading: Sarah-Clare Conlon
amplifying the cultural response to climate change
and environmental sustainability. We believe that the
creative community is uniquely placed to imagine,
create and communicate the changes that will
transform our world. Culture will play an exponentially
influential role in the climate change challenge.
We run a rich programme of events, free resources,
consultancy, training, community-building and
advocacy. We are deeply embedded within the
creative and cultural community, working alongside
organisations and artists across the UK and
internationally to inspire creative responses
and positive action.
juliesbicycle.com
Right: All along the Riverbank – Squirrel sitting!Introduction 2017/18 Engagement Key findings Looking ahead Appendices 20
Appendix 1: calculated for each year, based on all sources of impact
and data from all reporting organisations.
Energy use emissions
Energy use emissions are calculated by applying UK
Methodology Energy
A more in-depth analysis was done of energy use,
grid average electricity and gas conversions factors to
absolute electricity and normalised gas consumption
(in other words, absolute gas consumption figures have
energy use emissions and energy costs and trends, as been adapted according to weather conditions) in kWh.
Greenhouse gas (GHG) emissions are a measure of
energy represents 93% of the total carbon footprint.
climate change impact. Different activities release Two sets of energy costs calculations were done for
different GHGs, for example burning coal to generate Energy use each year: one for all reporting organisations and one
electricity releases carbon dioxide (CO2e), landfill for the core group of 136.
waste releases methane. Each GHG has a different Trends in energy use are based on absolute electricity
global warming potential, for example methane’s is and gas consumption (mains or grid supply) and onsite Avoided costs
20 times greater than CO2e per unit of gas. Carbon renewable energy in kWh.
Avoided costs were calculated for the core group of
dioxide equivalent (CO2e) is used to express the Two sets of energy use calculations were done for 136 organisations reporting each year since 2012/13.
climate impacts of an activity in a single measure. each year: The starting point was their energy cost (mains
CO2e emissions are calculated by applying carbon
• one for all reporting organisations, electricity and gas) in the baseline year (in other words,
conversion factors, published annually by the
the number of which changes each year 2012/13 and the average annual 4% reduction in energy
government, for example kg CO2e per kilowatt hour
use which this group has achieved). The avoided costs
(kWh) of electricity used, tonne of landfill waste or • one for a core group of 136 organisations were calculated by comparing cumulative costs under
litre of petrol used. The conversion factors for UK grid which reported each year since 2012/13
a ‘business as usual’ scenario (in other words, 2012/13
energy reflect its carbon intensity, or the amount of
energy costs remaining constant each year against
CO2e emissions generated depending on the mix of Energy costs
cumulative costs where there has been an average
fossil fuels, renewables and nuclear energy used. Energy costs are based on absolute electricity and annual 4% reduction each year from 2012/13).
The methodology used to establish the carbon gas consumption (mains or grid supply) in kWh, The results were extrapolated up to 2029/30.
footprint and to identify trends in energy use, energy applying average energy tariffs of 11 pence per kWh
Avoided costs were calculated for all reporting
use emissions and energy costs over six years from of electricity and 3 pence per kWh gas. The cost of
organisations. The starting point was the energy
2012/13 to 2017/18, as well as that used to determine onsite renewable energy is not covered as costs
cost (mains electricity and gas) in the baseline year
avoided costs, is outlined below. depend on the technology used, but are mainly
(in other words, 2012/13, based on the energy use of
investment and maintenance costs and in many cases
469 reporting organisations). The avoided costs were
Carbon footprint calculation onsite renewables actually generate income through
calculated by comparing cumulative costs under a
feed-in tariffs.
The carbon footprint was calculated by applying ‘business as usual’ scenario (in other words, 2012/13
conversion factors of the year in question to energy, Two sets of energy costs calculations were done for energy costs remaining constant each year against
water, waste, travel, transport and materials data of each year: one for all reporting organisations and one cumulative costs where there has been an average
the year in question. Annual conversion factors are for the core group of 136. annual 4% reduction each year from 2012/13).
published by the government. A total footprint was The results were extrapolated up to 2029/30.Introduction 2017/18 Engagement Key findings Looking ahead Appendices 21
Appendix 2:
Data analysis
Total footprint
Table 1. Total footprint 2012/13-2017/18 – all impacts and reporting organisations
tonnes CO2e
Source of impact 2012/13 2013/14 2014/15 2015/16 2016/17 2017/18
Electricity 74,168 74,858 79,595 63,882 65,290 51,819
Gas (normalised) 25,534 22,818 27,018 22,331 26,509 25,745
Oil and diesel 186 69 80 511 499 499
Water 774 775 730 557 686 686
Waste 1,243 1,279 1,706 2,558 2,843 2,843
Touring travel 242 664 707 581 496 496
Business travel 643 932 784 1,765 1,476 1,476
Materials 26 14 25 54 58 58
Total 102,815 101,409 110,645 92,239 97,858 83,622
Organisations 469 474 481 538 623 547
% change number organisations 12/13-17/18 17%
2017/18 vs. 2012/13 change tonnes CO2 -19,193
2017/18 vs. 2012/13 % change -5%
Year on year change tonnes CO2 -1,406 9,235 -18,406 5,619 -14,235
Year on year % change tonnes CO2 -1% 9% -17% 6% -15%
Annual average change % -1%Introduction 2017/18 Engagement Key findings Looking ahead Appendices 22
Table 2. Total footprint by activity 2012/13-2017/18 – all impacts and all reporting organisations
2012/13 2013/14 2014/15
Nr. orgs Individual Nr. orgs Individual Nr. orgs Individual
Activity Source of impact Tonnes CO2e Tonnes CO2e Tonnes CO2e
reporting reports reporting reports reporting reports
Venues Energy, water, waste and business travel 294 96,822 312 94,938 318 103,454
Offices Energy, water, waste and business travel 234 5,498 234 5,597 238 6,036
Festivals Energy, water, waste 19 227 23 196 22 423
469 474 481
Events Energy and waste 0 - 0 0 0 1.54
Productions Materials 26 26 17 14 22 25
Tours Travel and transport 38 242 33 664 41 707
611 102,815 619 101,409 641 110,647
Total 102,815 101,409 110,645
2015/16 2016/17 2017/18
Nr. orgs Individual Nr. orgs Individual Nr. orgs Individual
Activity Source of impact Tonnes CO2e Tonnes CO2e Tonnes CO2e
reporting reports reporting reports reporting reports
Venues Energy, water, waste and business travel 340 83,965 430 90,492 431 81,063
Offices Energy, water, waste and business travel 337 6,957 369 6,766 356 6,383
Festivals Energy, water, waste 25 678 14 46 13 2
538 623 547
Events Energy and waste 11 2 0 - 0 -
Productions Materials 35 54 14 58 4 1
Tours Travel and transport 54 581 41 496 52 109
802 92,237 868 97,858 856 87,558
Total 92,239 97,858 83,622Introduction 2017/18 Engagement Key findings Looking ahead Appendices 23
Energy use and energy costs
Table 3. Energy use 2012/13-2017/18 – all reporting organisations
2012/13 2013/14 2014/15 2015/16 2016/17 2017/18
Electricity (kWh) 149,492,225 154,803,554 148,088,351 127,673,929 145,276,582 147,396,000
Gas (kWh) 183,582,875 165,100,880 146,844,383 122,224,153 148,775,993 148,297,000
Onsite renewables (kWh) 101,426 193,003 256,177 314,519 1,175,062 1,989,460
Total kWh 333,176,525 320,097,437 295,188,910 250,212,601 295,227,637 297,682,460
Number of organisations 469 474 481 538 623 547
kWh change year on year -13,079,088 -24,908,527 -44,976,309 45,015,036 2,454,823
kWh change 12/13-17/18 -35,494,065
% change 12/13-17/18 -11%
% change 16/17-17/18 1%
Average annual % change -2%
Table 4. Energy use 2012/13-2017/18 – core group11
2012/13 2013/14 2014/15 2015/16 2016/17 2017/18
Electricity (kWh) 101,627,646 100,023,491 98,204,500 93,824,503 93,128,140 84,486,264
Gas (kWh) 110,482,941 96,016,129 88,706,204 101,205,458 91,890,428 78,148,191
Onsite renewables (kWh) 143,101 202,048 169,723 177,824 167,782 386,339
Total kWh 212,253,688 196,241,668 187,080,427 195,207,785 185,186,350 163,020,795
Number of organisations 136 136 136 136 136 136
kWh change year on year -16,012,020 -9,161,241 8,127,357 -10,021,435 -22,165,556
kWh change 12/13-17/18 -49,232,894
% change 12/13-17/18 -23%
% change 16/17-17/18 -12%
Average annual % change -5% 11 Tyneside Cinema was not able to provide energy data this year,
so an assumption has been made based on last year’s dataIntroduction 2017/18 Engagement Key findings Looking ahead Appendices 24
Table 5. Energy use emissions 2012/13-2017/18 – all reporting organisations
2012/13 2013/14 2014/15 2015/16 2016/17 2017/18
Electricity tonnes CO2e 74,168 74,858 79,595 63,882 65,290 51,819
Gas (normalised) tonnes CO2e 25,534 22,818 27,018 22,331 26,509 25,745
Total tonnes CO2e 99,701 97,676 106,613 86,213 91,799 77,564
Number of organisations 469 474 481 538 623 547
CO2e change year on year -2,025 8,936 -20,400 5,587 -14,235
CO2e change 12/13-17/18 -22,137
% change 12/13-17/18 -22%
% change 16/17-17/18 -16%
Average annual % change -4%
Table 6. Energy use emissions 2012/13-2017/18 – core group
2012/13 2013/14 2014/15 2015/16 2016/17 2017/18
Electricity tonnes CO2e 50,421 48,368 52,783 46,945 41,854 29,702
Gas (normalised) tonnes CO2e 17,241 18,254 17,662 19,956 17,707 14,201
Total tonnes CO2e 67,661 66,622 70,445 66,901 59,561 43,903
Number of organisations 136 136 136 136 136 136
CO2e change year on year -1,039 3,823 -3,544 -7,340 -15,657
CO2e change 12/13-17/18 -23,758
% change 12/13-17/18 -35%
% change 16/17-17/18 -26%
Average annual % change -7%Introduction 2017/18 Engagement Key findings Looking ahead Appendices 25
Table 7. Energy costs 2012/13-2017/18 – all reporting organisations
2012/13 2013/14 2014/15 2015/16 2016/17 2017/18
Electricity £ £16,444,145 £17,028,391 £16,289,719 £14,044,132 £15,980,424 £16,213,560
Gas £ £5,507,486 £4,953,026 £4,405,331 £3,666,725 £4,463,280 £4,448,910
Total £ £21,951,631 £21,981,417 £20,695,050 £17,710,857 £20,443,704 £20,662,470
Number of organisations 469 474 481 538 623 547
£ change year on year £29,786 -£1,286,367 -£2,984,193 £2,732,847 £218,766
£ change 12/13-17/18 -£1,289,161
% change 12/13-17/18 -6%
% change 16/17-17/18 1%
Average annual % change -1%
Table 8. Energy costs 2012/13-2017/18 – core group
2012/13 2013/14 2014/15 2015/16 2016/17 2017/18
Electricity £ £11,179,041 £11,002,584 £10,802,495 £10,320,695 £10,244,095 £9,293,489
Gas £ £3,314,488 £2,880,484 £2,661,186 £3,036,164 £2,756,713 £2,344,446
Total £ £14,493,529 £13,883,068 £13,463,681 £13,356,859 £13,000,808 £11,637,935
Number of organisations 136 136 136 136 136 136
£ change year on year -£610,461 -£419,387 -£106,822 -£356,051 -£1,362,873
£ change 12/13-17/18 -£2,855,595
% change 12/13-17/18 -20%
% change 16/17-17/18 -10%
Average annual % change -4%Introduction 2017/18 Engagement Key findings Looking ahead Appendices 26
Table 9. Avoided costs – core group Table 10. Avoided costs – all reporting organisations
Costs based on Costs based on
Business as Business as
5% year-on-year 5% year-on-year
Usual costs with BAU vs. 5% Usual costs with BAU vs. 5%
savings from savings from
2012/13 baseline 2012/13 baseline
2012/13 baseline 2012/13 baseline
2012/13 £14,493,529 £14,493,529 £0 2012/13 £21,951,631 £21,951,631 £0
2013/14 £14,493,529 £13,768,853 £724,676 2013/14 £21,951,631 £20,854,049 £1,097,582
2014/15 £14,493,529 £13,044,176 £1,449,353 2014/15 £21,951,631 £19,756,468 £2,195,163
2015/16 £14,493,529 £12,319,499 £2,174,029 2015/16 £21,951,631 £18,658,886 £3,292,745
2016/17 £14,493,529 £11,594,823 £2,898,706 2016/17 £21,951,631 £17,561,305 £4,390,326
2017/18 £14,493,529 £10,870,147 £3,623,382 2017/18 £21,951,631 £16,463,723 £5,487,908
2018/19 £14,493,529 £10,145,470 £4,348,059 2018/19 £21,951,631 £15,366,142 £6,585,489
2019/20 £14,493,529 £9,420,794 £5,072,735 2019/20 £21,951,631 £14,268,560 £7,683,071
2020/21 £14,493,529 £8,696,118 £5,797,412 2020/21 £21,951,631 £13,170,979 £8,780,652
2021/22 £14,493,529 £7,971,441 £6,522,088 2021/22 £21,951,631 £12,073,397 £9,878,234
2022/23 £14,493,529 £7,246,765 £7,246,765 2022/23 £21,951,631 £10,975,815 £10,975,815
2023/24 £14,493,529 £6,522,088 £7,971,441 2023/24 £21,951,631 £9,878,234 £12,073,397
2024/25 £14,493,529 £5,797,412 £8,696,118 2024/25 £21,951,631 £8,780,652 £13,170,979
2025/26 £14,493,529 £5,072,735 £9,420,794 2025/26 £21,951,631 £7,683,071 £14,268,560
2026/27 £14,493,529 £4,348,059 £10,145,471 2026/27 £21,951,631 £6,585,489 £15,366,142
2027/28 £14,493,529 £3,623,382 £10,870,147 2027/28 £21,951,631 £5,487,908 £16,463,723
2028/29 £14,493,529 £2,898,706 £11,594,823 2028/29 £21,951,631 £4,390,326 £17,561,305
2029/30 £14,493,529 £2,174,029 £12,319,500 2029/30 £21,951,631 £3,292,745 £18,658,886
£260,883,527 £150,008,028 £395,129,358 £227,199,381
Avoided costs 12/13-17/18 £10,870,147 Avoided costs 12/13-17/18 £16,463,723
Avoided costs 12/13-24/25 £56,524,764 Avoided costs 12/13-24/25 £85,611,361
Avoided costs 12/13-29/30 £110,875,499 Avoided costs 12/13-29/30 £167,929,977Introduction 2017/18 Engagement Key findings Looking ahead Appendices 27
Arts Council England
The Hive
49 Lever Street
Manchester
M1 1FN
Email: enquiries@artscouncil.org.uk
Phone: 0161 934 4317
artscouncil.org.uk
@ace_national
Facebook.com/artscouncilofengland
Charity registration number: 1036733
You can get this publication in Braille, in large print, on audio CD
and in electronic formats. Please contact us if you need any of
these formats.
© Arts Council England, November 2018
... ~ --- --
Written, edited and produced by Julie’s Bicycle on behalf of Arts Council
England. We are committed to being open and accessible. We welcome
all comments on our work. Please send these to: Executive Director,
.....
Advocacy & Communications, at the Arts Council England address above.
.
- ..,.
-- -..i:=--
., ':; ~ ~ .__
~,,.,..
...
✓- -:-"!&_,;. .....
-..-~~·
·.('
~ ,
_ +; . ....
,:,_.
Above: Groundwork. Photo © Steve Tanner
_ -. -,-5-
..
·=-
...
·- ; ........
:..--
;.~. "- ..:.You can also read