OPTIMALISASI PENGEMBANGAN ENERGI BARU DAN TERBARUKAN MENUJU KETAHANAN ENERGI BERKELANJUTAN - DPR RI
←
→
Page content transcription
If your browser does not render page correctly, please read the page content below
Komisi Teknis Energi

  OPTIMALISASI PENGEMBANGAN ENERGI BARU DAN
    TERBARUKAN MENUJU KETAHANAN ENERGI
                  BERKELANJUTAN
      Webinar Pusat Perancangan Undang-Undang
                Badan Keahlian DPR RI
                   Senin, 12 Oktober 2020
    MENINGKATKAN TINGKAT PENETRASI VRE UNTUK
MENDUKUNG DEKARBONISASI SEKTOR KETENAGALISTRIKAN
                YANG MENDALAM
          Ir. Hardiv Harris Situmeang, M.Sc., D.Sc.
    Ketua Komisi Teknis Energi – Dewan Riset Nasional (DRN)
Paris Agreement
Global Goal of Keeping Warming Between 2 0C and 1.5 0C

                                   Article 2
1.   This Agreement, in enhancing the implementation of the Convention,
     including its objective, aims to strengthen the global response to the threat
     of climate change, in the context of sustainable development and efforts to
     eradicate poverty, including by:
     a) Holding the increase in the global average temperature to well below 2
           °C above pre-industrial levels and to pursue efforts to limit the
           temperature increase to 1.5 °C above pre-industrial levels, recognizing
           that this would significantly reduce the risks and impacts of climate
           change;
     b) Increasing the ability to adapt to the adverse impacts of climate
           change and foster climate resilience and low greenhouse gas emissions
           development, in a manner that does not threaten food production;
     c) Making finance flows consistent with a pathway towards low
           greenhouse gas emissions and climate-resilient development.
2.   This Agreement will be implemented to reflect equity and the principle of
     common but differentiated responsibilities and respective capabilities, in
     the light of different national circumstances.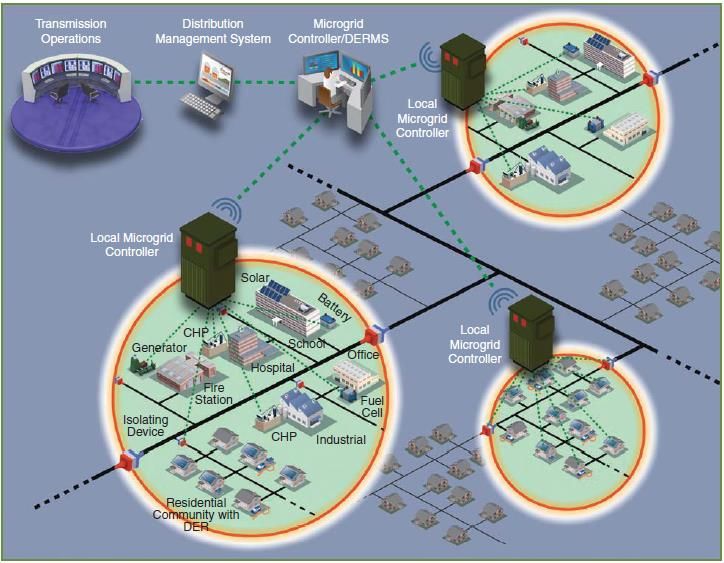
Pasal 2

            Undang-Undang ini mulai berlaku pada tanggal diundangkan.
            Agar setiap orang mengetahuinya, memerintahkan pengundangan
            Undang-Undang ini dengan penempatannya dalam Lembaran Negara
            Republik Indonesia.
                                          Disahkan di Jakarta
                                          pada tanggal 24 Oktober 2016
                                          PRESIDEN REPUBLIK INDONESIA,
                                                        ttd.

                                              JOKO WIDODO

Diundangkan di Jakarta
Pada tanggal 25 Oktober 2016
MENTERI HUKUM DAN HAK ASASI MANUSIA
        REPUBLIK INDONESIA,
                 ttd.

        YASONNA H. LAOLY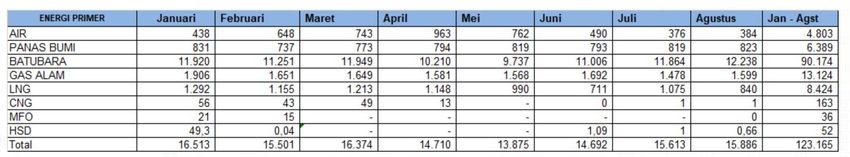
Paris Agreement Article 4 Paragraph 19
            Paris Decision 1/CP.21 Paragraph 35
               Paris Agreement Article 4 Paragraph 19

19. All Parties should strive to formulate and communicate long-term low
greenhouse gas emission development strategies, mindful of Article 2 taking
into account their common but differentiated responsibilities and respective
capabilities, in the light of different national circumstances.
                 Paris Decision 1/CP.21 Paragraph 35

35. Invites Parties to communicate, by 2020, to the secretariat mid-century,
long-term low greenhouse gas emission development strategies in
accordance with Article 4, paragraph 19, of the Agreement, and requests the
secretariat to publish on the UNFCCC website Parties’ low greenhouse gas
emission development strategies as communicated;

                        Indonesia 2050 Long-Term
                      Low Greenhouse Gas Emission
                         Development Strategies
Perlunya
  Dekarbonisasi
Sektor Energi yang
    Mendalam
Characteristic of Post - Third Assessment Report
             Stabilization Scenarios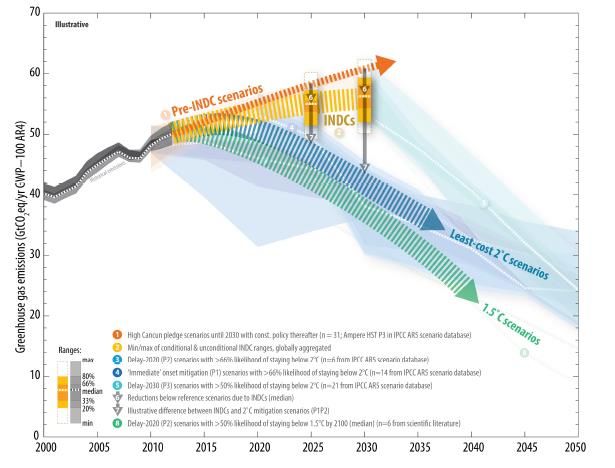
B.5 Carbon and Other Biogeochemical Cycles
 The atmospheric concentrations of carbon dioxide (CO2), methane, and nitrous
 oxide have increased to levels unprecedented in at least the last 800,000 years.
 CO2 concentrations have increased by 40% since pre-industrial times, primarily
 from fossil fuel emissions and secondarily from net land use change emissions.
 The ocean has absorbed about 30% of the emitted anthropogenic carbon
 dioxide, causing ocean acidification (see Figure SPM.4).

                        C. Drivers of Climate Change
 Total radiative forcing is positive, and has led to an uptake of energy by the
 climate system. The largest contribution to total radiative forcing is caused by
 the increase in the atmospheric concentration of CO2 since 1750 (see Figure
 SPM.5). {3.2, Box 3.1, 8.3, 8.5}

               D.3 Detection and Attribution of Climate Change
 Human influence has been detected in warming of the atmosphere and the
 ocean, in changes in the global water cycle, in reductions in snow and ice, in
 global mean sea level rise, and in changes in some climate extremes (Figure
 SPM.6 and Table SPM.1). This evidence for human influence has grown since
 AR4. It is extremely likely that human influence has been the dominant cause of
 the observed warming since the mid-20th century. {10.3–10.6, 10.9}
IPCC WGI AR5                  12th Session of WG I              27 September 2013
Summary for Policymakers
SPM.4 - Mitigation Pathways and Measures in the Context of
Sustainable Development
Scenarios reaching atmospheric concentration levels of about 450
ppm CO2eq by 2100 (consistent with a likely chance to keep
temperature change below 2°C relative to pre-industrial levels)
include substantial cuts in anthropogenic GHG emissions by mid-
century through large-scale changes in energy systems and
potentially land use (high confidence).
Scenarios reaching these concentrations by 2100 are
characterized by lower global GHG emissions in 2050 than in 2010,
40 % to 70 % lower globally, and emissions levels near zero Gt
CO2eq or below in 2100.Scenarios that follow a least-cost emission trajectory from 2010
onwards (so-called P1 scenarios) with a greater than 66 per cent
Global Aggregation
likelihood of temperature rise staying below 2°C correspond to 44.3
(38.2–46.6) Gt CO2eq emissions in 2025 and 42.7 (38.3–43.6) Gt
CO2eq emissions in 2030.
Global GHG emissions in GtCO2eq
Global GHG emissions path
compatible with 20C
Gap
40-70% below 2010 levels by 2050
Emissions levels near zero
GtCO2eq, or below in 2100
2015 2020 2025 2030 2050 2100
1) Strongly Required: Pre-2020 and Post-2020 actions reinforce each other and in the same direction of higher
ambition.
2) Scenarios that follow a least-cost emission trajectory from 2010 onwards (so-called P1 scenarios) with a greater
than 66 per cent likelihood of temperature rise staying below 2°C correspond to 44.3 (38.2–46.6) Gt CO2eq
emissions in 2025 and 42.7 (38.3–43.6) Gt CO2eq emissions in 2030.2 Degree Celsius is Attainable?
Cancun Beach, 8 December 2010Aggregate Effect of the Intended Nationally Determined
Contributions: An Update
Synthesis Report by the UNFCCC Secretariat
FCCC/CP/2016/2 – 2 May 2016Aggregate Effect of the INDC: An Update
Synthesis report by the Secretariat - FCCC/CP/2016/2
Report - 02 May 2016
The UN Climate Change Secretariat has published an update to its
synthesis report on the collective impact of national climate action
plans (Intended Nationally Determined Contributions, or INDCs),
submitted by governments as contributions to global climate action
under the Paris Agreement.
Since the publication last October of the 1st synthesis report
prepared ahead of the Paris Climate Change Conference, 42
additional countries submitted their INDCs. The updated report now
captures the overall impact of 161 national climate plans covering
189 countries and covering 95.7% of total global emissions. (The
European Union and its 28 member States submit a joint INDC.)
There are 137 of the 161 INDCs (85%) which include an adaptation
component, reflecting a common determination of governments to
strengthen national adaptation efforts.
INDCs are expected to deliver sizeable emission reductions and slow
down emissions growth in the coming decade. However, these are
still not enough to keep the global temperature rise since pre-
industrial times to below 2, or preferably 1.5 degrees Celsius.Comparison of Global Emission Levels in 2025 and 2030 Resulting
from the Implementation of the INDC and under Other Scenarios
Sources: Intergovernmental Panel on Climate Change (IPCC) Fifth Assessment Report scenario database, 1.5 °C scenarios from scientific
literature (see footnote 18), IPCC historical emission database and intended nationally determined contribution quantification.
Abbreviations: AR4 = Fourth Assessment Report of the Intergovernmental Panel on Climate Change, GWP = global warming potential,
INDC = intended nationally determined contribution, IPCC AR5 = Fifth Assessment Report of the Intergovernmental Panel on Climate
Change, n = number of scenarios, yr = year.Figure ES.2 Global GHG emissions under different scenarios and the emissions gap in 2030 (median estimate and 10th to 90th percentile range). Emission Reduction Options and Potential in the Energy Sector In the current policy scenario, energy sector emissions amount to 21.3 GtCO2 in 2030, of which 16.3 GtCO2 comes from power generation (IEA, 2016, USEPA, 2012). Main options for reducing emissions in the energy sector are wind and solar energy. In addition, hydro, nuclear, geothermal, carbon capture and storage (CCS) and bioenergy combined with CCS can contribute.
Global GHG Emissions Under Different Scenarios & the
              Emissions Gap in 2030
SINGAPORE’S INTENDED NATIONALLY DETERMINED
CONTRIBUTION (INDC)
In accordance with Decisions 1/CP.19 and 1/CP.20, Singapore communicates
that it intends to reduce its Emissions Intensity by 36% from 2005 levels by
2030, and stabilise its emissions with the aim of peaking around 2030.
Singapore’s Efforts. While Singapore is heavily dependent on fossil fuels,
given its severe limitations on using alternative energy, Singapore had made
early policy choices to reduce its GHG footprint by switching from fuel oil to
natural gas, the cleanest form of fossil fuel, for electricity generation, even
though it meant higher cost. Today, over 90% of electricity is generated
from natural gas. Singapore prices energy at market cost, without any
subsidy, to reflect resource scarcity and promote judicious usage. On top of
this, and despite the challenges, the government is significantly increasing
the deployment of solar photovoltaic (PV) systems.
Singapore intends to reduce its Emissions
Intensity 36% below 2005 levels by 2030, and
aims to achieve emissions peak around 2030.List of Countries Committed to a Net-Zero Emissions Goal
Country Target Date Status
Bhutan Currently Carbon Pledged towards the Paris
Negative Agreement
Canada 2050 Will propose to Parliament
Chile 2050 In Policy Document
Costa Rica 2050 In Policy Document
Denmark 2050 In Policy Document
European Union 2050 Under Discussion
Fiji 2050 Pledged towards the Paris
Agreement
Finland 2035 In Policy Document
France 2050 In Law
Germany 2050 Under Discussion
Iceland 2040 In Policy Document
Ireland 2050 Under Discussion
Sources: i) World Economic Forum, 05 July 2019; and ii) 2019 Climate Home News Ltd., 14 June 2019.List of Countries Committed to a Net-Zero Emissions Goal
Country Target Date Status
Japan 2050 Policy Position
Marshall Islands 2050 Pledged towards the Paris
Agreement
New Zealand 2050 The Bill was Passed
Norway 2030 In Law
Portugal 2050 In Policy Document
Sweden 2045 In Law
Spain 2050 Proposed Legislation
The Netherlands 2050 Under Discussion
United Kingdom 2050 In Law
Uruguay 2030 In Policy Document
Sources: i) World Economic Forum, 05 July 2019; and ii) 2019 Climate Home News Ltd., 14 June 2019.
China: Peak CO2 emissions before 2030 and reach carbon neutrality before
2060.
Source: Ranping Song, “4 Questions About China’s New Climate Commitments”, WRI, September 2020.ENERGY TRANSITION IN CONSUMPTION SECTORS
• Buildings and neighbourhoods
• Industry, commerce, trade and services
• Interfaces of energy research with mobility and transport
POWER GENERATION
• Photovoltaics
• Wind power
• Bioenergy
• Geothermal
The 7th Energy • Hydropower and marine energy
Research • Thermal power plants
Programme of SYSTEM INTEGRATION: GRIDS, ENERGY STORAGE, SECTOR COUPLING
• Electricity grid
the German • Electrical energy storage
Federal • Sector coupling
Government CROSS-SYSTEM RESEARCH TOPICS FOR THE ENERGY TRANSITION
• Energy system analysis
• Digitisation of the energy transition
• Resource efficient for the energy transition
• CO2 technologies for the energy transition
• Energy transition and society
• Materials research for the energy transition
NUCLEAR SAFETY RESEARCH
• Reactor safety research
• Waste management and repository research
• Radiation researchSource: Ernst & Young (EY), “COVID-19 crisis management for P&U companies”.
VISI "TERWUJUDNYA PENGELOLAAN ENERGI YANG
BERKEADILAN, BERKELANJUTAN, DAN BERWAWASAN
LINGKUNGAN DENGAN MEMPRlORITASKAN
PENGEMBANGAN ENERGI TERBARUKAN DAN KONSERVASI
ENERGI DALAM RANGKA MEWUJUDKAN KEMANDIRIAN DAN
KETAHANAN ENERGI NASIONAL”
Rencana Umum Energi Nasional
National Energy Mix up to 2050
Emisi GRK Tahun 2015-2050
Penurunan Emisi GRK Tahun 2015-2050National Energy Mix Menuju 2050
Emisi GRK Tahun 2015-2050

Sektor pembangkit listrik diproyeksikan akan menjadi penyumbang emisi terbesar, diikuti oleh
sektor industri dan sektor transportasi. Proyeksi emisi GRK pada tahun 2025 sebesar 893 juta ton C02eq
dan tahun 2050 sebesar 1,950 juta ton C02eq, sebagaimana dapat dilihat pada gambar diatas.

Hasil pemodelan pencapaian sasaran KEN akan memberikan dampak penurunan GRK secara signifikan
apabila dibandingkan dengan Business as Usual (BAU). Penurunan emisi GRK tahun 2025 sebesar 34,8%
dan pada tahun 2050 sebesar 58,3%, sebagaimana dapat dilihat pada slide berikutnya.
Penurunan Emisi GRK Tahun 2015-2050

    Sebagaimana yang
 dinyatakan pada RUEN
yang terbaru, penurunan
 emisi GRK dalam RUEN
  sudah sejalan dengan
 Nationally Determined
    Contribution (NDC)
 Indonesia sebesar 29%
  pada tahun 2030 yang
 merupakan bagian dari
   komitmen Indonesia
untuk turut mendukung
   upaya pengendalian
peningkatan suhu global
 rata-rata di bawah 2°C.

Penurunan emisi GRK disebabkan oleh empat faktor: (1). Diversifikasi energi, dengan meningkatkan
porsi energi terbarukan dan mengurangi porsi energi fosil; (2). Pemanfaatan teknologi batubara bersih
(clean coal technology) untuk pembangkitan tenaga listrik; (3). Substitusi penggunaan energi dari BBM
ke gas bumi; dan (4). Pelaksanaan program konservasi energi pada tahun-tahun mendatang. Penurunan
emisi GRK dalam RUEN sudah sejalan dengan Nationally Determined Contribution (NDC) Indonesia
sebesar 29% pada tahun 2030 yang merupakan bagian dari komitmen Indonesia untuk turut
mendukung upaya pengendalian peningkatan suhu global rata-rata di bawah 2°C.
Energy Mix Bulan Desember 2019
Sumber Data : Data ROT & Data Transaksi TRATL P2B
*) Data BBM diluar pemakaian BBM akibat pengoperasian PLTDG PESANGGARAN
www.pln.co.id |Energy Mix Bulan Januari 2020
Sumber Data : Data ROT & Data Transaksi TRATL P2B
*) Data BBM diluar pemakaian BBM akibat pengoperasian PLTDG PESANGGARAN
www.pln.co.id |Energy Mix Bulan Juni 2020
Sumber Data : Data ROT & Data Transaksi TRATL P2B
*) Data BBM diluar pemakaian BBM akibat pengoperasian PLTDG PESANGGARAN
www.pln.co.id |Energi Mix SJB Januari sd Agustus 2020
www.pln.co.id |To establish deep decarbonization
pathway particularly for energy sector in
supporting the strategic review of NDC to
achieve the national emissions reduction
target, one of the key required actions:
Strongly Required
Deep Decarbonization of
Energy Sector
Deployment of low-carbon & zero-carbon
energy technologies and renewable
energy; greater role of energy efficiency &
conservation from up-stream to down-
stream (energy end-use - provide efficient
transmission and distribution systems);
Energy
and move the energy system towards
using low-carbon energy sources (fuel Sector
switching) to improve national energy mix
for its associated sectors (power,
transport, industry, building, and
households, etc.) to be imbedded in the
long-term national energy program.Meningkatkan Tingkat
Penetrasi VRE ke Sistem
Tenaga Listrik
[Associated Key Issues &
Challenges in Moving
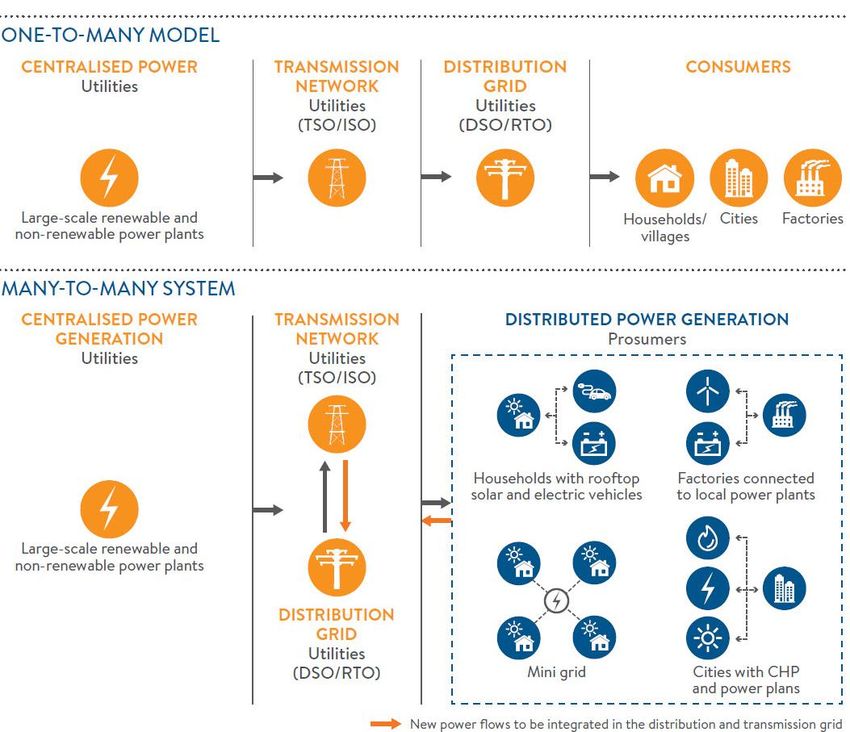
Forward]Three Trends Driving Transition
in Global Energy Sector Decarbonisation with the
[ Tiga D ] shift towards lower-carbon
The global electricity sector is undergoing a large-scale energy generation and use. This
transition, marked by 3 (three) inter-related and reinforcing is marked by a growth in
trends impacting demand and supply of energy: natural gas (playing a bridging
role), and renewables in energy
supply and generation,
particularly in distributed
generation, as well as
electrification of the mobility
sector.
Digitalisation supported by the
increase in information and
communication technologies and
the overall shift to an ‘internet of
things’ that enables smart grids
and optimized energy use and Decentralisation marked by the greater
storage, greater efficiency and the adoption and availability of a distributed energy
integration of distributed energy resources including new distributed generation
resources, especially distributed sources, developments in energy storage, new
generation. market entrants and shifting consumer
preferences.Evolution of the Electricity System
Contoh Perkembangan Sistem Tenagalistrik
Key Properties of Variable Renewable Energy (VRE)
         and Its Associated Challenges1)
                                           Generation / resources
Weather-dependent nature -                adequacy - firm capacity
        Variability
                                          Need flexible resources /
                                                  flexibility
 Uncertainty in forecast -
                                               Voltage control
   Low predictability
                                           Efficient grid expansion
                                            with appropriate level
  Location constrained -
                                                   capacity
    Specific location
                                             Stability / frequency &
  Can be as distributed
                                               voltage response
generation - Not connected                (is influenced by “system
     to transmission                        inertia”), and harmonic
                                                    distortion

 Non-synchronous power                     System operations &
        sources                          controls at the distribution
                                                    level

                  Please see other big challenges.
Key Links Between VRE, Power System Properties
and Planning1)The CAISO Duck Chart *)Source: Paul Denholm, Matthew O'Connell, Gregory Brinkman, and Jennie Jorgenson, “Overgeneration from Solar Energy in California: A Field Guide to the Duck Chart”, NREL Technical Report, NREL/TP-6A20-65023, November 2015.
Background: Why Ducks Lead to Overgeneration*)

The CAISO duck chart itself illustrates the general challenge of
accommodating solar energy and the potential for over generation and solar
curtailment. In the chart, each line represents the net load, equal to the
normal load minus wind and PV generation. The “belly” of the duck
represents the period of lowest net load, where PV generation is at a
maximum. The belly grows as PV installations increase between 2012 and
2020. While the amount of PV in 2020 is not shown directly, it can be
estimated by comparing the 2012 curve to the 2020 curve. In this case, the
normal load (i.e., no PV and adjustments for load growth) at about 1-2 p.m.
on March 31, 2020 appears to be about 22,000 megawatts (MW), while PV is
generating about 10,000 MW, leaving about 12,000 MW to be met with other
resources. In this case, PV provides perhaps 45% of the total demand in this
one hour. The duck chart also points to the period of over generation risk,
which could result in curtailed energy.

*) Source: Paul Denholm, Matthew O'Connell, Gregory Brinkman, and Jennie Jorgenson, “Overgeneration
from Solar Energy in California: A Field Guide to the Duck Chart”, NREL Technical Report, NREL/TP-6A20-
65023, November 2015.
5 Key Technical Parameters that Determine
          the Flexibility of Dispatchable Plants1)

1.   The ramp rate (or ramping gradient) of a power plant: the rate
     at which a generator can change its output (in MW/timeframe,
     e.g., minute or hour).
2.   Start-up times: the time required for power to start up. Cold,
     warm and hot starts are distinguished depending on how long
     a power plant has been down.
3.   Minimum load levels: the minimum generation at which a
     power plant can be operated stably before it needs to be shut
     down. A plant can adjust its output between this and its rated
     capacity.
4.   Minimum down and up times: the lower limits of the time that
     a plant needs to be offline or online. In principle, these are
     not strict technical limits, but are supporting guidelines to
     avoid wear and tear that leads to high costs over the lifetime
     of a power plant.
5.   Partial load efficiency: the reduced efficiency of a power
     plant operated below its rated capacity.
Langgam Beban Kerja April 2020 VS 2019
www.pln.co.id |4 Basic Models for Industry Structure2,3)
Key Items Model 1 Model 2 Model 3 Model 4
Vertically Integrated Single Buyer Wholesale Retail Competition
Characteristic Monopoly Competition
Monopoly at all Competition in Competition in Competition in
Definition levels generation generation and generation and
choice for DITSCOs choice for final
consumers
Competing Tidak Ya Ya Ya
Generators
Choice for Tidak Tidak Ya Ya
Retailers?
Choice for Final Tidak Tidak Tidak Ya
Customers?
• No one may buy from • Only the existing • DITSCOs are given • Permits all
independent integrated the right to buy customers to choose
generator. monopoly in the direct from IPPs, but their suppliers & are
• All final customers assigned area is they retain a local given the right to
Note are supplied by the permitted to buy franchise over buy from IPP.
incumbent utility from IPP (the retailers customers. • Access to
competing • IPP will need access transmission and
generators). to the transmission distribution
• The design of network through network are
PPAs is a major trading arrangement required.
feature. for the network. Sequence of Main Tasks Principal States of Power System Operation
DEKARBONISASI JANGKA PANJANG YANG MENDALAM
   TETAP MEMENUHI KESEIMBANGAN PASOKAN DAN
PERMINTAAN SERTA MENJAMIN PEMENUHAN PILAR UTAMA

                              (1) Ensuring

                      Security
      Reliability                      Resilience         Quality
                    (Keamanan
     (Keandalan)                      (Ketahanan)         (Mutu)
                     Pasokan)

                          OBJECTIVES
                     (TUJUAN TERINTEGRASI)

    (2) Maximizing Economic
                                             (3) Clean Electricity to
    Value & Consumer Equity
                                             Support Environmental
         (Accessibility &
                                                  Sustainability
          Affordability)
Planning the transition to a power system with high share
low-carbon & zero-carbon energy technologies and RE
Sequence of
including VRE under techno-economic assessment. Main Tasks
Pre-Construction
Pre-Operational
Construction
Pre-Decision
Operational
Phase
Phase
Phase
Phase
Phase
Decision
Phase
Ensuring System
Planning Reliability, Security,
Phase Resilience & Quality
Clean Electricity to Maximizing Economic Value &
Support Environmental Consumer Equity (Accessibility
Sustainability & Affordability)Wind, Solar potential Primary Energy data: Primary energy data:
map Hydro; Geothermal; Etc. Gas, Coal, Oil
Candidates of VRE Candidates of RE Candidates of
(intermittent power projects Thermal projects
generation) projects
(RE): Solar, Wind
Generation expansion Demand forecast;
plan and transmission / Daily load curve
Existing generation
and transmission network expansion plan Scenarios
systems (geo-spatial) Planning criteria
Policy, Financial Generation productions
constraints allocation and costs Proposed investment
plan, financing projection
& financing plan / funding
Optimal power flow and requirement.
static security assessment
Dynamic security Further economic study
assessment (Tariff)
System Planning Process
Investment plan
(Hanya Sebagai Contoh General Practice)Characteristics of Selected Long-term Power Sector
Planning Tools1)Model Scenarios*)
[Hanya Sebagai Contoh]
Carbon Tax New Technology Scenario
Scenario • Twenty likely and speculative new technologies using
• Various carbon taxes coal and gas were added to the Base scenario for
(13,25,50,75 $/tCO2) were application within the lifetime considered in the model
imposed for both the Base • CCS was included within these new technologies
scenario and the New variants.
Technology scenario.
• Effect of carbon tax was Base Scenario
analyzed when lower • Only technologies either
generation limit was set on
SCENARIOS current in 2005 or included in
coal-fired power plant the National Electricity Plan
were included
• Current trend for renewables
Total Carbon Emission Cap Scenario introduction was reflected in
the model
Various total carbon emission caps (120%, 100%, 80%,60% • Constraints for some
compared to the 2004 level) were imposed on the Base technologies were set
scenario and New Technology scenario. Effect of total according to the resource limit
carbon emission cap was analyzed when lower generation and the geographical limit
limit set set on coal-fired power plant
*)Source: Andrew J Minchener, “The Korean Energy Strategy Project”, IEA CCC/133, April 2008.Tahap Pra-Operasional Tahap Operasional
• Load Forecast • Hourly – short term (on line) load forecast
• VRE power supply forecast • Hourly – short term (on line) VRE power
• Net load forecast supply forecast
• Generations maintenance scheduling • Net load
• Transmissions maintenance scheduling • Static and dynamic security assessment
• Generations unit scheduling • Contingency & congestion analysis
• Optimal fuel use and scheduling • Optimal power flow
• Static and dynamic security assessment • Balancing system
• Optimal power flow • Preventive, corrective, emergency and
• Balancing system restorative actions and controls
Rencana Operasi Triwulanan
Rencana Operasi Tahunan
Rencana Operasi Mingguan
Rencana Operasi Harian
Kontinuitas sistem operasi real time
Rencana Operasi Bulanan
5 (Five) Years Statement
dan tetap menjaga keandalan, sekuriti
(keamanan), optimal, dan kualitas
standar keseimbangan pasokan &
beban (kebutuhan)
Tugas Utama
Perencanaan Operasi
Sistem, Operasi Sistem
& Kontrol.
+
Ramah Lingkungan
(Clean)Principal States of Power System Operation4)
Operasi sistem dapat digambarkan (describe) oleh 3 (tiga) set persamaan generik, yaitu:
(i) 1 set persamaan diferensial, dan (ii) 2 (dua) set persamaan aljabar, yaitu: (a) E (equality
constraints), dimana keseimbangan daya aktif dan reaktif pada setiap bus (node), dan (b)
I (inequality constraints) batasan kondisi operasi dari berbagai komponen sistem, seperti
tegangan dan arus tidak boleh melebihi batasan maksimumnya.
Sebagaimana yang dideskripsikan pada slide selanjutnya, ada 5 (lima) kondisi operasi
sistem tenaga listrik yaitu:
(1) Kondisi Normal: semua E (equality constraints) & I (inequality constraints) serta N-1
terpenuhi;
(2) Kondisi Siaga (Alert): semua E (equality constraints) & I (inequality constraints)
terpenuhi, namun N-1 tidak;
(3) Kondisi Darurat (Emergency): semua E (equality constraints) dapat terpenuhi, paling
tidak ada satu I (inequality constraints) yang tidak terpenuhi disebabkan oleh
adanya gangguan;
(4) Kondisi Ekstrim (In Extremis): pada kondisi ini kedua E (equality constraints) dan I
(inequality constraints) tidak terpenuhi (violated); dan
(5) Kondisi Pemulihan (Restorative): merupakan kondisi transisi dimana I (inequality
constraints) terpenuhi dari tindakan pengendalian darurat yang dilaksanakan, tetapi
E (equality constraints) belum terpenuhi.
*) Fink & Carlsen, “Operating under stress and strain”, IEEE Spectrum, March 1978.Principal States of Power System Operation
Pengendalian
Pengendalian Pencegahan
Pemulihan Kondisi Normal
[N-1 terpenuhi] Reduction in
E, I reserve margin
Pengendalian Pengendalian
Kondisi Darurat Perbaikan Kondisi Siaga
Pemulihan [N-1 tidak terpenuhi]
E, I E, I
Kondisi
Darurat
E, I
Gangguan Meluas (Cascading
Outage): system splitting dan
In Extremis Action atau load loss (large block).
(Resynchronization) Kondisi
Ekstrim
E, I
E: Equality Constraints.
Proses transisi sehubungan dengan gangguan. E: Equality Constraint Not Satisfied.
Proses transisi sehubungan dengan tindakan I : Inequality Constraints.
pengendalian. I : Inequality Constraints Not SatisfiedBalancing Act - Associated Key Issues Potential reliability impacts of distributed resources (potential reliability concerns)5) : (i) visibility & controllability of distributed energy resources and the potential effects on forecast load; (ii) the ramping and variability of certain distributed energy resources and the resulting impacts on the base load and cycling generation; (iii) the ability to control reactive power; (iv) low-voltage ride-through (LVRT) and low- frequency ride-through and coordination with IEEE Standard 1547; (v) under- frequency load shedding (UFLS) and under voltage load shedding (UVLS). Operating consideration of integrating variable generation – Associated tasks related to bulk power system operation activities: (i) forecasting techniques must be incorporated into day-to-day operational planning and real-time operations routine and practice, including unit commitment and dispatch; (ii) the impact of securing ancillary services through larger balancing areas or participation in wider-area balancing management on bulk power system reliability must be investigated; (iii) operating practices, procedures, and tools will need to be enhanced and modified. Some of recommended key elements to improve the integration of variable resources – To be operating practices, procedures, and tools (standard): (i) disturbance control performance; (ii) automatic generation control requirement; (iii) communication and coordination; (iv) capacity and energy emergencies; (v) reliability coordination, current-day operations; (vi) normal operating planning; (vii) monitoring system condition.
Microgrid dan Microgrid Controller DMS Integration with Microgrid Controllers / DERMS
Contoh Komponen Microgrid6)
            Central
          Power Plant

                HV
                            Residensial                           Komersial
                               Smart                        Demand         Electrical
                             Appliances                     Response        Storage
  Wind
  Farms
                             Residential         Solar              Office             Solar
                             Homes (LV)         Panels             Buildings          Panels

                  Gardu                                    MV
Renewable         Induk
  Energy
                             Electrical    Distributed       Wind              Active Distribution
                              Storage      Generation       Turbines             Management

  Solar
                            Distributed Generation & Storage (DER)
  Farms
                  Gardu
                  Induk
                             Industrial           Distributed          Demand
                               Plant              Generation           Response
                                                                                       Active
                                                                                 Distribution Grid
                                                  Industrial
Contoh Arsitektur Fisik Microgrid7)
Microgrid
Central Controller
P, Q, V, C
P, Q, V, C
=
~ PV
=
~
DLR
P, Q, V, C
= Storage
~
Diesel Smart EV
Generator AppliancesSmart Grid in Microgrid Kantor Gubernur Bali
Smart Microgrid Controller
: Energy Flow
- SCADA - : Measurement
: Control Instructions
20kV/380V
(P,Q,V,I)
(ON/OFF) (P,Q,V,I)
(P,Q,V,I)
(ON/OFF) (ON/OFF)
Generator Photovoltaic
Diesel Kapasitas 158
275 kVA kWp
(P,Q,V,I)
(P,Q,V,I)
(ON/OFF) (ON/OFF)
Baterai
Priority Load
Kapasitas 224
kVAhImpact of Inverter Based Generation on Bulk Power System
Dynamics and Short-Circuit Performance
[Key Associated Issues]
Synchronous ac rotating Inverter-based resources
machine (IBR) technologies
Electric power grids around the world are undergoing
a significant change in generation mix.
Large System Impact Issues Related to Protective Relay Issues Related to Large
Penetration of Inverter Based Resources Penetration of Inverter Based Resources
1. Voltage-Control/Reactive Support 1. Inverter-Based Fault Currents and
2. Frequency Response and Control Voltage
3. Low-Short Circuit-Levels 2. Relay Element Response to Inverter-
Based Fault Current and Voltage
4. Control and Grid Interactions
3. Relay Scheme Selection Issues Caused
5. Planning Process by Inverter-Based Resources (IBR)
6. Modeling 4. Short Circuit Issues Caused by IBR
7. Operations / Economic Issues 5. Protection and Control (PRC) Reliability
8. Etc. Standards Issues Caused by IBR
Source: IEEE Power & Energy Society, “Impact of Inverter Based Generation on Bulk Power System Dynamics and
Short-Circuit Performance”, Technical Report, PES-TR68, July 2018.The Functional Use Cases of Microgrid Controllers6)
[Contoh]
Frequency Control
Voltage Control
Grid Connected to Islanding Transition: Intentionally
Islanding Transition
Islanding to grid Connected Transition: Unintentionally
Islanding Transition
Islanding to Grid-Connected Transition: Resynchronization
and Reconnection
Energy Management: Grid Connected and Islanding
Microgrid Protection
Ancillary Services: Grid Connected
Microgrid Black Start
Microgrid User Interface and Data ManagementIsu Utama Terkait for
Moving Forward8) Definisi / scope dan general features.
Struktur & Operasi Komponen dan perlengkapan terkait.
Microgrid Tipe / jenis microgrids.
Fungsi microgrid dan manfaat.
Microgrid control system requirements.
Struktur Sistem Kontrol & Microgrid control system function.
Operasi Microgrid
Struktur sistem kontrol microgrid.
Standardization benefits & activities.
Standard requirement.
Standarisasi Fungsi
Sistem Kontrol Microgrid Standardization process.
Scope of a standardized functional
specification.
Spesifikasi Fungsional Identifikasi fungsi utama sistem kontrol.
Sistem Kontrol Microgrid Spesifikasi fungsi utama.
Requirements for conformance testing.
Testing dari Fungsi Utama
Approach dan protocols yang
dipergunakan.A Grid Interactive Microgrid Controller For Resilient
Communities9)
DERMS: Distributed
energy resource
management
Source: Arindam Maitra, Annabelle Prat, Tanguy Hubert, Dean Weng, Kamaguru Prabakar, Rachna Handa, Murali Baggu,
& Mark Mc Granaghan, “Microgrid Controllers”, IEEE Power & Energy Magazine, Vol. 15, No. 4, July/August 2017.Big Challenges
Participate in emergency state
as a part of online emergency
Participate in optimal power actions to stabilize the
flow of interconnected system. interconnected power system in
emergencies.Utility Architecture View with Layered
Decomposition Coordination
Interoperability
Source: GRID Modernization Laboratory Consortium U.S. DOE, “Interoperability
Strategic Vision”, GMLC White Paper, March 2018INTEROPERABILITY
The ability of two or more systems or components to exchange
information and to use the information that has been exchanged.
VALUE OF INTEROPERABILITY
Reduces the cost and effort for system integration
Improves grid performance and efficiency
Facilitates more comprehensive grid security and cybersecurity
practices
Increases customer choice and participation
Establishes industry-wide best practices
It is a catalyst of innovationLocal Microgrid
Distribution Controller # 3
Management System
- DSO - ?
?
Microgrid # 3
? ?
Transmission
Operations Microgrid
- TSO - Controller/DERMS
Microgrid # 2
?
Local Microgrid
? ?
System
Operations Controller # 1 Local Microgrid
- ISO - Controller # 2
?
KEY ISSUES
Microgrid # 1 Utility System Architecture
DER to Microgrid
Controllers/DERMS
Interactive System DMS Integration with
Microgrid Controllers/DERMS
ISO - TSO - DMS/DSO - Microgrid
ISO-TSO & DSO Interfacing
Controllers/DERMSAssociated Key Issues & Challenges in Moving Forward
Sangat dibutuhkan beberapa kegiatan utama dalam membangun jalur
dekarbonisasi jangka panjang sektor ketenagalistrikan yang mendalam
untuk percepatan transisi energi dalam mencapai sistem energi national
jangka panjang rendah karbon yang berkelanjutan dan mendukung NDCs
dalam mencapai target pengurangan emisi nasional mendukung
pencapaian tujuan global Persetujuan Paris, dimana setidaknya selaras
dengan lintasan emisi biaya paling rendah dari kenaikan suhu tetap di
bawah 2°C (a least-cost emission trajectory of temperature rise staying
below 2°C), dengan tujuan dan memenuhi pilar utama (1) Keandalan
(reliability), keamanan pasokan (security), ketahanan (resilience), mutu
(quality); (2) Harga yang terjangkau, kompetitif, aksesibilitas, ekonomis,
memperkuat daya saing industri, dan mendukung pembangunan yang
berkelanjutan; dan (3) Pasokan tenaga listrik yang berkelanjutan yang
bersih-ramah lingkungan (clean electricity supply).

DEKARBONISASI SEKTOR KETENAGALISTRIKAN YANG MENDALAM

             Meningkatkan Tingkat Penetrasi VRE
ke Sistem Tenaga Listrik Peningkatan tingkat kemampuan fleksibilitas sistem dengan penyediaan fasilitas demand response, energy storage: pump-storage hydro, batteries, ekspansi jaringan transmisi & distribusi dan komponen terkait dari integrasi jaringan interkonesi sistem tenaga listrik (grid-interconnected power system); Peningkatan tingkat digitalisasi untuk pertukaran informasi (exchange information) & aplikasi data, dan pengintegrasian interaksi kontrol sistem untuk mendukung peningkatan desentralisasi sistem pembangkitan dalam peningkatan integrasi variabel energi terbarukan ke integrasi jaringan interkoneksi sistem tenaga listrik untuk pemanfaatan potensinya dalam pengendalian operasi sistem tenaga listrik pada kondisi operasi: (a) Normal; (b) Siaga; (c) Darurat; dan (d) Pemulihan. Cakupan komposisi arsitektur kontrol/koordinasi (control/coordination architectures) terkaitnya terdiri dari: (i) Coordination interaction sistem kontrol lokal jaringan mikro dari sumber energi tersebar (local microgrid controllers of distributed energy resources-DERs) dengan sistem kontrol jaringan mikro/sistem manajemen sumber energi tersebar (microgrid controller/distributed energy resources management system-DERMS), (ii) Coordination interaction sistem manajemen sumber energi tersebar (DERMS) dengan sistem manajemen distribusi (distribution management system-DMS), (iii) Coordination interaction sistem manajemen distribusi-unit pengatur sistem distribusi (DMS-DSO) dengan pusat pengatur beban independen (ISO) & unit pengelola sistem transmisi (TSO).
Memperhitungkan/mempertimbangkan: (a) Tingkat kemampuan fleksibilitas sistem yang selaras untuk mendukung penetrasi variabel energi terbarukan yang lebih tinggi (higher flexibility requirements for higher renewable energy penetration); (b) Adanya kemungkinan tidak dipergunakan/tidak dioperasikan lebih lanjut PLTU Batubara yang ada (stranded assets of existing coal-based power plants); (c) Adanya potensi memodifikasi PLTU Batubara yang ada menjadi pembangkit listrik yang lebih fleksibel berdasarkan efektivitas biaya dan tingkat kelayakan ekonominya (converting the existing coal fired power plants into flexible power plants based cost effectiveness and economic viability); (d) Dampak ekonomi-makro (macro-economic impact), (e) Kemungkinan adanya resiko keuangan (financial risk) dengan adanya kondisi kewajiban keuangan yang masih berlangsung (adanya take or pay), dan biaya sosial yang ada (existing financial obligations, and social costs). Perlu ditinjau/dikaji kembali (review) dan diselaraskan (enhance) lebih lanjut: (i) Rencana operasi sistem tahap pra-operasional dan tahap operasional; (ii) Operasi sistem real-time & kontrol yang tetap menjaga dan mempertahankan terjaminnya keandalan, sekuriti/kestabilan sistem (static & dynamic), optimal- ekonomis, mutu/kualitas, keseimbangan pasokan & beban, dan pemenuhan alokasi emisi: (a) sistem peramalan (prakiraan) beban jangka pendek (tergantung jangka waktu yang dibutuhkan) - setiap jam yang dilaksanakan on-line dan off-line, (b) analisa static & dynamic security yang secara regular dilaksanakan on-line dan off-line,
(c) analisa kontingensi (on-line dan off-line), (d) pre-dispatch, optimalisasi sistem (optimal power flow), (e) real-time dispatch, (f) balancing system, (g) pengendalian pencegahan, perbaikan, darurat dan pemulihan; (iii) Sistem komunikasi, kontrol, pelaporan & pemantauan; (iv) Sistem pengukuran (metering system); (v) Manajemen / pengelolaan aset; (vi) Standar teknis untuk aplikasi koneksi (connection applications); (vii) Peningkatan penetrasi/perluasan penerapan variabel energi terbarukan tersebar. The utility system architecture dan reformasi sistem kelistrikan dibutuhkan untuk mendukung implementasi manajemen dan kontrol operasionalisasi integrasi jaringan interkoneksi sistem tenaga listrik (to support implementation approach to integrated grid-interconnected power system management and control), yaitu: (i) Control center designs (model pusat pengendalian) yang sesuai dengan fungsi dan tantangan yang baru (under new functions and challenges) untuk ISO-TSO, dan DMS-DSO; dan (ii) Sistem interaktif sebagai coordination interactions: (a) sistem kontrol lokal jaringan mikro dari sumber energi tersebar dengan sistem kontrol jaringan mikro/sistem manajemen sumber energi tersebar (DERMS), (b) integrasi DMS-DSO dengan sistem kontrol jaringan mikro/sistem manajemen sumber energi tersebar (DERMS), dan (c) ISO-TSO dan DMS-DSO.
Dibutuhkan penyediaan fasilitas interoperabilitas sistem untuk mendukung operasi sistem real-time & kontrol yang tetap menjaga dan mempertahankan terjaminnya keandalan, sekuriti/kestabilan sistem (static & dynamic), optimal-ekonomis, mutu/kualitas, keseimbangan pasokan & beban, dan pemenuhan alokasi emisi, misalnya penggunaannya untuk: (i) optimalisasi sistem (aliran daya yang optimal) dari integrasi jaringan interkoneksi sistem, dan (ii) pengendalian darurat online pada kondisi darurat untuk menstabilkan kondisi operasi sistem kembali ke kondisi normal. Identifikasi reformasi sistem kelistrikan termasuk pasar/market yang dibutuhkan, model struktur, kebijakan dan kerangka kerja terkait, peraturan yang diperlukan untuk mendukung peningkatan penetrasi variabel energi terbarukan tersebar ke integrasi jaringan interkoneksi sistem tenaga listrik agar optimalisasi operasi sistem tenaga listrik dapat tercapai, termasuk potensi partisipasinya pada tahap pengendalian pencegahan, perbaikan, darurat, dan pemulihan, termasuk pembentukan agregator & kerangka peraturan terkait, grid connection code, serta kebijakan penghematan energi & skema kewajiban efisiensi energi, arah & jalur kebijakan dan kerangka kerja untuk memfasilitasi transisi ini.
References
1. IRENA, “PLANNING FOR THE RENEWABLE FUTURE - Long-term Modelling and Tools
   to Expand Variable Renewable Power in Emerging Economies”, 2017.
2. Sally Hunt and Graham Shuttleworth, Competition and Choice in Electricity, John
   Wiley & Sons, Inc, 1996.
3. Sally Hunt, Making Competition Work in electricity, John Wiley & Sons, Inc, 2002.
4. Fink & Carlsen, “Operating under stress and strain”, IEEE Spectrum, March 1978.
5. Mark G. Lauby, Mark Ahlstrom, Daniel L. Brooks, et al., “Balancing Act. NERC’s
   Integration of Variable Generation Task Force Plans for a Less Predictable Future”,
   IEEE Power & Energy Magazine, Volume 9, No. 6, November/December 2011.
6. Dan Ton, and Jim Reilly, “Microgrid Controller Initiatives”, Vol. 15, No. 4,
   July/August 2017.
7. Goran Strbac, Nikos Hatziargyriou, Joao Pecas Lopes, Carlos Moreira, Aris Dimeas,
   and Dimitrios Papadaskalopoulos, “Microgrids – Enhancing the Resilience of the
   European Megagrid’, IEEE Power & Energy Magazine, Vol. 13, No. 3, May/June
   2015.
8. Geza Joos, Jim Reilly, Ward Bower, and Russ Neal, “The Need for Standardization”,
   IEEE Power & Energy Magazine, Vol. 15, No. 4, July/August 2017.
9. Arindam Maitra, Annabelle Pratt, Tanguy Hubert, Dean Weng, Kumaraguru
   Prabakar, Rachna Handa, Murali Baggu, and Mark McGranaghan, “Microgrid
   Controllers”, IEEE Power & Energy Magazine, Vol. 15, No. 4, July/August 2017.
References
10. Grid Modernization Laboratory Consortium, U.S. DOE, “Interoperability Strategic
    Vision”, A GMLC White Paper, March 2018.
11. IEEE PES, “Stability definitions and characterization of dynamic behavior in systems
    with high penetration of power electronic interfaced technologies”, TECHNICAL
    REPORT, PES-TR77, April 2020.
12. Mark Mc Granaghan, “Making Connection – Asset Management and the Smart Grid”,
    IEEE Power & Energy Magazine, Vol. 8, No. 6, November/December 2010.
13. Stanley H. Horowits, Arun G. Phadke, and Bruce A. Renz, “The Future of Power
    Transmissions – Technological Advances for Improved Performance”, IEEE Power &
    Energy Magazine, Vol. 8, No. 2, March/April 2010.
14. U.S. Department of Energy (DOE), “Transforming the Nation’s Electricity System: The
    2nd Installment of the QER, January 2017.
15. Ali Bidram, Frank L. Lewiss, and Ali Davoudi, “Distributed Control Systems for Small-
    Scale Power Networks - USING MULTIAGENT COOPERATIVE CONTROL THEORY”, IEEE
    Control Systems Magazine, Vol. 34, No. 6, December 2014.
16. EPRI, “Grid Interactive Microgrid Controllers and the Management of Aggregated
    Distributed Energy Resources (DER)”, 2015 Technical Report.
17. EPRI, “The Integrated Grid. A Benefit-Cost Framework”, Final Report, February 2015.
18. U.S. Department of Energy (DOE), “Staff Report to the Secretary on Electricity Markets
    and Reliability”, August 2017.
19. IEEE SMARTGRID, “ IEEE Smart Grid Compedium”, 2015.
References
20. Australian Energy Market Operator - AEMO, “Black System South Australia 28
September 2016”, Final Report, March 2017.
21. Paul Denholm, Josh Eichman, and Robert Margolis, “Evaluating the Technical and
Economic Performance of PV Plus Storage Power Plant”, Technical Report, NREL,
August, 2017.
22. Vincenzo Giordano, Ijeoma Onyeji, and Gianluca Fulli (JCR IET); Manuel Sanchez
Jimenez, and Constantina Filiou (DG ENER), “Guidelines for conducting a cost-
benefit analysis of Smart Grid projects”, Joint Research Centre Reference Report,
2012.
23. Greensmith Energy, “Transforming Today’s Energy Grid - How specialized design,
integration and supply chain expertise are the key success factors for the grid of
the future”, White Paper, May 2017.
24. Klaus-Dieter Borchardt, Director Internal Energy Market, Directorate General for
Energy European Commission, “Benchmarking smart metering deployment in EU”,
European Conference on Smart Metering Deployment in the EU, Brussels, 26 June
2014.
25. Edison Electric Institute - EEI, “Solar Energy and Net Metering”, January 2016.
26. Hardiv Harris Situmeang, Sekuriti Sistem Tenaga Listrik – Pengendalian Darurat,
Seminar Nasional Peran Teknik Kendali dalam Dunia Industri, Masyarakat Sistem
Kendali Indonesia, 19 Juli 1997.You can also read


