2020 ENERGY MARKET GERMANY - BDEW

Page created by Monica Watson
 
CONTINUE READING
2020 ENERGY MARKET GERMANY - BDEW
ENERGY MARKET
GERMANY

2020
            BDEW Bundesverband der Energie- und Wasserwirtschaft e. V.
2020 ENERGY MARKET GERMANY - BDEW
CONTENTS

Energy and the economic situation .  .  .  .  .  .  .  .  .  .  .  .  .                        4     Gas storage facilities in Germany  .  .  .  .  .  .  .  .  .  .  .  .  .  . 30
Key data for gas, electricity, heating and energy                                                    Gas sales .  .  .  .  .  .  .  .  .  .  .  .  .  .  .  .  .  .  .  .  .  .  .  .  .  .  .  .  . 31
networks  .  .  .  .  .  .  .  .  .  .  .  .  .  .  .  .  .  .  .  .  .  .  .  .  .  .  .  .  . 6    Electricity consumption .  .  .  .  .  .  .  .  .  .  .  .  .  .  .  .  .  .  .  . 32
The German extra-high voltage grid  .  .  .  .  .  .  .  .  .  .  .  . 13                            District heating /cooling sales  .  .  .  .  .  .  .  .  .  .  .  .  .  .  .  . 33
Diversity in the energy industry  .  .  .  .  .  .  .  .  .  .  .  .  .  .  . 14                     Space heating market  .  .  .  .  .  .  .  .  .  .  .  .  .  .  .  .  .  .  .  .  . 34
Customer behaviour .  .  .  .  .  .  .  .  .  .  .  .  .  .  .  .  .  .  .  .  .  . 15               Heating in new builds  .  .  .  .  .  .  .  .  .  .  .  .  .  .  .  .  .  .  .  .  . 35
Reliability of gas supply .  .  .  .  .  .  .  .  .  .  .  .  .  .  .  .  .  .  .  . 16              Electricity consumption of households .  .  .  .  .  .  .  .  .  .  . 36
Reliability of electricity supply .  .  .  .  .  .  .  .  .  .  .  .  .  .  .  . 17                  Electricity demand of households .  .  .  .  .  .  .  .  .  .  .  .  .  . 37
Sector coupling .  .  .  .  .  .  .  .  .  .  .  .  .  .  .  .  .  .  .  .  .  .  .  .  . 18         Natural gas import prices .  .  .  .  .  .  .  .  .  .  .  .  .  .  .  .  .  .  . 38
Combined heat and power  .  .  .  .  .  .  .  .  .  .  .  .  .  .  .  .  .  . 19                     Natural gas prices for households .  .  .  .  .  .  .  .  .  .  .  .  .  . 39
Natural gas mobility  .  .  .  .  .  .  .  .  .  .  .  .  .  .  .  .  .  .  .  .  .  . 20            Electricity prices for households .  .  .  .  .  .  .  .  .  .  .  .  .  .  . 40
eMobility .  .  .  .  .  .  .  .  .  .  .  .  .  .  .  .  .  .  .  .  .  .  .  .  .  .  .  .  . 21   Electricity prices for industry .  .  .  .  .  .  .  .  .  .  .  .  .  .  .  .  . 41
Biomethane  .  .  .  .  .  .  .  .  .  .  .  .  .  .  .  .  .  .  .  .  .  .  .  .  .  .  . 22       Taxes and levies on natural gas  .  .  .  .  .  .  .  .  .  .  .  .  .  .  .  . 42
Sources of district heating  .  .  .  .  .  .  .  .  .  .  .  .  .  .  .  .  .  . 23                 Taxes, levies and surcharges on electricity .  .  .  .  .  .  .  .  . 43
Electricity generation  .  .  .  .  .  .  .  .  .  .  .  .  .  .  .  .  .  .  .  .  . 24             Promotion of renewable energies .  .  .  .  .  .  .  .  .  .  .  .  .  . 44
Electricity from renewable energy sources .  .  .  .  .  .  .  .  . 25                               Redispatch .  .  .  .  .  .  .  .  .  .  .  .  .  .  .  .  .  .  .  .  .  .  .  .  .  .  .  . 45
Capacity and output of power stations .  .  .  .  .  .  .  .  .  .  . 26                             Investment – gas .  .  .  .  .  .  .  .  .  .  .  .  .  .  .  .  .  .  .  .  .  .  .  . 46
Deployment of power stations .  .  .  .  .  .  .  .  .  .  .  .  .  .  .  . 27                       Investment – electricity .  .  .  .  .  .  .  .  .  .  .  .  .  .  .  .  .  .  .  . 47
Electricity exchange with other countries  .  .  .  .  .  .  .  .  . 28                              CO2-emissions of electricity generating plants  .  .  .  .  .  . 48
Peak electricity demand .  .  .  .  .  .  .  .  .  .  .  .  .  .  .  .  .  .  .  . 29                Explanatory notes and abbreviations .  .  .  .  .  .  .  .  .  .  .  . 49

                                                                                                                                                                                                          3
ENERGY AND THE ECONOMIC SITUATION
Energy consumption continues to fall in 2019

Annual rates of change 1971–20192) (per cent)

    10

    8

    6

    4

     2

    0

    -2

    -4

    -6
           1971
           1972
           1973
           1974
           1975
           1976
           1977
           1978
           1979
          1980
           1981
          1982
          1983
          1984
          1985
          1986
          1987
          1988
          1989
          1990
         19911)
          1992
          1993
          1994
          1995
          1996
           1997
          1998
          1999
         2000
          2001
         2002
         2003
         2004
         2005
         2006
          2007
         2008
         2009
          2010
           2011
          2012
          2013
          2014
          2015
          2016
          2017
          2018
         20192)
                                             Electricity consumption                                Primary energy consumption                                 Gross Domestic Product (GDP)

Sources: AGEB, Destatis, BDEW; Status: 05/2020                                                                                                                 1) Up to 1991, West Germany only, 2) Preliminary figures

4
ENERGY AND THE ECONOMIC SITUATION
                                                                                  Energy consumption continues to fall in 2019

Economic growth and energy consumption were closely interrelated         In contrast, gross electricity consumption decreased in 2019 compared
between 1971 and 1990, however the development of GDP and of             to 2018. At 569 bn kWh, consumption was 2.6 per cent lower year
energy consumption began to diverge at the beginning of the 1990s.       on year. Electricity productivity for the economy as a whole, which
From 1991 to 2010, electricity consumption increased on average by       experienced average annual growth between 1990 and 2019 of 1.8 per
around 0.7 per cent annually whilst the economy grew on average by       cent, increased in 2019 by 2.7 per cent.
1.2 per cent. From 2010 onwards, electricity consumption was on a
general downward trend. In the past two years, primarily due to the      Gross domestic product, after adjustment for inflation, increased
mild weather and weaker economic growth, it has fallen once more.        by 0.6 per cent in comparison to the previous year. The growth was
                                                                         driven mainly by domestic consumption and investments. However,
Primary energy consumption fell in 2019 by 2.1 per cent to 12 832 PJ.    the positive contributions came primarily from the areas of commerce,
That is the lowest level since the beginning of the 1970s. The main      trade and services as well as the construction industry, whilst the
causes of the drop were economy driven falls in energy consumption       gross value added of industry shrank by 3.6 per cent.
by industry as well as improvements in energy efficiency. Adjusted for
the effects of the weather, energy consumption even sank by 2.4 per
cent.

Natural gas consumption in Germany increased in 2019 by 3.3 per
cent to 982 bn kWh. The main reason for this was the increased use of
natural gas for the generation of electricity and heating. Natural gas
accounted for 24.9 per cent of domestic primary energy consumption.

                                                                                                                                            5
GAS FLOW
From import and production to consumption

Gas flow in 20191) (bn kWh)

                                                                              Storage                                         53

                                                                                    Exports (incl. all transit)              736

                                                                                                                   Own consumption / statistical differences 25

     Imports (incl. all transit)   1 712                                                                                                        Mining and manufacturing         363
                                                       Natural gas output   1 771

                                                                                                                                                    Households                   285
                                                                                          Natural gas                      Natural gas
                                                                                                             982                         957
                                                                                          consumption                      sales
                                                                                                                                                  Commerce, trade, services       113
                                                                                                                                               Electricity suppliers              129
                                                                                                                                            Heating / cooling suppliers           65
     Domestic natural gas production       59
                                                                                                                                          Transport                                 2

In 2019 a further 9.5 bn kWh of biogas upgraded to natural gas quality was injected into the German natural gas network.

Sources: Destatis, BVEG, dena, BDEW; Status: 02/2020                                                                                                                   1) Preliminary figures

6
KEY DATA – GAS
                                                                                 The most important figures at a glance

Gas suppliers                                                 2009      2018            20191)         Change year-on-year (per cent)
Employees (thousand)                                            35.4     39.0              39.2                                                 +0.5
Revenue (€ bn) from gas sales to end users  2)
                                                                37.0     32.3              33.9                                                 +4.8
Investment (€ bn)                                                3.0       2.9               2.7                                                 -6.7
Domestic natural gas production (bn kWh)                       141.5     61.7              59.2                                                  -3.9
Natural gas imports3) (bn kWh)                                 949.3   1 773.3         1 712.1                                                   -3.4
Natural gas exports3) (bn kWh)                                 143.3    861.8             736.6                                                -14.5
Net-imports (bn kWh)                                           806.0    911.4             975.5                                                 +7.0
Storage net balance (bn kWh)                                   -34.4    -21.9             -52.6                                                      -
Natural gas consumption (bn kWh)                               913.1    951.2             982.2                                                 +3.3
Natural gas sales (bn kWh)                                     904.9    935.4             957.3                                                 +2.3
Feed-in of biomethane into the grid (bn kWh)                     1.0     10.4                9.5                                                 -8.8
Number of homes supplied with natural gas heating (million)     19.5     20.8              20.9                                                 +0.6
Network length (km)                                            431.7    487.7             490.0                                                 +0.5
- low-pressure networks                                        141.0    160.3             161.0                                                 +0.4
- medium-pressure networks                                     180.2    205.8             207.0                                                 +0.6
- high-pressure networks                                       110.4    121.6             122.0                                                 +0.3
Underground storage facilities
- Number                                                         47        47                 47                                                     -
- Capacity (million m3)                                       20 804   24 298           23 900                                                   -1.6

Sources: Destatis, BVEG, dena, LBEG, BDEW                                          1) Preliminary figures, 2) Excl. VAT, 3) From 2018, incl. all transit

                                                                                                                                                      7
ELECTRICITY FLOW
From generation to consumption

Electricity flow in 20191) (bn kWh)

                                                                    Power flows to other countries                     74
                                                                     Input into electricity storage facilities         8
                                                                      Network losses and statistical differences       27

      Net generation of
                                525                                                                      Mining and manufacturing               234
      electricity suppliers

                                           Electricity output 620
                                                                             Net electricity                Commerce, trade, services           130
                                                                             consumption        512
      Net generation of
                                49
      industrial power plants

      Electricity flows from                                                                              Households                             126
                                40
      other countries
                                                                                                        Agriculture                               10
      Withdrawal from            6
      electricity storage                                                                             Transport                                   12

Sources: Destatis, BDEW; Status: 02/2020                                                                                       1) Preliminary figures, rounding differences

8
KEY DATA – ELECTRICITY
                                                                                                                 The most important figures at a glance

Electricity suppliers                                                                2009               2018             20191)         Change year-on-year (per cent)
Employees (thousand)                                                                 130.4              138.0              138.0                                                +0.0
Revenue (€ bn) from electricity sales to end users2)
                                                                                      63.5               83.5               84.5                                                +1.2
Investment (€ bn)                                                                       8.5              12.2               13.0                                                +6.6
Net capacity of power stations
- total (GW)                                                                         150.9              213.6              218.1                                                +2.1
- general supply3) (GW)                                                              139.8              202.8              207.2                                                +2.2
Net electricity generation
- total (bn kWh)                                                                     553.1              601.3              574.3                                                -4.5
- general supply3) (bn kWh)                                                          510.6              550.1              524.8                                                -4.6
Net electricity consumption
- total (bn kWh)                                                                       509                522                512                                                -2.0
- general supply3) (bn kWh)                                                            491                492                483                                                -1.8
Physical flows (bn kWh)
- from other countries                                                                   41                 32                 40                                             +25.6
- to other countries                                                                     55                 83                 74                                             -10.0
- net balance of exchanges                                                           -14.3              -51.2              -34.9                                                    -
Number of customers
- Customers at tariff rates and those with special agreements (million)               44.7               45.5               45.6                                                +0.1
- Customers with special rates (million)                                                  0                  0                  0                                               +0.0
Circuit lengths (million km)                                                            1.8                1.8                1.8                                               +0.1

Sources: Destatis, BNetzA, BDEW                            1) Preliminary figures, 2) Excl. VAT and electricity tax, 3) Excl. industrial power plants, incl. decentralised small plants

                                                                                                                                                                                     9
DISTRICT HEATING FLOW
From generation to consumption

District heating flow in 20191) (bn kWh)

                                                                 Operation consumption 4
                                                                                                  Losses and statistical differences      13

                                                                                                                                   Mining andmanufacturing          47

     Net heating generation                District heating /             Heating network
                              134                               141                         137            Use of district
     of heating and cooling                cooling output                 feed-in                                               124
                                                                                                           heating / cooling
     suppliers                                                                                                                                 Households incl.
                                                                                                                                                                            51
                                                                                                                                               housing companies

     Feed-in from other                                                                                                                Other           26
     market participants      7

Sources: Destatis, BDEW; Status: 02/2020                                                                                                                           1) Preliminary figures

10
KEY DATA – DISTRICT HEATING
                                                                            The most important figures at a glance

Cooling and heating suppliers                                   2009    2018     20191)   Change year-on-year (per cent)
Employees (thousand)                                             15.3    15.4      15.4                                       -0.3
Revenue from heating sales to end users (€ bn)
                                           2)
                                                                + 8.6   + 8.6     + 9.0                                       +4.7
Investment (€ bn)                                                 1.0     1.3       1.4                                       +2.3
Net max. heating output
- total (GW)                                                     59.4    77.1      74.3                                       -3.6
- general supply (GW)                                            56.5    74.6      71.8                                       -3.8
District heating/cooling output (bn kWh)                        139.3   141.2     141.2                                       +0.1
- from highly efficient combined heat and power                  95.4   102.4     101.9                                       -0.5
- from separate generation in heating/CHP plants                 35.1    31.7      32.1                                       +1.3
- from other market participants                                  8.8     7.1       7.2                                       +2.1
Use of district heating/cooling (bn kWh)                        124.5   123.5     124.1                                       +0.5
- industry                                                       51.2    48.3      47.1                                       -2.6
- private households incl. housing companies                     49.1    49.7      51.0                                       +2.6
- other                                                          24.4    25.4      26.0                                       +2.3
Number of households supplied with district heating (million)     5.1     5.8       5.9                                       +1.4
Length of pipelines (thousand km)                                21.5    28.6      29.0                                       +1.4

Sources: Destatis, BNetzA, BDEW                                                                  1) Preliminary figures, 2) Excl. VAT

                                                                                                                                  11
NETWORK LENGTHS
The development of the energy supply networks at a glance

Length of suppliers’ networks (km)

                                       2009            20191)
Gas network operators                                               Pressure levels of the gas network:
Low-pressure networks                141 048        161 000         Low-pressure:        up to and including 100 millibars
Medium-pressure networks             180 215        207 000         Medium-pressure: from over 100 millibars up to and including 1 bar
High-pressure networks               110 416        122 000         High-pressure:       above 1 bar
Total length of pipes                431 679        490 000
Electricity network operators                                       Voltage levels of the electricity network:
Low voltage                     1 143 494         1 200 000         Low voltage:        up to and including 1 kV
voltage                           506 292           525 500         Medium voltage:     from over 1 kV up to and including 72.5 kV
High voltage                       76 954            85 700         High voltage:       from over 72.5 kV up to and including 125 kV
Extra-high voltage                 35 311            37 050         Extra-high voltage: over 125 kV
Stromkreislänge gesamt          1 762 051         1 848 250
Heating and cooling network operators                               Temperatures, heating network:
Heat transfer medium: water           20 281          26 150        Water:             < 30 °C up to over 140 °C
Heat transfer medium: steam              877           2 870        Steam:             110 °C up to over 300 °C
Total length of pipes                 21 158          29 020

Source: BDEW                               1) Preliminary figures

12
e                                                                        Kiel
                                                                        Nordse
                                                                                                                                    S c h l e s w i g-
                                                                                                                                      Ho l s t e i n

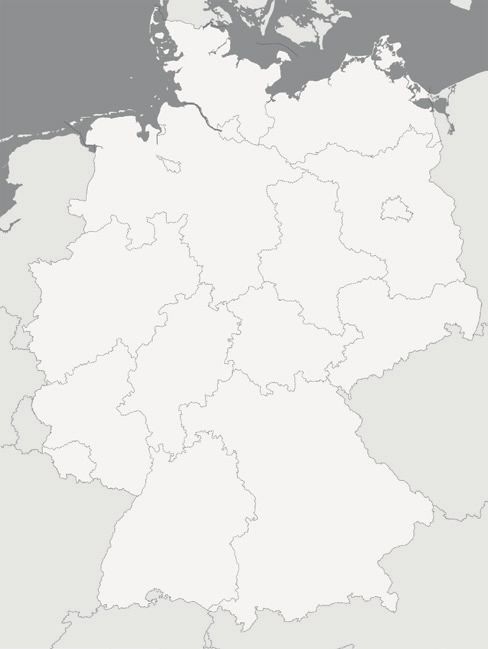
                                                                                    THE GERMAN EXTRA-HIGH
                                                                                                  Schwerin                        VOLTAGE GRID
                                                                                                           M e c k l e n bu rg -Vo r po m m e r n
                                                                                                                                Hamburg
                                                                                                                                                                 Network expansion urgently required

                                                                                                Bremen
                                                                                                                                                                                                   DK                        B r a n de n bu rg                                                         O s t             PL
Germany is served by a network of around 37 000 kilometers of extra-                                        N i e de r Deutsches
                                                                                                                       sachsen
                                                                                                                      Höchstspannungsnetz
                                                                                                                                                                                                                                                                                                              s e
                                                                                                                                                                                                                                                                                                                  e

high voltage lines. This electricity network, operated at voltages of
                                                                                                                  Hannover                                       Nordse
                                                                                                                                                                        e                                                    Kiel                           Berlin
220 and 380 kilovolts, forms the basis of a secureNLelectricity supply.                                                                                                                                              S c h l e s w ig -
                                                                                                                                                                                                                       Hol s t e in
                                                                                                                                                                                                                                          Potsdam

                                                                                                                                                                                                        Magdeburg                            Schwerin
                                                                                                                                                                                                                                                            M e c k l e n b u rg-Vor p om m e r n
                                                                                                                                                                                                                     Hamburg
Further expansion is required to optimally integrate, in particular,
                                                                                                                                                                                        S a c h s e n -Anhal t
the planned onshore and offshore wind farms and to ensure the                                                                                                                               Bremen
                                                                                                                                                                                                                                                                          Br a n d e n b u rg                                  PL
electricity produced there can be transported to the centres                     Dortmund
                                                                                      of                                                                                                               Nie d e r s a c h s e n

consumption. According to the German Federal Requirements                                                                                                                                                     Hannover                                                                     Berlin
                                                                  Essen                                 Kassel                          NL                                                                                          Leipzig                                     Potsdam

                                                 Düsseldorf                                                                                                                                                                                                                    Dresden
Plan Act [Bundesbedarfsplangesetz, BBPIG], the         intention                  is for
                                                                                                                                                                                                                                                               Magdeburg

                                                                      Nordrhein-Westfalen
                                                                     Köln lines to                                                                                 Erfurt                                                                            S a c h s e n -Anhal t
the urgently required high-voltage direct current (HVDC)                                                                                                               Dortmund
                                                                                                                                                                                                                                                               S a c h s en
                                                                                                                                                           ThEssenü r i n ge n
transport electricity generated from wind power from the north                                       He s s e n                       Düsseldorf
                                                                                                                                                                                                    Kassel                                                                    Leipzig
                                                                                                                                                                                                                                                                                                         Dresden
                                                                                                                                                                Nordrhein-Westfalen
to the centres of consumption in the south from 2025 onwards.                                                                                                   Köln                                                                  Erfurt
                                                                                                                                                                                                                                                                                                  CZ
                                                                                                                                                                                                                                                                                                S a c h s en
                                             B                                                                                                                                                                                   Th ü r in g e n
In the scope of the German Grid Expansion Acceleration Act                                                                                                                                       He s s e n
                                                                                                                                                                                                                                                   Leitungsverbindungen                         CZ
                                                                                                                          B
[Netzausbaubeschleunigungsgesetz, NABEG], procedures have been Frankfurt                                                                                                          Frankfurt
                                                                                                                                                                                                                                                                380 kVLeitungsverbindungen
                                                                                                                                                                                                                                                                        / in Bau / in Planung
                                                                                                                                                                                                                                                                                   380 kV / in Bau / in Planung
                                                                                Wiesbaden                                                                                Wiesbaden                                                                              220 kV
initiated to speed up the planning and authorisationR h eprocesses.
                                                                                                                                                                                                                                                                                   220 kV
                                                                       i n l a n d-    Mainz                                    L
                                                                                                                                                           R h e in l a n d -   Mainz                                                                                              150/220 kV / in Bau / in Planung
                                                                                                                                                                                                                                                                150/220 kV / in Bau / in Planung
                                               L                      Pfalz
                                                                                                                                                                Pfalz

Moreover, a more intense involvement of the general public should                                                                                       Saarland                                                                                   Nürnberg
                                                                                                                                                                                                                                                                                                      HGÜ-Leitung / in Bau /
                                                                                                                                                                                                                                                                                                      in Planung
                                                                                                                                                                                                                                                                         HGÜ-Leitung /Umspannwerke/Stationen
                                                                                                                                                                                                                                                                                       in Bau /
promote acceptance for electricity line projects at a local
                                                        S a a r l a nlevel.
                                                                      d
                                                                                                                                                               Saarbrücken
                                                                                                                                                                                   Nürnberg
                                                                                                                                                                                                                                                           B ayer n      in Planung HGÜ-Stationen
                                                                                                                                                                                                                                                                                      Städte
                                                                                                                                                                                    Karlsruhe                                                                            Umspannwerke/Stationen
                                                                      Saarbrücken                                                                                                                B aye r n
                                                                                                                                                                                           Stuttgart                                                                     HGÜ-Stationen
                                                                                                                                                                                   B a d e n -Wür t te m b e rg
                                                                                                                                                                                                                                                                         Städte
                                                                                           Karlsruhe                                           F
                                                                                                                                                                                                                                                                                                                 A
                                                                                                                                                                                                                                                         München

                                                                                                Stuttgart

                                                                                                                                                                                    CH
                                                                                        B a de n -Wü r t te m be rg   Kartogr       www.kartopolis.de

                                                              F
                                                                                                              Source: VDE|FNN; Status: 01/2020                                                                                                                                                    A
                                                                                                                                                                                              München

                                                                                                                                                                                                                                                                                                                                    13
UNIQUE DIVERSITY IN THE ENERGY MARKET
Around 2 250 companies take care of the energy supply

Number of companies in the different market areas1)                              There is no other European country with as many energy supply
                                                                                 companies as Germany. Alongside a series of major companies, there
                                                                                 is a substantial number of small and medium-sized energy suppliers,
     Elec. producers (>100 MW)        90
                                                                                 the majority of which are in municipal ownership. Overall, they
        Elec. network operators      906
                                                                                 account for more than two thirds of all companies.
  Electricity storage operators      107
              Electricity traders     59
                                                                                 In total, there are around 2 250 companies active on the German
            Electricity suppliers   1 356                                        energy market in 2020 – their fields of activity cover everything from
     Natural gas producing firms       7                                         the generation or production of electricity, heating and natural gas
         Gas network operators       720                                         to the operation of energy storage facilities, power line and pipeline
          Gas storage operators       30                                         networks and the supply to end-users on a local and regional level.
                     Gas traders      68
                   Gas suppliers    1 050                                        Despite many mergers, particularly at a regional level, the number of
      District heating producers     595                                         companies active in the German energy market today is considerably
                                     454
                                                                                 higher than prior to liberalisation in 1998. Suppliers that mainly serve
 Dist. heat. network operators
                                                                                 private customers are predominantly multi-utility companies who
      Heating storage operators       18
                                                                                 offer their customers a variety of product packages for natural gas,
       District heating suppliers    562
                                                                                 district heating, electricity and often also water.

1) Figures may not be summed as many of the companies are active in
   multiple sectors and at multiple levels of the value chain and have thus
   been recorded more than once; some figures rounded (*). In total, around
   2 200 companies are active on the electricity/gas/district heating markets.

Sources: BDEW, BNetzA; Status: 05/2020

14
SWITCHING SUPPLIERS ON THE ENERGY MARKET
                                                                           Cumulative rate of switching since liberalisation

Many new suppliers but also many established energy suppliers, now           Switching of electricity and gas supply in homes
offer their products across multiple regions within Germany or even          (per cent)
nationwide. This continues to lead to slightly increasing year-on-
                                                                             10/10                          21.9
year rates of switching. Since liberalisation of the market, over 47 per      10/11                                25.8
cent of all household customers had switched electricity supplier at         10/12                                    29.7
                                                                             10/13                                          33.5
least once by April 2020, with many of those already having switched
                                                                             10/14                                               36.1
multiple times.                                                              10/15                                                   39.5
                                                                                                                                                          Electricity
                                                                             10/16                                                         42.0
                                                                             10/17                                                         42.6
Customers can usually choose from other options offered by their
                                                                             10/18                                                          43.8
energy provider in addition to the general tariff. The range of              07/19                                                            45.3
products offered by the energy providers also often includes green           01/20                                                                46.6
energy tariffs. Therefore, in addition to switching to another supplier,     04/20                                                                 47.1

there are many customers who switch to a lower cost tariff or to a
                                                                             10/10          12.3
green power tariff from their existing supplier.                             09/11            14.1
                                                                             09/12                   17.8
                                                                             09/13                                 25.6
Of the around ten million households who have a direct contractual
                                                                             09/14                                   27.6
agreement with their gas supplier, over 37 per cent have already              10/15                                       30.9
                                                                                                                                                          Gas
switched supplier at least once since liberalisation in 2007.                09/16                                          32.3
                                                                              12/17                                          33.2
                                                                             07/18                                           34.0
                                                                             07/19                                               36.0
                                                                             01/20                                                 36.9
                                                                             04/20                                                  37.4

                                                                             Sources: BDEW-Energietrends, BDEW-Kundenfokus; Status 04/2020

                                                                                                                                                                   15
RELIABILITY OF GAS SUPPLY
Secure supply with natural gas

Average duration of interruption of natural gas supply                            For thirteen years now, the BNetzA has been collecting annual
per customer per year (minutes)1)                                                 data, in accordance with the German Energy Industry Act
                                                                                  [Energiewirtschaftsgesetz, EnWG], from all gas distribution network
 2.5                                                                              operators regarding interruptions in supply. On the basis of this
                                                                                  information, the SAIDI value (System Average Interruption Duration
                            1.99   1.91                                           Index) – an average value across all end customers served – is
 2.0          1.88
                                                        1.70
                                                                                  determined. The SAIDI value reflects the average duration within
 1.5                                                                              a calendar year in which a customer is affected by an outage. All
                     1.25                        1.25
                                                                                  unplanned interruptions which are due to third party actions are
       1.02                                                    1.03 0.99
 1.0                                                                              included, reactions from other networks or other disruptions in the
                                          0.64                                    network operator’s area.
 0.5                                                                       0.48

                                                                                  In 2018, the SAIDI value was 0.48 minutes, i.e. the supply of natural
  0                                                                               gas to German customers was interrupted on average for around half
       2008 2009 2010 2011 2012 2013 2014 2015 2016 2017 2018
                                                                                  a minute. As such, the reliability of the German gas supply remained
                                                                                  at a very high level in 2018; it remained markedly below the multi-
                                                                                  year median value of 1.6 minutes.

1) Unplanned interruptions without exceptional events (force majeure)

Source: BNetzA; Status: 06/2019

16
RELIABILITY OF ELECTRICITY SUPPLY
                                                                     Germany’s electricity networks remain particularly reliable

In 2018, the reliability of the German electricity grid was once again           Average unavailability of electricity supply
very high, with an average of just 13.3 minutes’ interruption per                per customer per year (minutes)
customer. This is shown by the 2018 Disruption and Availability
Statistical Report from the VDE|FNN. The key international standard              20.0
                                                                                        18.3
indicator for the reliability of supply is the annual non-availability per
                                                                                                      16.1   16.2
electricity customer excluding interruptions due to force majeure.                             15.7
                                                                                                                           15.0
                                                                                 15.0                               14.5
The extremely high level of reliability of supply in Germany must be                                                                                          13.3
                                                                                                                                  11.9   11.9          12.2
viewed in light of a rapidly growing number of redispatch measures.                                                                             11.5
These are short-term, unplanned interventions of network operators.              10.0

If electricity outages caused by force majeure are included – such
                                                                                  5.0
as, in particular, adverse weather – the average annual interruption
duration per electricity customer in 2018 was 17.1 minutes (2017: 20.0
minutes).                                                                          0
                                                                                        2008 2009 2010 2011 2012 2013 2014 2015 2016 2017 2018

                                                                                 Source: VDE|FNN; Status: 10/2019

                                                                                                                                                                17
SECTOR COUPLING
Linking sectors and infrastructures

Key factors for sector coupling                                           In Germany, there are currently over 35 PtG pilot and demonstration
                                                                          facilities. Further major projects for the application of PtG also exist
                                                                          in the form of the real life test projects within the Energiewende
                                                                          initiated by the German Federal Ministry for Economic Affairs and
                                                                          Energy [Bundeswirtschaftsministerium]. The hydrogen produced can
                                                                          be used directly or injected into the natural gas system. Through the
                                                                          methanation process, hydrogen can be further processed to produced
                                                                          synthetic natural gas (SNG) and thus fed into the gas grid without
                                                                          limit and used everywhere that conventional natural gas is used.

                                                                          Moreover, there are already 36 larger PtH plants with a total electrical
                                                                          capacity of around 555 MW across Germany today. The majority of
BDEW understands sector coupling to mean the linking of electricity,      those plants are integrated into CHP/heating network systems.
heating, mobility and industrial processes and their infrastructures in   Through the PtH module, they are then able to generate heating,
terms of energy technology and energy business. Sector coupling is a      for example from excess electricity from renewable energy sources.
significant element within the implementation of the Energiewende         Shutting down the CHP plant whilst simultaneously starting up the
[German energy transition]:                                               PtH plant relieves the electricity grid and can avoid wind energy plants
•   Integration of renewables                                             having to be disconnected. Excess heating can be “held” in heating
•   Decarbonisation of all sectors                                        storage facilities and used later to supply district heating customers.
•   Supporting security of supply and
•   Increasing flexibility in the energy system                           These types of sector coupling make an important contribution to the
                                                                          integration of electricity from renewables into the heating sector and
Use cases of sector coupling include power-to-gas (PtG) and power-        thus to the environmentally friendly heating of buildings.
to-heat (PtH) as well as eMobility.

18
COMBINED HEAT AND POWER
                                                                                        A key component in the Energiewende

Combined heat and power (CHP) facilities generate electricity and         CHP electricity generation in Germany (bn kWh)
heating simultaneously. Aside from the smaller installations, most
are integrated into a system comprising heating network, heating
storage facilities and increasingly also power-to-heat installations.     140
These flexible “heating network systems” supply many customers                                                                           116.5
                                                                          120                                                   110.0
with heating while also making an important contribution to the                                                     100.9                        106.1 104.6
security of supply and system security. In 2019, electricity generation   100
                                                                                         97.5   94.7 98.0 98.1 96.0
                                                                                 89.7
from CHP plants in Germany amounted to around 104,6 bn kWh.                80
That meant that the volume of electricity from CHP fell slightly, by
1.4%, in comparison to 2018. CHP thus accounted for an 18.2 per cent       60

share of net electricity generation. According to the estimates of         40
the four transmission system operators (TSOs), CHP plant operators
                                                                           20
will claim subsidies under the German Combined Heat and Power
Act [Kraft-Wärme-Kopplungsgesetz, KWKG] for around 28 bn kWh.               0
                                                                                 2009 2010 2011 2012 2013 2014 2015 2016 2017 2018 20191)
With that, the volume of electricity subsidised under the KWKG is
forecast to decrease by almost 11 bn kWh compared to 2018. This
can be attributed to several factors. Firstly, many older CHP plants
                                                                                                    General supply / feed-in suppliers
will, when they reach 30 000 full load hours, no longer be eligible for
                                                                                                    Industrial power generation
KWKG subsidies. Secondly, the rate of expansion of CHP collapsed in
                                                                                                    Private / other plants
2017 and 2018. In order to ensure the security of supply of electricity
and heating in 2030, the framework conditions in the KWKG must be
significantly improved via the German Act on the Phase-out of Coal
[Kohleausstiegsgesetz]. Only in this way can the required 17 gigawatt
gas-CHP capacities be constructed.                                        Sources: Destatis, AGEB, BDEW; Status: 02/2020           1) Preliminary figures

                                                                                                                                                         19
NATURAL GAS MOBILITY
Natural gas vehicles with almost zero particulate matter

Reduction in emissions – natural gas compared to petrol                            Road traffic causes almost 20 per cent of the greenhouse gas
and diesel (Euro 6)                                                                emissions in Germany. Alternative fuels could make a substantial
                                                                                   contribution to reducing the emission of greenhouse gases and other
                                                                                   pollutants (SO2, NOX, particulate matter). Natural gas and biomethane
                                                                                   are also important components of the future fuel mix. A particular
     -35%               -99%                -87%                 -67%              argument in favour of them as fuels is in the bottom-line reduction
                                                                                   in CO2 emissions of around 25 per cent in comparison to petrol. If pure
      CO21)            Particulate      Nitrogen Oxides       Hydrocarbons         biomethane is used, CO2 emissions can even be reduced by up to 97
                         matter              (NOx)                (HC)             per cent. Natural gas vehicles emit as good as no particulate matter.
              Petrol                   Natural gas

                                                                                   100 per cent biomethane is available today at 331 natural gas filling
                                                                                   stations. In addition, biomethane is added to the mix at many of the
                                                                                   over 830 natural gas fuel pumps in Germany. Moreover, there are now
     -23%               -99%                -90%                 -76%              18 LNG filling stations in the country.

                                                                                   As far as the number of natural gas vehicles on the roads is concerned,
      CO21)            Particulate      Nitrogen Oxides       Hydrocarbons
                         matter              (NOx)                (HC)             there was an increase of two per cent to a total of 98 460 vehicles, of
              Diesel                   Natural gas                                 which 82 198 are natural gas-powered cars.

1) Taking into account the current biomethane share of 20 %
   (see 3rd Interim Report of the 2015 dena Initiative for Natural Gas Mobility)

Source: Own representation from IAV data, 10/2015:
Euro 6 emissions standards, comparison using VW T5 CNG 2.0l

20
EMOBILITY
                                                                         Focus on expansion of charging infrastructure

The expansion of the charging infrastructure is continuing at a fast     Number of electric cars1) and publicly available
pace. The BDEW charging station register listed 27 730 publicly          charging points
available charging points in April 2020 of which 2 480 are rapid
charging points. As such, the number of publicly available charging     300 000

                                                                                                                                                                                                                                  239 000
                                                                                                                                                                                                                        239 000
stations had grown by 60 per cent since April 2019.

                                                                                                                                                                                                              207 000
                                                                        250 000

In the city rankings, Munich (1 185 charging points), Hamburg (1 096)   200 000

                                                                                                                  150 200
and Berlin (1 052 charging points) occupy the top spots. As far as a

                                                                                                               124 450
                                                                        150 000
ranking of the Laender is concerned, Bavaria (6 353 charging points),

                                                                                                           98 300
                                                                                                         87 750
                                                                                                        77 200
Baden-Württemberg (4 950 charging points) and North Rhine-

                                                                                                     60 000
                                                                        100 000

                                                                                                    49 500
                                                                                                  35 650
Westphalia (4 476 charging points) are in the first three positions.

                                                                                                 26 000

                                                                                                                                                                                                                   24 000
                                                                                                                                                                                                                             27 730
                                                                                                20 500

                                                                                                20 650
                                                                                               13 500
                                                                                               16 100
                                                                                              10 400
                                                                         50 000

                                                                                              12 700
                                                                                              13 550

                                                                                              10 878
                                                                                             5 600
                                                                                             5 900
                                                                                             6 500
                                                                                             7 400
                                                                                             4 400
                                                                                           500

                                                                                             4 700
                                                                                             5 550
Hamburg has the highest number of charging points per million

                                                                                  Jun 12 26800
                                                                                  Dec 12 37800

                                                                                             4 450
                                                                                           350
                                                                                           150
                                                                                  Dec 11 24250
residents (595), followed by Bavaria (486 charging points) and                0

                                                                                                 Jun 13
                                                                                                          Dec 13
                                                                                                                   Jun 14
                                                                                                                            Dec 14
                                                                                                                                     Jun 15
                                                                                                                                              Dec 15
                                                                                                                                                       Jun 16
                                                                                                                                                                Dec 16
                                                                                                                                                                         Jun 17
                                                                                                                                                                                  Dec 17
                                                                                                                                                                                           Jul 18
                                                                                                                                                                                                    Dec 18
                                                                                                                                                                                                             Jul 19
                                                                                                                                                                                                                        Dec 19
                                                                                                                                                                                                                                  Apr 20
Baden-Württemberg (447 charging points). According to the German
Federal Motor Transport Authority [Kraftfahrtbundesamt] (as at
1 January 2020) Bavaria had the highest number of purely battery-
powered cars and plug-in hybrids (at 52 444), followed by North                   Charging stations                                            Electric and plug-in-hybrid vehicles

Rhine-Westphalia (46 697).

According to the German Federal Motor Transport Authority, as of
1 January 2019, there were 136 617 purely battery-powered electric       1) Purely battery-powered cars and plug-in hybrids
vehicles and 102 175 plug-in-hybrid vehicles registered in Germany
(total: 238 792). That represents a year-on-year increase of 64 per      Sources: BDEW Survey on “Charging Infrastructure“, ladesaeulenregister.de,
cent and 53 per cent respectively.                                       KBA

                                                                                                                                                                                                                                  21
BIOMETHANE
          Renewable, storable and versatile

          Feed-in capacities and volume of biomethane fed into                                                                                                          As of December 2019, there were around 215 biomethane plants,
          the natural gas grid                                                                                                                                          with a capacity of around 1 172 million Nm³/a, injecting biomethane,
                                                                                                                                                                        upgraded to natural gas quality, into the natural gas grid. The injected
                                                  1 200                                                                                                                 volume of 873 million m³ (around 9.5 bn kWh) equates to just over
                                                                                                                                        1 124     1 169         1 172
                                                                                                                              1 107                                     one per cent of German natural gas consumption. More plants are
Number of plants / volume fed in (million m³) /

                                                  1 000                                                                                                                 currently under construction or at the planning stage.
                                                                                                                                                 957
                                                                                                                                                           873
   feed-in capacity (million Nm³/year)

                                                                                                                                       868
                                                                                                              820      850 855
                                                   800                                                               780
                                                                                                     665 688                                                            Biomethane is the term for (raw) biogas which, after being cleaned
                                                   600                                   580                                                                            and upgraded, has the same combustion properties as natural gas
                                                                                                520
                                                                             449
                                                                                    413
                                                                                                                                                                        and can be injected into the natural gas network. It can be used for
                                                   400
                                                                   269 275
                                                                                                                                                                        electricity production, in the heating market or as a fuel. Biomethane
                                                                                                                                                          215
                                                   200       158 179                                    179         186     204       207       213                     is renewable, storable and versatile.
                                                                                               144
                                                           93                      108
                                                                44      77
                                                          30
                                                     0                                                                                                                  In 2019, a total of 32 bn kWh of electricity was generated from biogas
                                                          2009

                                                                 2010

                                                                         2011

                                                                                    2012

                                                                                                2013

                                                                                                         2014

                                                                                                                     2015

                                                                                                                             2016

                                                                                                                                       2017

                                                                                                                                                 2018

                                                                                                                                                           20191)

                                                                                                                                                                        and biomethane, mostly in the around 9 300 plants with direct
                                                                                                                                                                        electricity generation. The electricity produced in this way supplied
                                                                                                                                                                        almost 5.6 per cent of gross electricity consumption. Together,
                                                      Number of plants                         Volume fed in                        Feed-in capacity
                                                                                                                                                                        biogas and biomethane provided around 16.7 bn kWh of heating and
                                                                                                                                                                        cooling in 2019. Natural gas vehicles were fuelled with 0.7 bn kWh of
                                                                                                                                                                        biomethane last year.
          1) Preliminary figures

          Sources: dena, BDEW (own calculations); Status: 02/2020

          22
SOURCES OF DISTRICT HEATING
                                                                                                                        Natural gas in front

In 2019, the net heating generation for grid-bound heating supply via    Net heating generation1) for grid-bound heating supply 20192)
the heating network systems in Germany was predicted to be around        (per cent)
141 bn kWh. At 62 bn kWh (44 per cent), the largest proportion of this
local and district heating was generated from natural gas. Hard coal
and lignite together contributed around 23 per cent (33 bn kWh) of                     5.6      8.7
                                                                                                      0.9
the heating generated.                                                     17.5                          6.1
                                                                                                           0.7
                                                                                                                              8.5 Biomass
Heating from renewable energies, as the third largest source,
                                                                                       141 bn
accounted for a proportion of around 17 per cent or a volume of just                    kWh
                                                                                                                 16.6
over 23 bn kWh. In addition, biomass contributed seven per cent
                                                                                                                              7.4 Biogenic municipal
(10 bn kWh) and biogenic municipal waste accounted for nine per                                                                   waste
cent (12 bn kWh). Heating from geothermal and solar thermal energy                                                            0.7 Geothermal and
only played a minor role in grid-bound heating supply in 2019, at                       43.9                                      solar thermal

0.9 bn kWh or 0.7 per cent.

                                                                                         Waste (non biogenic)              Renewable
Heating generation from non-biogenic waste totalled around 12 bn
                                                                                         Mineral oil                       Natural gas
kWh (9 per cent) in 2019. The next largest proportion, at six per cent
                                                                                         Waste heat                        Hard coal
and accounting for around 9 bn kWh, was waste heat recovery from
                                                                                         Other                             Lignite
industrial processes, from other market participants and external
live steam recovery. The provision of heating from mineral oil only
accounted for 0.9 per cent (1 bn kWh).                                   1) Heating suppliers as well as feed-in from industry and others
                                                                         2) Preliminary figures

                                                                         Sources: Destatis, BDEW; Status: 02/2019

                                                                                                                                                   23
ELECTRICITY GENERATION
Clear changes to energy mix

Net electricity generation 20191) (per cent)                                  In 2019, (net) electricity generation in Germany amounted to 574
                                                                              bn kWh. The largest proportion of that was supplied, as in previous
                                                                              years, from renewable energies, at 236 bn kWh (41 per cent).

       15
                   4                                                          The progress of the Energiewende is well illustrated by the hugely
                                                    4    Water
                                                                              changed energy mix in electricity generation. The proportion of
                                                                              renewable energies has markedly increased over the last ten years,
 9                                                  17   Wind onshore
                                                                              while electricity production from nuclear power is continuously
             574 bn             41
              kWh                                   4    Wind offshore        decreasing due to the decision to phase out that energy source. The
                                                    8    Photovoltaics        last of the seven electricity generating units will be taken offline at
  18                                                8    Biomass              the end of 2022. Electricity generation from lignite and hard coal is
                                                    1    Municipal waste
                                                    0.02 Geothermal           similarly declining. In 2018, hard coal power plant units with a total
              12                                                              capacity of 879 MW were shut-down. As of the end of the year, a
                                                                              further 1 973 MW of power plant capacity was in the lignite-standby
                                                                              pool.
        Renewables              Hard coal
        Nuclear energy          Natural gas
        Lignite                 Other conventional energy sources

Source: BDEW; Status: 03/2020                        1) Preliminary figures

24
ELECTRICITY FROM RENEWABLE ENERGY SOURCES
                                                                          Wind energy provides the most green power

In 2019, electricity from renewables already covered almost 43 per      Electricity generation by energy source (bn kWh)
cent of German electricity demand. Wind and hydropower, biomass,
municipal waste and photovoltaics delivered a gross figure of
around 242 bn kWh of electricity. The payment guaranteed by the         250                                                                                242.0
government for electricity generated from renewable energies was                                                                                   223.2
                                                                        225                                                                214.8
one of the reasons why green electricity generation has seen a more     200                                                  187.2 188.6
than 150 per cent increase over the past ten years.                     175                                          161.1
                                                                                                             151.5
                                                                        150                          143.4
                                                                                             123.8
Onshore and offshore wind power plants produced around 126 bn           125
                                                                                     105.5
kWh in 2019; this was over three times the level as recently as 2009.   100   96.0

Electricity generation from biogenic energy sources (including the       75
renewable share of waste) amounted to 50 bn kWh, hydropower              50
plants delivered 20 bn kWh. Photovoltaic plants contributed 45 bn        25
kWh to electricity generation in Germany. The first German power          0
                                                                              2009 2010 2011 2012 2013 2014 2015 2016 2017 2018 20191)
station using geothermal energy came online in 2004. In 2019, 0.2 bn
kWh came from this renewable source of energy.
                                                                                         Water                                    Wind onshore
                                                                                         Biomass                                  Photovoltaics
                                                                                         Municpal waste (50 %)                    Geothermal
                                                                                         Wind offshore

                                                                        Sources: ZSW, BDEW; Status: 02/2020                           1) Preliminary figures

                                                                                                                                                             25
CAPACITY AND GENERATION 2019
Not all power plants are the same

Installed capacity and generation of the overall                                       For reasons of cost, efficiency and availability, power plants are
electricity industry 2019 (per cent)1)                                                 deployed for electricity generation in different ways. Nuclear and
                                                                                       lignite-fired power stations currently generate, in the main in the
                                                   3.4                      4.2
                                                                                       base load – i.e. electricity demand which remains constant around
     Wind offshore                                                                     the clock – almost one third of the electricity in Germany. However,
                                                                            17.3
     Wind onshore                                24.4                                  as a proportion of total installed capacity, such plants only make up
     Photovoltaics                                                           7.9       14 per cent of the generation fleet as they are characterised by a long
                                                                             8.2
     Biomass and other                                                                 utilisation period and a high rate of availability.
     renewable energies                          22.5                        3.8
                                                                            15.3
     Oil and other                                 3.9
                                                   4.9
                                                                                       Generation from wind and solar is determined by fluctuating wind
     Natural gas                                                            9.0
                                                  13.6                                 conditions and number of hours of sunshine. Photovoltaic energy
     Hard coal
                                                                            18.3       contributes nearly 8 per cent to electricity generation, but accounts
     Lignite                                      10.6
                                                   9.6                                 for 23 per cent of installed capacity. For periods when the sun is not
     Nuclear energy                                                         12.4
                                                   4.4                                 shining or the wind is not blowing, appropriate capacity has to be
     Hydropower                                    2.6                       3.5
                                                                                       available in reserve in plants which can be used in a plannable manner.
                                      Installed capacity 2)   Electricity generation
                                        218.1 GW (net)           574.3 TWh (net)       In order to meet demand during short-term peaks in electricity
                                                                                       consumption, or to compensate for rapid fluctuations in feed-in from
                                                                                       renewable energies, gas-turbine power plants or heating oil power
                                                                                       plants are added. They are deployed less frequently but are essential
                                                                                       in order to provide the volume of electricity demanded at any time.
1) Preliminary figures                                                                 Pumped storage power plants also fulfil an important function within
2) At 31 Dec. 2019, not incl. feed-in from electricity storage facilities
                                                                                       the electricity system as electricity storage facilities which can then
                                                                                       cover demand for electricity at short notice.
Source: BDEW; Status 03/2020

26
OPERATION OF POWER PLANTS
                                                                           Nuclear energy has the highest capacity utilisation

The usage of the German electricity industry’s power stations differs          Annual full load hours1) 2) 2019
widely. Nuclear power stations, together with lignite-fired power              General supply
stations, biomass plants and run-of-river power plants generate
electricity for consumers almost around the clock. During the day,
                                                                               Nuclear energy           7 460
hard coal and natural gas-fired power stations are deployed to meet
                                                                               Lignite                  5 570
any additional demand. Oil-fired plants, storage facilities and pumped
                                                                               Biomass                  5 080
storage plants are normally only used to cover peaks in demand.
                                                                               Hydropower               3 550
                                                                               Wind power: offshore      3 510
In addition, wind and photovoltaic installations today generate
                                                                               Natural gas              3 290
considerable volumes of electricity. Their capacity is, however,
                                                                               Hard coal                2 500
not available at all times. Their deployment depends on weather
                                                                               Wind power: onshore       1 880
conditions and therefore cannot be scheduled in advance.
                                                                               Mineral oil               1 630
Furthermore, their location plays a role: wind plants in coastal regions
or offshore, for example, are usually utilised to a greater extent than        Photovoltaics              960

those further inland.

In order to demonstrate the large differences within the generating
fleet, the “annual full load hours” are calculated. They show how
many of the 8 760 hours in a year a power plant would have to be
operated at maximum capacity to generate its annual output. The
actual annual period of utilisation is usually higher as power plants          1) Preliminary figures
                                                                               2) Significant changes in capacity during the period duly taken into account
are not always operated at full capacity.

                                                                               Source: BDEW; Status: 05/2020

                                                                                                                                                         27
ELECTRICITY EXCHANGE WITH OTHER COUNTRIES
Germany is the European hub for electricity

Physical electricity exchanges between Germany                                   With its central location in Europe, Germany is the hub for
and its neighbouring countries in 2019 (bn kWh)                                  European electricity flows, directly exchanging electricity with nine
                                                          0.6 S                  neighbouring countries. A major part of these cross-border flows
                                 3.1         DK
                                                                                 does not constitute contractually agreed deliveries but transit
                                                                                 quantities and loop flows.
                                       6.5
                                                    1.3

                                                                          PL
     NL                                                                   0.1

           5.4

                                                                  10.1
                         11.1

                                                     7.4

     L 5.3                                                         3.4

     0.8           2.8                                             CZ

            15.2                                  16.7                              Exports 74.5 bn kWh
                           14.0
      F                                                                  4.1        Imports 39.6 bn kWh

                                                                          A
                    CH          6.1                                             Source: BDEW; Status: 01/2020

28
PEAK ELECTRICITY DEMAND
                                                                            Consumer demand to be met by power stations

In 2018, the highest level of electricity demand from consumers and          Power balance of general electricity supply in Germany
the greatest challenge for power stations occurred on 7 February             at the time of the 2018 annual peak load (GW)
at 7:00 p.m. A certain proportion of the generating capacity is not                                           206.8 Total generating capacity
available at all times. Reasons for this can include low water flow, lack
of wind, little or no sunshine, the daily limits of electricity storage
facilities, district heat extraction leading to a reduction of output or                                       77.0 Non-usable capacity
regulations imposed by public authorities.
                                                                                                                1.6    Outages
At the time of the annual peak load in 2018, the remaining capacity                                              7.1   Maintenance and overhauls
                                                                                                                3.7    System services reserve
was sufficiently high as a medium volume of wind power was being                                              117.4    Firm capacity at the time peak
fed-in at that time and conventional power plants were, for the most                                          		       load actually occurs1)
part, available. That is not always the case, however: in times of
                                                                                                                  38.5 Remaining capacity1)
very cold weather, low wind levels and high electricity demand - as
can be quite possible during the winter – the peak load would have
been 81.6 GW and the firm capacity only 81.9 GW as it would almost
exclusively be conventional power stations which were available to
                                                                                                               78.9 Load
meet the electricity demand.

                                                                                                              28/02/2018, 7:00 p.m.

                                                                             1) Incl. grid reserve power plants/stand-by backup

                                                                             All capacity values are net values; rounding differences possible.

                                                                             Source: Transmission network operators; Status: 02/2020

                                                                                                                                                        29
GAS STORAGE FACILITIES IN GERMANY
Secure natural gas supply

Locations of German underground natural gas storage                                    The 47 German underground gas storage facilities at 33 different
                                                                                       locations, are able to receive almost 24 billion cubic metres of
                                                                                       working gas. This corresponds to just over a quarter of the volume of
                                                                                       natural gas consumed in Germany in 2019.
                                                             Rostock

                                          Hamburg
                                                                                       Overall, the German gas industry has the largest storage volume in
                                 Bremen
                                                                                       the European Union.

                                      Hanover
                                                                             Berlin

             Dortmund
                                                                       Leipzig

            Cologne
                                                                             Dresden
                                                    Erfurt

                          Frankfurt

                                                    Nuremberg
           Saarbruecken

                                  Stuttgart

                                                         Munich
                      Freiburg

Sources: LBEG, BDEW; Status: 03/2020

30
GAS SALES
                                                                         Industry is the largest consumer of natural gas

Natural gas sales in Germany amounted to 957 bn kWh in 2019.              Natural gas sales in Germany over time (bn kWh)
Industrial companies continue to account for the largest share, at
38 per cent. The proportion accounted for by households, which can
vary greatly from year to year depending on the weather conditions,      1 000          990
                                                                                                                                        943     935   957
                                                                                 905          908     915    919                 917
was 30 per cent.                                                                                                         850
                                                                                                                   829
                                                                          800
Sales of natural gas in 2019 varied across the individual customer
groups. The use of natural gas in power and heating plants of the         600
energy suppliers showed the greatest increase, with a rise of ten per
cent. The demand from industry had already been falling slightly since    400
the end of 2018 due to the slowing economy. Sales to commerce,
trade, services and even to private households and housing                200
companies increased slightly due to the at times cooler weather and
a growing number of buildings heated by natural gas. At the end of          0
                                                                                 2009 2010 2011 2012 2013 2014 2015 2016 2017 2018 20191)
2019, just over 20.9 million homes were equipped with gas heating.
That represents almost half of all homes in Germany. On the new-
                                                                                 Industry                                      Electricity supply2)
build market, natural gas heating systems (including biomethane)
                                                                                 Private households and housing cos.           Heating and cooling supply2)
were installed in almost 37 per cent of homes. Just as relevant is the
                                                                                 Commerce, trade, services                     Transport
growth in households supplied with district heating, since in 2019
around 44 per cent of district heating is generated from natural          Natural gas sales does not include own consumption by gas industry.
gas. The trend in the sales figures over the last ten years has been
characterised by the economic crisis in 2008/2009, different weather      1) Preliminary figures
                                                                          2) Incl. CHP units < 1 MW
conditions in the heating periods as well as political influences such
as the 2016 KWKG-Amendment.                                               Source: BDEW; Status: 02/2020

                                                                                                                                                        31
ELECTRICITY CONSUMPTION
Industry uses almost half of the electricity produced

Net electricity consumption in Germany                                              In 2019, net electricity consumption in Germany amounted to almost
(bn kWh)                                                                            512 bn kWh. It has been the case for years that industrial businesses
                                                                                    have accounted for the highest proportion of electricity demand, at
600                                                                                 46 per cent. The previously second largest consumption sector, private
             541   536    534    535                 526     527
       509                             523   523                    522    512      households, was overtaken some years ago by the sector, commerce,
500                                                                                 trade, services including farming, which today accounts for just
                                                                                    over 27 per cent of electricity consumption. Almost a quarter of the
400
                                                                                    electricity in 2019 was used by the just over 41 million households in
300                                                                                 Germany. As in the previous year, two per cent of consumption was
                                                                                    accounted for by transport, which includes the operation of railways
200                                                                                 and electromobility. Electricity volumes which industry, households
                                                                                    and commercial companies generate themselves and use immediately
100
                                                                                    on site are always included in those figures, hence they are referred to
  0                                                                                 as consumption and not sales.
      2009 2010 2011 2012 2013 2014 2015 2016 2017 2018 20191)

                                                                                    In comparison to the previous year, electricity consumption of
                                                                                    the individual customer groups in 2019 was very varied. Whilst the
                         Industry (mining and manufacturing)
                                                                                    electricity consumption of industrial businesses fell sharply, households
                         Households
                                                                                    only used slightly less than in 2018. The commerce, trade and services
                         Commerce, trade, services
                                                                                    sector consumed around the same amount as in the previous year.
                         Transport
                                                                                    Consumption in the area of road transport increased by just over two
                                                                                    per cent. The falling trend in electricity consumption in recent years is
                                                                                    primarily due to efficiency gains.
Source: BDEW; Status: 02/2020                              1) Preliminary figures

32
DISTRICT HEATING/COOLING SALES
                                                                    More and more households supplied with district heating

In 2019, grid-bound heating/cooling sales amounted to 124 bn kWh.             District heating sales1) in Germany (bn kWh)
51 bn kWh of that was sold to private households directly or to housing
companies for supplying residential buildings. Industrial consumers
used 47 bn kWh of heating energy. The heating consumption of                  160
other consumers amounted to around 26 bn kWh.                                 140             136
                                                                                       125                  127    128                                  124
                                                                                                     123                              121   121   123
                                                                              120                                        114   116
Whilst the proportion of district heating used by private households is
strongly dependent on the weather and a steady construction of new            100

homes heated by district heating, the proportion of consumption                80
accounted for by industry commerce, trade, services and other                  60
consumers has remained more or less stable over time.
                                                                               40

In private households, district heating is used for the most part for          20

space heating. Heating consumption in industry tends to be more                  0
                                                                                     2009 2010 2011 2012 2013 2014 2015 2016 2017 2018 20191)
dependent on economic developments; manufacturing businesses
tend to use district heating and district cooling in industrial
processes. In the commerce/trade/services sector, in addition to the
                                                                                                           Industry
use for space heating, use for heating water and for other heating
                                                                                                           Private households incl. housing companies
and cooling processes also plays a role.
                                                                                                           Other

In 2019, the number of households supplied by (district) heating
networks was 5.9 million and as such 17 per cent higher than the              1) Incl. district cooling
                                                                              2) Preliminary figures
number in 2009 (5.1 million).
                                                                              Sources: Destatis, BDEW; Status: 02/2020

                                                                                                                                                         33
SPACE HEATING MARKET
Every second home heated by natural gas

Heating systems in existing homes1) in Germany by energy                           The number of housing units heated by natural gas reached just over
source (per cent)                                                                  20.9 million in 2019. That corresponds to a market share of 49.5 per
                                                                                   cent of the just over 42 million homes. 11.7 million housing units (25.3
100                                                                                per cent) were heated by fuel oil. The share of housing units supplied
          6.5                                                             6.2
 90       4.9                                                         2.4 2.6      with district heating rose to 14.0 per cent. Electricity was the source
          12.3                                                           14.0      of power for heating in 2.6 per cent of dwellings.
 80
 70
 60                                                                         25.3   The share of dwellings heated with electric heat pumps is climbing
         32.9
 50                                                                                steadily (2.4 per cent). The share accounted for by other solid fuels
 40                                                                                (primarily wood and wood pellets) was unchanged at 6.2 per cent.
 30
 20     43.4                                                                49.5
 10
  0
       1999 2001 2003 2005 2007 2009 2011 2013 2015 2017 2019

      Gas (incl. liquified gas and biomethane)      Electric heat pumps
      Fuel oil                                      Wood, wood pellets,
      District heating                              other biomass, coke/coal,
                                                    other heating energy
      Electricity

1) Number of homes in buildings with residential space; heating installed

Source: BDEW; Status: 01/2020

34
HEATING IN NEW-BUILDS 2019
                                                                       Natural gas remains most popular heating energy

In the new-build sector, natural gas (including biomethane) remains       Heating systems in new builds1) in Germany,
the most popular choice of heating energy. Natural gas heating            proportions of energy sources (per cent)
systems were planned for nearly 37 per cent of new homes approved
for construction in 2019. The proportion of planned new-builds to         100
                                                                                    5.0                                                            4.1
be heated with electric heat pumps is almost 30 per cent. At almost        90       0.8                                                            1.1
                                                                                 13.1
27 per cent, over a quarter of planned homes are to be heated by way       80                                                                   26.5
of district heating.                                                       70    23.9
                                                                           60
                                                                                                                                                29.8
Electric heating is planned for one per cent of new homes for which        50
permission has been granted. Wood and wood pellet heating systems          40
have a market share of four per cent. Homes which are primarily            30
heated with solar heating and passive houses account for just over         20    50.9                                                           36.8
one per cent. Heating oil accounted for a 0.5 per cent share of new        10
builds in 2019.                                                             0
                                                                                2009 2010 2011 2012 2013 2014 2015 2016 2017 2018 20192)

In 2019, planning permission was granted for a total of around
348 000 new homes in new buildings to be constructed. Compared                            Gas (incl. biomethane)           Fuel oil

to 2018, that represents a rise of 3.6 per cent.                                          Electric heat pumps              Wood/wood pellets
                                                                                          District heating                 Other
                                                                                          Electricity

                                                                          1) New-builds with planning consent; primary heating energy
                                                                          2) Preliminary figures

                                                                          Sources: Statistical Offices of the German Laender, BDEW; Status: 04/2020

                                                                                                                                                      35
ELECTRICITY CONSUMPTION OF HOUSEHOLDS
Almost ten per cent lower than 10 years ago

Electricity consumption by area of use (per cent)                               Electronic entertainment devices and communications devices
                                                                                today account for a large share of electricity consumption in private
                                                                                households, namely 17 per cent.
                                          6
                            17
                                                    12                          Cooling and freezing appliances have become considerably more
                                                                                efficient in recent years. Currently, the proportion of energy used for
                                                                                cooling and freezing, as well as other process cooling applications, is
                8
                                    2018:                                       22 per cent.
                                   126.6 bn
                4                    kWh
                                                                                The greatest share, however, is still accounted for by process
                1
                                                         30
                                                                                heating, at 30 per cent. Included within this are all applications
                                                                                which require heat, such as electric hobs, tumble dryers and toasters
                       22                                                       but also hairdryers. The heating of water in washing machines and
                                                                                dishwashers is also covered.

      Heating                                 Air conditioning                  At eight per cent, the proportion of electricity consumption
      Hot water heating                       Mechanical household appliances   accounted for by lighting is low. Today, LED lights in particular have
      Cooking, heating, ironing,              Lighting                          established themselves as especially efficient and long-lasting
      and other process heating
                                              Information and communication     alternatives.
      Refrigeration and freezing,
      appliances, other process cooling
                                                                                Overall, despite the rising numbers of households, electricity
                                                                                consumption has fallen by nearly ten per cent over the last ten years.

Source: AGEB; Status: 02/2020

36
ELECTRICITY DEMAND OF HOUSEHOLDS
                                         Growing number of one-person households increases demand for electricity

Of the around 41.5 million German households, there are 17,4 million       Average electricity use1) per household, by size of household
one-person households today, which amounts to 42 per cent. By
way of comparison: in 1991 this figure was 34 per cent. The average
household size has shrunk: in 1991, there was an average of 2.27           5 000                                                          4 940

people per household compared to only 2.00 people in 2019. The rising      4 500
                                                                                                                        4 050
number of people living alone increases the electricity consumption        4 000
of German households. Someone living alone in Germany uses, on             3 500                        3 440
average, 2 050 kWh of electricity in a year. A two-person household        3 000
uses around 3 440 kWh of electricity. The consumption per head is          2 500
thus 1  720 kWh, a value which decreases consistently as the size                      2 050 2 050
                                                                           2 000                                1 720
of the household increases. A family consisting of three people
                                                                            1 500                                               1 350             1 235
consumes an average of 4 050 kWh of electricity per year and a four-
                                                                           1 000
person household consumes 4 940 kWh.
                                                                             500

These reference values can help households to identify potential               0
                                                                                         1 person         2 people       3 people           4 people
savings in their own electricity use. It is important, however, also to                                                                     or more
consider regional differences. For example, households in the east
                                                                                    Annual electricity consumption      Annual electricity consumption
of Germany use on average around 20 per cent less electricity than                  per household                       per household member
those in the west. The key reasons for this are a smaller average size
of dwelling and lower numbers of electrical appliances and devices.

                                                                           Sources: BDEW, HEA                                     1) Excl. heating in kWh

                                                                                                                                                          37
NATURAL GAS IMPORT PRICES
Border prices in 2019 lower than ten years previously

BAFA border prices for natural gas –                                                                              The statistical average price of all imports by gas suppliers into
figure for first month in each quarter (cents/kWh)                                                                Germany reached a peak level at the end of 2008. From 2012 to 2016
                                                                                                                  it fell continuously and has remained at a lower level since then. In
4.00                                                                                                              mid-2019, import prices even reached the lowest value of the ten
                                                                                                                  years previously.
3.50
        3.00
3.00                                                                                                              The main influences on the trend in prices are factors such as the
                                                                                                                  worldwide demand for energy, especially in fast-growing economies
2.50
                                                                                                                  like China or India, and the availability of unconventional natural gas,
2.00                                                                                                              in particular in the USA.
                                                                                                         1.51
1.50
                                                                                                                  The average values given here do not enable a direct conclusion to
1.00                                                                                                              be drawn on the underlying contracts concluded between the natural
0.50                                                                                                              gas importers and foreign natural gas producers. Different durations
                                                                                                                  and conditions are stipulated in these contracts so that the import
0.00
                                                                                                                  prices actually paid may, in some cases, deviate considerably from
     Jan 09

               Jan 10

                        Jan 11

                                 Jan 12

                                          Jan 13

                                                   Jan 14

                                                            Jan 15

                                                                     Jan 16

                                                                              Jan 17

                                                                                       Jan 18

                                                                                                Jan 19

                                                                                                         Jan 20

                                                                                                                  the average price.

Source: BAFA; Status: 03/2020

38
NATURAL GAS PRICES FOR HOUSEHOLDS
                                                                                                                                Still at a low level

The natural gas price for households has fallen in the past year by        Average monthly bill for a single family household (euros)
almost three per cent, primarily due to the lower costs of gas for         Single family house, natural gas central heating with hot
suppliers. With that, it is around 17 per cent lower than 2008 levels.     water heating, annual consumption 20 000 kWh
A household that was paying over 120 euros per month for a single-
family home with natural gas heating back then, pays only around
100 euros today.
                                                                            121
                                                                                              113     109
Within that bill, natural gas procurement and sales account for almost              106                                                   103
                                                                             24 %                                98                               100
                                                                                               25 %                      96       97
half of the sum. Network charges, taxes and levies each account for                  25 %               25 %
                                                                                                                  26 %                     25 %    26 %
                                                                                                                          26 %     26 %
just over a quarter of the natural gas price.                                20 %
                                                                                     23 %      21 %     23 %
                                                                                                                                           25 %
                                                                                                                  27 %    28 %     26 %            27 %
The largest part of the taxes and levies is value added tax, at 16 euros
per month. In addition, there is natural gas tax (0.55 cents per kWh)        56 %
                                                                                     52 %
                                                                                               55 %     52 %
                                                                                                                  47 %    46 %     48 %    50 %    47 %
at just over nine euros per month as well as the concession fee at
50 cents per month. Heating gas customers are generally special-rate
customers. Therefore, they only have to pay the reduced concession          2008    2010     2012     2014       2016    2017     2018    2019    2020
fee in the amount of 0.03 cents per kWh.

                                                                                            Procurement, sales
                                                                                            Network charge incl. metering, operation of meters
                                                                                            Taxes and duties

                                                                           Source: BDEW; Status: 01/2020

                                                                                                                                                         39
ELECTRICITY PRICES FOR HOUSEHOLDS
53 per cent is taxes, levies and surcharges

Average electricity bill for a household with an annual                                                               In 2020, an average household pays more than 91 euros per month
consumption of 3 500 kWh (euros)                                                                                      for electricity. This represents an increase of three per cent year on
                                                                                                                      year. The pure electricity price – before taxes, levies and surcharges
                                                                              Change in comparison to 1998            – is just over 43 euros per month which is just 14 per cent higher
100                                                                                                                   than 1998 levels. Almost 21 euros of that amount is for electricity
90                                                                                            88.84 91.50             procurement and sales, just over 22 euros is for network charges.
                                                                      85.00           85.94
                                                                              83.99                          +83 %
80                                                            75.51
70                                                    69.09                                                           State levies rose again in 2020. The EEG-surcharge continues to
                                              63.15
60                            52.39 56.76
                                                                      44.13 45.29 46.60 46.61 48.07
                                                                                                             +305 %   represent the largest proportion of such charges, at 6.76 cents per
      49.90                                                   33.79
50                    46.99
                                              24.88
                                                      28.20                                                           kWh. Since 1998, the monthly amount paid by the average household
         40.66                        22.20
40 11.87                      20.36                                                                                   for taxes, levies and surcharges has increased from 12 to 48 euros,
                      18.32
30            15.14                                                                                                   meaning it has quadrupled. These governmental levies currently
20
      38.03                   32.03 34.56
                                              38.27 40.89 41.72 40.87 38.70 39.34 42.23 43.43
                                                                                                             +14 %
                                                                                                                      account for 53 per cent of the electricity bill of an average household
 10           25.52 28.67                                                                                             (1998: 24 per cent).
 0
      1998

               2000

                      2002

                              2004

                                      2006

                                              2008

                                                      2010

                                                              2012

                                                                      2014

                                                                              2016

                                                                                      2018

                                                                                               2019

                                                                                                      2020

              Procurement, network charge, sales

              Taxes, levies and surcharges: EEG-surcharge, KWKG-surcharge,
              “Article 19 StromNEV-surcharge”, offshore-liability surcharge,
              surcharge for sheddable loads, electricity tax, concession fees, VAT

Source: BDEW; Status: 01/2020

40
ELECTRICITY PRICES FOR INDUSTRY
                                                                                          Taxes, levies and surcharges remain high

The liberalisation of the German electricity market in 1998 triggered        Trend in industry electricity prices1)
a drive towards optimisation and efficiency in the electricity industry
and initially led to a Germany-wide price reduction.
                                                                             190
                                                                                                                                                           176     181    182
However, the growth in worldwide energy demand led to a                      180
considerable price increase up to autumn 2008. As a result of the            160                                                            148 150
economic crisis in 2009, electricity prices for industrial customers                                                                 137                           44% 46%
                                                                             140                                       129                                 45 %
initially fell. However, the downward trend in prices was counteracted       120                                110 11 %
                                                                                                                          116
by the rise in levies imposed by the state: the levies imposed on one                                                         30 % 50 % 50 %
                                                                                   100                                   20 %
                                                                             100
kilowatt hour of electricity for an industrial business under the EEG,                                   82
                                                                              80                  70
the KWKG, the surcharge under Article 19 of the Network Charges                            62
                                                                              60
Ordinance (“Article 19 StromNEV-surcharge”), the offshore network
surcharge, the concession fee and the surcharge for sheddable loads           40

remained high in 2020 at around 7.8 cents per kWh. Their share of             20
the industrial electricity price is 46 per cent and is thus considerably       0

                                                                                   1998

                                                                                           2000

                                                                                                  2002

                                                                                                         2004

                                                                                                                2006

                                                                                                                       2008

                                                                                                                              2010

                                                                                                                                     2012

                                                                                                                                            2014

                                                                                                                                                   2016

                                                                                                                                                            2018

                                                                                                                                                                   2019

                                                                                                                                                                          2020
higher than in the first ten years after liberalisation.

In addition, there is an electricity tax, although this is partly                     Procurement, network charge, sales                                  Index: 1998 = 100
reimbursed to industrial enterprises.                                                 Taxes, levies and surcharges: EEG-surcharge, KWKG-surcharge,
                                                                                      “Article 19 StromNEV-surcharge”, concession fees,
                                                                                      offshore-liability surcharge, surcharge for sheddable loads
                                                                             1) Supply from the medium-voltage level, not incl. electricity tax and
                                                                                turnover tax

                                                                             Sources: VEA, BDEW; Status: 01/2020

                                                                                                                                                                           41
You can also read