Green Bank and Green Jobs

Page created by Jesse Vega
 
CONTINUE READING
Green Bank and Green Jobs
Updated February 12, 2010

                    Green Bank and Green Jobs

                               Presentation to NARUC

Todd Filsinger                           Reed Hundt                               Ken Berlin
Co-Chairman                             Co-Chairman                         General Counsel
Coalition for the Green Bank    Coalition for the Green Bank    Coalition for the Green Bank
todd.filsinger@paconsulting.com    rehundt@yahoo.com           Kenneth.berlin@skadden.com
303 884 5948                            202 494 4111                            202 371 7350
                                                                                         1
Green Bank and Green Jobs
How does the Green Bank work with state utilities?

   -We want a Green Bank (or CEDA as it is called in the Senate) to be part of
   the next round of the Jobs Bill to be passed in the Senate. We want your
   help.

   -The reason we think that a CEDA/Green Bank can help you is that CEDA
   would be or should be authorized to loan to the efficiency programs and the
   RES programs that state regulators would authorize. Whatever you would
   decide, the CEDA/Green Bank’s funds would be there to help your firms—
   ESCOs or utilities—comply. This could make it easier for your rules to be
   accepted by industry; it could make it easier for you to pass the rules you
   might want.

   -We know that the Federal Government often issues mandates and expects
   states to comply. The CEDA/Green Bank is a way to help states enforce
   their own mandates and effect the changes that they choose to make.

   -State regulators know as much or more about how to effect change in
   energy markets than anyone on the Hill. Let us help you and work with you
   to effect that change-where and when you wish.
Green Bank and Green Jobs
To put millions to work, we have to finance retrofit and clean
energy generation by a Green Bank and favorable tax treatment

   ! Making Large Progress Against A Nine Million Jobs Goal Requires
     Large Scale Retrofitting of Buildings

   – A Large Jobs Goal Requires a Significant Replacement of Carbon –
     Intensive Electricity Generation with Clean Alternatives

   – Achieving Large Scale Retrofit and Clean Energy Replacement Without
     Harming Consumers and With Profitability for Investors Requires Low-
     cost Financing As Well As Favorable Tax Treatment

                                                                        3
Green Bank and Green Jobs
Making Large Progress Against A Nine Million Jobs Goal Requires
Large Scale Retrofitting of Buildings

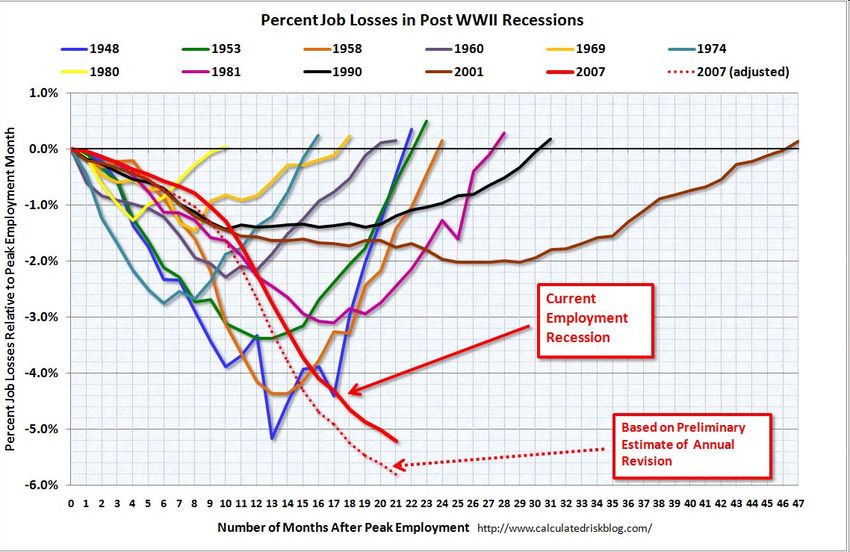
   •   We are at least nine million jobs short of full employment

   •   Efficiency: Why have the Green Bank provide for energy efficiency projects?

   •   The Green Bank should create incentives for willing utilities to pay for
       retrofits…without harming consumers

   •   The Green Bank alternatively could create incentives to cause Energy Service
       Companies (ESCOs) to pay for retrofits at no up-front cost to the homeowners

   •   Why are we here?

   •   The Green Bank would use existing programs for guidance as well as for
       immediate dispersal of funds

   •   Almost all retrofit programs to date have been small scale

                                                                                      4
Green Bank and Green Jobs
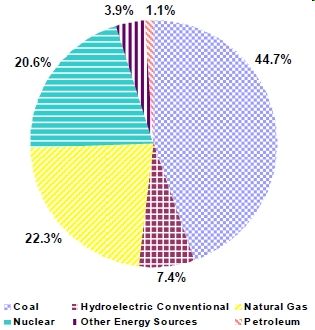
The gap between actual and full employment is at least 9 million
jobs

            "   Sector             August 2008 employment (in 000s)           August 2009 employment (in 000s)
            "   Total Private             114,497                                 108, 736
            "   Mining                         787                                       707
            "   Construction                7,177                                      6,093
            "   Manufacturing             13,387                                   11, 771
                           http://blogsandwikis.bentley.edu/themoneyillusion/?p=2473
                                                                                                                 5
Green Bank and Green Jobs
Efficiency: Why have the Green Bank provide for energy efficiency
projects?

•     One of the biggest barriers to comprehensive residential retrofits is the up-front cost
      to homeowners.

•     The adoption of a federally financed loan program with short timelines for loan
      disbursement will create jobs in the near term because it will give contractors and
      ESCOs the confidence they need to start hiring and training workers in preparation
      for a greatly expanded retrofit market and to manufacturers to increase production
      capacity for efficiency products.

•     A robust loan program is a unique opportunity to create jobs, put more money in the
      hands of consumers through reduced electricity bills while increasing their comfort,
      and increase the value of existing residential properties.

•     Last year, according to the Department of Energy, only 20,000 homes¹ were
      comprehensively retrofitted in the United States, out of 76 million residential buildings.

    ¹Department of Energy: Building America DE-FOA-0000099                                      6
Green Bank and Green Jobs
The Green Bank should create incentives for willing utilities to pay
for retrofits….without harming consumers
                                  Green Bank
                                                       6. After the loan is repaid, the consumer sees the full
                                                       benefit of the efficiency measures, the utility has saved
  1. The Green Bank                                    money and created local jobs, and the taxpayer has
  loans 125% of the cost                               been repaid in full.
  of an energy efficiency
  project to a utility at a
  low rate.

                                                       5. The utility uses the extra 25% financing to
                                      Utility/Co-op    make their operations and facilities more
 2. The utility disperses the
 funds to install energy                               efficient.
 efficiency measures in
 homes and small                                                                      4. Through on-bill financing, a
 businesses, creating jobs                                                            portion of the savings shows up on
 in the local community.                                                              the consumer’s bill, and the rest is
                                                                                      transferred to the utility, which uses
                                                                                      the money to repay the initial loan
                       Residential property/ Small business                           from the Green Bank over an
                                                                                      extended tenor. (For example, if
                                                                                      there is a savings of $100/month,
                                                                                      the consumer receives a $25
                                                                                      discount on the bill and the utility
                                                                      Energy Bill     charges $75 for electricity that is
                                                                                      not being provided in order to re-
   3. The owner of the residence/small                                                pay the loan). The utility will also
   business pays no up-front cost to have their                                       have the right to place a lien on the
   building retrofitted, and sees a reduced                                           property in order to obtain
   energy bill.                                                                       payment.                            7
Green Bank and Green Jobs
The Green Bank alternatively could create incentives to cause
Energy Service Companies (ESCOs) to pay for retrofits at no up-
front cost to the homeowners
                                  Green Bank           5. After the loan is repaid, the consumer sees the full
                                                       benefit of the efficiency measures, the ESCO has
 1. The Green Bank                                     created local jobs and the taxpayer has been repaid in
 loans the cost of an                                  full.
 energy efficiency
 project to an ESCO at
 a low rate of interest.

                              Energy Service Company (ESCO)
2. The ESCO disperses                                                               4. The ESCO then negotiates with
the funds to install energy                                                         the utility for the utility to obtain
efficiency measures in                                                              online payment of the bill through
homes and small                                                                     on-bill financing, and transfer funds
businesses, creating jobs                                                           to the ESCO, or the ESCO agrees
in the local community.                                                             with the consumer that the ESCO
                                                                                    will receive direct payment from the
                                                                                    consumer. (For example, if there is
                       Residential property/ Small business                         a savings of $100/month, the
                                                                                    consumer receives a $25 discount
                                                                                    on the bill and utility charges $75
                                                                                    for electricity that is not being
                                                                                    provided to re-pay the loan). The
                                                                     Energy Bill
                                                                                    ESCO will also have the right to
    3. The owner of the residence/small                                             place a lien on the property in order
    business pays no up-front cost to have their                                    to obtain payment.
    building retrofitted, and sees a reduced
    energy bill.
                                                                                                                      8
Why are we here?

  -We are looking for your (NARUC's) feedback on whether or not we have constructed our proposal correctly
  -We are proposing that a Green Bank be chartered to finance clean energy generation and energy efficiency
  projects
  -We are here today to discuss the method with which the Green Bank would execute financing energy efficiency
  projects in homes and small and large businesses on a massive scale across the country
  -The Green Bank would lend to utilities, energy service companies (ESCOs), and other pre-existing mechanisms
  on a state level (PACE programs, etc) at a very low rate (25-100 basis points over Treasury rates).
  -The Green Bank would loan 125% of the total cost of the project to the service provider; the utility could use the
  extra money loaned at a low-rate to improve the efficiency of their own operations, therefore saving money for
  themselves

  - The Green Bank would lend 100% of the cost of the retrofit and repayment would be limited to the amount of
  energy efficiency savings. We would work with utilities to develop protocols to measure the energy efficiency
  savings and and to develop very clear disclosure language to explain the savings to ratepayers

  - For example, if a retrofit produced a monthly savings of $100 in energy savings to an occupant, the occupant bill
  would be reduced by let's say $15 -$25, but the bill would not be reduced by the remaining savings and the
  remaining $75 - $85 would be used to repay the Green Bank loan and, where permitted, to cover the utilities
  monitoring and verification costs. When the loan was repaid, the occupant would realize the full $`00 benefit of the
  savings brought by the retrofit

  - The loan could be secured by a lien with the same type of restrictions as in PACE liens (but the lien would not be
  a tax equity lien as in PACE)

  - In states with decoupling, no lien would be necessary

  -Ideally , the money would be repaid to the Green Bank through on-bill financing. As described above the
  consumer would see a decrease in his rates immediately after the retrofit is completed.
The Green Bank would use existing programs for guidance as well
as for immediate dispersal of funds
•   The program which the Green Bank is proposing is very similar in structure to PACE (Property
    Assessed Clean Energy) retrofit finance proposals.

•   PACE programs provide 100% long term financing for retrofits financed by municipal bonds and
    secured by liens (tax liens in the case of PACE).

•   The PACE program places tax liens on property to ensure that the long term loans allowed by the
    program are repaid. In 2008, the program was authorized in only 2 states. 14 more states
    authorized the program in 2009 and many more are expected to follow this year.

•   In many ways the Green Bank program is identical to the PACE program, but the Green Bank
    program has significant advantages. The PACE programs will be implemented locally by creating
    special local municipal taxing districts which will issue local bonds so it looks like it will take a very
    long time to set up and fund these programs and they thus won't be implemented in a systematic
    way. The Green Bank program could be implemented much more efficiently and with much more
    flexibility. For example, where PACE programs are in place, the Green Bank could help fund
    those programs.

•   Utility retrofit programs are also critical to bringing energy efficiency programs to scale.

•   The Green Bank proposal would fund and strengthen many different types of retrofit programs,
    including PACE programs and utility retrofit programs, and by providing 100% of the funding
    needed by utilities to implement these programs, will enable implementation without raising utility
    rates.

•   In states where efficiency is not easily done through utilities, we would implement the program
    through ESCOs, state programs, etc. so we will be able to implement the program in all 50 states.
                                                                                                    10
Almost all retrofit programs to date have been small scale

•     Of 76 million residential buildings, according to the Department of Energy only 20,000
      buildings were retrofit in 2008

•     Most of these programs have failed because of resistance by homeowners and small
      business owners to making up front payments that are not recovered for several
      years.

•     Programs that do not address this issue are likely to fail with implementation limited
      mostly to high income, immobile homeowners.

•     Programs that address this issue by providing 100% financing for retrofit projects like
      the PACE programs and the Green Bank retrofit program will be able to be brought to
      scale quickly

•     The Green Bank program would supplement and make the Home Star program far
      more effective.

                                                                                               11
    Source: Building America DE-FOA-0000099
To put millions to work, we have to finance retrofit and clean
energy generation by a Green Bank and favorable tax treatment

   – Making Large Progress Against A Nine Million Jobs Goal Requires
     Large Scale Retrofitting of Buildings

   ! A Large Jobs Goal Requires a Significant Replacement of Carbon –
     Intensive Electricity Generation with Clean Alternatives

   – Achieving Large Scale Retrofit and Clean Energy Replacement Without
     Harming Consumers and With Profitability for Investors Requires Low-
     cost Financing As Well As Favorable Tax Treatment

                                                                        12
A Large Jobs Goal Requires a Significant Replacement of Carbon
Intensive Electricity Generation with Clean Alternatives

  •   The existing structure and function of the energy sector does not produce
      significant new investment and thus does not lead to new job creation

  •   To put millions to work in the energy sector, we must aim to…

  •   The requisite investment can be driven by a renewable standard

  •   Wind, sun, biomass and natural gas are the most immediate alternatives for job
      creation in next three years

                                                                                       13
The existing structure and function of the energy sector does not
produce significant new investment and thus does not lead to new
job creation
•   Hard truths:

     –   Electricity demand will rise slightly in only a few state in next few years, and will stay flat or
         fall in most
            • Therefore new clean energy generation and transmission will find new demand only in a
                limited area
            • Any truly large scale clean energy generation/transmission must depend on replacing
                existing carbon-intensive energy sources by means of some governmental intervention

     –   Efficiency gains reduce electricity demand if successful or fail because of agency problems
           • Therefore sellers (merchants and utilities) need incentives to support efficiency
               measures that offset reduced demand, such as PACE programs

     –   Electricity consumers do not distinguish between clean and carbon-intensive electricity and
         prefer the lower priced version of these identical electromagnetic waves

     –   Even under Waxman-Markey, regulation does not cause the price of carbon-intensive
         electricity to rise significantly until 2020 or beyond

     –   Few if any innovation-driven cost reductions in clean energy generation/transmission will
         reduce the sector-specific (not including externalities such as pollution) economic cost of
         clean electricity below the similar cost of carbon-intensive electricity until 2012-2020.

                                                                                                        14
To put millions to work in the energy sector, we must aim to:

       •Replace carbon-intensive electricity with clean electricity

        This is where we get electricity from now, and we need 20 GW of clean
        electricity generation every year for 20 years in order to transition “from
        carbon to clean”
  http://www.eia.doe.gov/cneaf/electricity/epm/epm_sum.html                           15
  Current as of July 2009
The requisite investment can be driven by a renewable standard

•      We estimate that natural demand requires 10-20 GW of new capacity by 2015, and 60-70 GW by
       20201.

•      Current state RES call for approximately 25 GW of renewable capacity are needed by 2015 and
       64 GW by 20201,2. Temporary low cost financing will accelerate and assure compliance. Capital
       costs from compliance would probably be $60 - 100B by 2015 and $150-250B by 2020.

•      A national 20% RES with annual required steps could approximately double these estimates, and
       create more than an incremental one million jobs over the next three years. With low cost
       financing of retrofits and generation, compliance can be obtained and also electricity prices need
       not rise.

•      Utilities and regulators in different states should have flexibility in choosing among efficiency
       measures and types of generation.

•      Also, the renewable premium is the price
        of energy independence and a hedge
       against dollar devaluation relative to hard
       assets (oil).

    1Source:   PA Consulting
    2 RES   is usually a generation (MWh) target. GW estimates are based on assumptions regarding types of generation built   16
Four major clean energy industries (in addition to efficiency measures)
offer the most immediate job creation potential in the US…nuclear and
other advanced technologies would follow in 2012-22

Wind                                                                   Solar

                         The Four Horsemen of Clean Energy

Natural
 Gas                                                         Biomass   17
To put millions to work, we have to finance retrofit and clean
energy generation by a Green Bank and favorable tax treatment

   – Making Large Progress Against A Nine Million Jobs Goal Requires
     Large Scale Retrofitting of Buildings

   – A Large Jobs Goal Requires a Significant Replacement of Carbon –
     Intensive Electricity Generation with Clean Alternatives

   ! Achieving Large Scale Retrofit and Clean Energy Replacement Without
     Harming Consumers and With Profitability for Investors Requires Low-
     cost Financing As Well As Favorable Tax Treatment

                                                                        18
Achieving Large Scale Retrofit and Clean Energy Replacement
Without Harming Consumers and With Profitability for Investors
Requires Low-cost Financing As Well As Favorable Tax Treatment

•   With low-cost financing, the wholesale price of electricity can be maintained
    at 5-8 c/KWh in the US, whereas current market conditions produce
    wholesale electricity at a non competitive level of 11 c/KWh
•   Solar projects see a 60% drop in required price due to low-cost financing
•   Any debt financing has to vary state by state as prices vary radically state
    by states

•   If job creation is the target, the size of the job creation effort varies
    significantly state by state

•   The formula of job creation is simple and daunting
•   We need both energy efficiency and clean electricity generation in order to
    create the most jobs immediately, sustain those jobs in the long term, and to
    produce our own energy
•   The Coalition for the Green Bank is a group of businesses that support the
    creation of a Green Bank
                                                                                   19
With low-cost financing, the wholesale price of electricity can be maintained at
5-8 c/KWh in the US, whereas current market conditions produce wholesale
electricity at a non-competitive level of 11 c/KWh
   Assumptions:                             Case 2. High CapEx Green Bank             Case 5. 2009 Bank Financing
   Capital Expenditures             - $2,750/KW                                 - $2,750/KW
   Tenor                            - 20 Years                                  - 10 Years
   Wind Case / Coverage             - P90 Wind @ 1.0x Coverage                  - P99 Wind @ 1.0x Coverage
                                                                                                                            Prepared by a private
   Revenue Assumptions              1. $0.072 / KWh PPA @ P90,                  1. $0.112 / KWh PPA @ P90,                  equity firm based on data
                                        3.5% escalator                              3.5% escalator                          from a major independent
                                                                                                                            wind company
                                    2. $0.072 / KWh Merchant @ P50 - P90,       2. $0.112 / KWh Merchant @ P50 - P90,
                                        1.0% escalator                              1.0% escalator
   Balance @ Maturity               - Balance repaid in full                    - Balance repaid in full                    Notes:
                                                                                                                            -Assumes that all EBITDA from
   Interest Rate                    - 4.5%; 30yr Treasury + 25bps               - 8.5%; 30yr Treasury + 425bps                      the project is financeable
   Amortization Schedule            - No paydown year 1-9; then                 - Full Cash Sweep                           -All cases except case 5 assume
                                                                                                                                    20% project cost net of
                                      increasing over time                                                                          all tax benefits is paid in
   IRR to Equity Holder             - 15.5%                                     - 15.2%                                             equity
                                                                                                                            -CAPEX costs do not include
   Debt to Equity Ratio             - 4:1                                       - 3:2                                               transmission

                                                                                                                            1.      Monetizable tax
                                              $2,750/KW Estimated CapEx               $2,750/KW Estimated CapEx                     attributed (such as the
                                                        Interest   % of Total                   Interest   % of Total               1603 cash grant or a
                                                                                                                                    refundable ITC) does not
   Debt Security                            Amount        Rate        Costs         Amount        Rate       Costs                  include MACRS
   Project Costs                                $165.0                                    $165.0                            2.      Model assumes
                                                                                                                                    monetizable tax
                                                                                                                                    attributes can be
                                (1)(2)(3)                                                                                           monetized in year 1 of
   Monetizable Tax Attributes                     44.6                  27.0%               44.6                    27.0%
                                                                                                                                    loan, without cost
                                                                                                                            3.      MACRS is assumed to
   Bank Debt / Green Bank:                                                                                                          be utilized in the form of
                                                                                                                                    NOLS that are carried
    Bank Debt                                                                             72.0         8.5%         43.6%           forward
    Green Bank                                    96.4        4.5%      58.4%               72.0       8.5%         43.6%   4.      The IRR to equity holder
                                                                                                                                    is higher than the ~15%
                                                                                                                                    due to the non-
                                                                                                                                    financeable revenue
   Total Debt                                    $96.4        4.5%     58.4%              $72.0        8.5%       43.6%             streams
   Monetizable Tax Attributes                    $44.6                 27.0%              $44.6                   27.0%
   Total Equity                                  $24.1                 14.6%              $48.5                   29.4%                               20
Solar projects see a 60% drop in required price due to low-cost
financing

  With Green Bank Financing:                            -CAPEX reduction a result of Green
  Capital Expenditures: $2,400/kW                       Bank providing tax credits to
  Tenor: 20 years                                       manufactures
  Min. Coverage Ratio: 1.1
  PPA price: $0.08/kWh for 20 years escalated at 3.5%   -Cost of tax credit can be recouped
  Balance @ maturity: Balance repaid in full            through interest on loan to project
  Interest Rate: 4.85%
  Amortization Schedule: Mortgage                       -Longer maturities and lower
  IRR: 15%                                              coverage ratios will increase project
  Debt to Equity: 4:1                                   viability

 Without Green Bank Financing:
 Capital Expenditures: $4,000/kW
 Tenor: 10 year
 Min. Coverage Ratio: 1.2
 PPA price: $0.20/kWh for 20 years escalated at 3.5%
 Balance @ maturity: Balance repaid in full
 Interest Rate: 7.25%
 Amortization Schedule: Mortgage
 IRR: 15%
 Debt to Equity: 1:1

 Prepared by a major solar project developer
Any debt financing has to vary state by state as prices vary radically
state by states

                                                State by state electricity prices
                               WA                                                                                                          NH
                                                        MT                    ND                                                          VT ME
                           OR                                                               MN
                                          ID                                                             WI                                         MA
                                                                              SD                                                         NY
                                                          WY                                                          MI                              RI
                                                                                               IA                                    PA             CT
                                                                              NE                                                               NJ
                                NV                                                                                          OH
                                                                                                           IL       IN                        DE
                                               UT             CO                                                                 WV VA        MD
                     CA
                                                                                  KS             MO                      KY                   DC
                                                                                                                                     NC
                                                                                                                    TN
                                                                                     OK
                                          AZ               NM                                       AR                              SC
                                                                                                           MS       AL         GA
                                                                                                                                               Below 8 cents/kWh
                                                                               TX                   LA
                                                                                                                                               Between 8 - 9
                                                                                                                                               cents/kWh
                                                                                                                                    FL
                                                  AK                                                                                           Between 9 – 10
                                                                                                                                               cents/kWh
                                                                                                                       HI                      Between 10 – 11
                                                                                                                                               cents/kWh
                                                                                                                                               Above 11 cents/kWh

 Source: EIA. Retail rate represents all sectors (Residential, Commercial, Industrial and Transportation) Current as of 2007
                                                                                                                                                               22
…And if job creation is the target, the size of the job creation effort varies
   significantly state by state

                                         WA                                                                                                    NH
                                                                                                                                           VT       ME
                                                                     MT             ND
                                      OR                                                       MN
                                                      ID                                                                                              MA
                                                                                    SD                    WI                              NY
                                                                          WY                                         MI                                  RI
                                                                                                                                     PA               CT
                                                                                    NE          IA                                               NJ
                                            NV                                                                      IN    OH                    DE
                                                           UT                                                  IL
                                                                               CO                                              WV               MD
                                  CA                                                     KS                                          VA
                                                                                                    MO                   KY                     DC
                                                                                                                                    NC
                                                                                          OK                        TN
                                                       AZ
                                                                          NM                         AR                            SC

                                                                                                           MS       AL        GA
 Unemployment Rate
                                                                                    TX              LA
       10.1%                                                                                                        HI

                                                                                                                                                      23
Source: Bureau of Labor Statistics: http://www.bls.gov/web/laumstrk.htm
The formula of job creation is simple and daunting

•   E dollars of investment in efficiency measures or G dollars in generation replacement
    equals J new jobs: E plus G = J.

•   If J should be 50,000/month, then E + G must be $5 billion per month.

•   E can be no greater than the sum of approximately $2k/household and small
    business, or approximately $200 billion for approximately 100 million
    households/small businesses.

•   G can be no greater than approximately $400 billion, the cost of replacing about one
    half of all base load carbon-intensive generation capability, or about 200 gigawatts.

•   If E plus G equals $600 billion, then J would be six million jobs. To obtain one million
    jobs from efficiency and generation in the next few years will require $100 billion of
    private investment. To reach this target would require, then, about 20 million building
    retrofits (20m x 2k = $40b) and about 30 gigawatts of clean energy.
•   An RES, financed so as to use incentives to obtain compliance, would incentivize
    utilities to choose between retrofits and generation substitution to achieve this target.

                                                                                           24
We need both energy efficiency and clean electricity generation in
     order to create the most jobs immediately, sustain those jobs in the
     long term, and to produce our own energy
     Utilities                                                                                    Homes and
                                                                                                  Small
                          The utility makes loans to invest in energy                             Businesses
                          efficiency in homes and small businesses
                          in Youngstown, OH

                                                                                                 Local manufacturers
                                              Clean Energy Generation                            will produce parts to be
CEDA will                                                                                        used for retrofitting
provide low                                                                                      homes and small
cost, long       The utility will invest in                                                      businesses
term financing   creating new clean
so the utility   energy generating
can invest in    sources
energy
efficiency and                                                   Locally manufactured
develop new                                                      products will be purchased by
resources for                                                    clean energy generators
clean energy

CEDA                    Local manufacturers will obtain low cost loans or loan
                        guarantees from CEDA, and will be granted funds to                              25
                        purchase or convert to new machinery which will produce
                                                                                         Local Manufacturers
                        clean energy products.
The Coalition for the Green Bank is a group of businesses that
support the creation of a CEDA/Green Bank

A2 Energy Ventures (Mark Bold)                 Encomia, LP (William J. Eckert)                       New Cycle Capital (Josh Becker)
Abaris Realty, Inc. (Adam Landsman, Steve      Envision Solar International, Inc. (Robert Noble)     Nixon Peabody LLP (Rich Cogen)
Landsman)                                      Equilibrium Capital Group (Dave Chen)                 Pario Capital (Guy Piazza)
AES Corporation                                First Security Leasing, Inc. (Bryan Ryscavage)        Passport Capital (Ravi Anaparti)
AES Solar Energy Ltd. (Robert Hemphill)        Free Flow Power Corporation (Daniel Lissner)          Patton Boggs (Joshua Greene)
Alston & Bird (Bob Jones, Tom Amis)            Gas Turbines International, LLC (Larry Rayman)        Peregrine Energy Group, Inc. (Francis Cummings)
AMB International Finance, LLC (John E.        GE Energy Financial Service (Steve Taub)              Pillsbury Winthrop Shaw Pittman LLP (J. Todd Culwell)
Mullen, Raymond J. Albright)                   Global Energy, Inc (Harry Graves)                     PowerPlay Solar (Trevor Ugolyn, Jay Gromek)
American Council on Renewable Energy           Global Environmental Outreach & GeoConsult (Gregory   Principle Power (Jon Bonanno)
(ACORE) (Michael Eckhart)                      O'Reilly)                                             PSE&G (Ralph LaRossa)
Amperage Advisory Partners, LLC (Thomas R.     Good Energies Inc. (Greg Kats)                        Ra Power Solutions (Richard P. Benoit)
Rosen)                                         Green Harvest Technology (Dan Carol)                  RecycleBank (Preston Read)
AMSOLAR Corporation (Joshua Weinstein)         Green Partners (George Parker)                        Renewable Choice Energy (Justin Segall)
Applied Materials (William G. Morin)           GreenAtom LLC (Todd Greenhalgh)                       Renewable Funding LLC (Cisco DeVries)
Boyd Strategies (Steve Boyd)                   Greencore Capital (Gilbert Barnes)                    Renewable Ventures (Karin Berardo, Peter Conklin)
Brown Rudnick LLP (Alan N. Forman)             GreenWorld Capital, LLC (David W. Elkin, Michael J.   Riverstone Holdings (Michael Hoffman)
California Clean Energy Fund (Dan Adler)       Howe)                                                 Schwartz Communications (Jason E. Morris)
Carbon War Room (Ann Davlin)                   Helix Electric, Inc (Ken Emma)                        Serious Materials, CalStar, ZETA (Marc Porat)
Cavallo/Cross Hudson (Harold Borden)           Higher Power Energy, LLC (Mark Patkunas)              Sherman & Sterling LLP (Patricia G. Hammes)
Chadhourne & Parke LLP (Kenneth W.             International WoodFuels (Steven Mueller)              Solar Power Partners, Inc. (Genevieve Nowicki, Phil Henson)
Hansen)                                        Kanepi Innovations (Larry Leete)                      Solarsa, Inc. (Gregory Hilty, Scott E. Jorgensen)
Chinook Energy, LLC (William Gleason)          Konarka Technologies, Inc. (Howard R. Berke)          Strategic Energy Advisors, Inc. (Jeanine Hull)
City of Portland (Michael Armstrong)           Lane Powell (Karen Williams)                          Structured Finance International (Jeremiah White)
Clark Energy Group (Bryon Krug)                KRM Energy Advisors LLC (Ken Marks)                   Suntech America (K. Scott Son)
Clean Economy Network (Jeffrey King)           Latham and Watkins LLP (Mike Gergen)                  Sustainable Spaces (Matt Golden)
Coastal Securities (Scott W. Stafford)         Lennar Ventures (David Goodfriend)                    Tessera Solar (Kevin Scannell)
Commonwealth of Kentucky (Paul Kaplan)         MAPA Group (Michael Peck)                             The Roda Group (Dan Miller)
Continental Capital/GCMG (Nalin Meegama)       Meridian Circle Advisors LLC (Bryan Green)            Tioga Energy (Kristian Hanelt)
CURRENT Group, LLC (Tom Casey)                 Mesa Power Group, LLC (Monty Humble)                  Training, Resources and Consulting, Inc. (Kevin Douglas
Diversified Bio-Energy LLC (Marina I.          Mesirow Financial Consulting, LLC (John Oates)        Moran)
Mercado)                                       Metrus Energy, Inc. (Bob Hinkle)                      US Mainstream Renewable Power Inc. (Bruce Thompson)
Eagle View Capital Strategies (Andrew Kreig)   Mohave Sun Power LLC (Mitchell Dong, Robert Marsh)    Wellford Energy Advisors (Harrison Wellford)
EKO Asset Management Partners (Jason           National Cooperative Bank (NCB) (Andrew Kho, Romie    Williams Mullen (D. Cameron Prell)
Scott)                                         Basra)                                                Wilson Sonsini Goodrich & Rosati (Robert O'Connor)

                                                                                                                                                  26
Appendix

•   By using low cost financing, we will be imitating and competing with China

•   China uses low cost long term financing to lower the delivered price of wind electricity

•   RES is needed to drive demand for retrofits and clean energy, because only in a few western states is there
    natural new demand prior to 2015 and beyond
•   Large new capital expenditure in energy is feasible

•   By investing in efficiency and RES compliance over the next three years, we can increase emissions abatements

    while waiting for the effects of caps in the 2020s

•   A national RES with low cost financing will produce more jobs if regulatory flexibility is assured

•   Financing Wind Power

•   The Coalition believes that low cost long-term financing will help developers and utilities strike PPAs at consumer-
    friendly prices

•   On one day in October 2009, wind power provided 35 percent of electricity in Texas at 5.5 c/kwh wholesale
•   As it happens, unemployment, low electricity prices and carbon intensity tend to concentrate in the same states

•   Even CBO’s optimistic unemployment predictions suggest the need for large scale action

•   Each type of project, state by state, will create different levels of jobs

•   Response to anticipated criticism of PACE program

                                                                                                                      27
By using low cost financing, we will be imitating and competing with
China

                                                                                    #       PEs
                                           Equity Capital
                                                                  Equity
                                                                                    #       Public market investors
                                                                   investors
                                                                                    #       Strategic investors

                                                                Policy banks/           #     ADB
                                                                Intl. funds
                                                                                        #     IFC

                                                                                        #     European Investment Bank (EIB)

                                                                                        #     World Environment Facility
                                                                Commercial
                                                                                        #     AFD
                                                                banks
                                                                                        #     Industrial Bank
                                            Debt
                                                                                        #     ICBC

          Asset/ project                                                                #     CCB
                                                                 Corporate
                                                                                        #     Government deregulation made significant
                                                                  bonds
                                                                                              issuance possible by listed companies with
#   Infrastructure                                                                            attractive rates (e.g., 5 year bonds at 3.7% vs.
                                                                                              ~6.2% lending rates)
#   Energy efficiency
                                                                   Local treasury
#   Waste treatment/ recycle
                                                                   bonds                #     Mainly for infrastructure projects
#   Renewable energies (e.g.
    biofuels, wind, solar, and nuclear)                                                 #     Several local government approved to issue,
                                                                                              e.g. Xinjiang, Anhui and Sichuan

                                                                                        #    Reduced CO2 tonnage can be traded to
                                                                Carbon credit                developed countries               28
Source: McKinsey and Co.                  Additional earnings
China uses low cost long term financing to lower the delivered
   price of wind electricity

                   ______________________________________________________________                11.4 c/kWh
                       US Avg residential price in c/kWh

                                                                                                5.1c/kWh

RMB=Chinese Currency Unit                                                                                        29
US stats: EIA
                                                   Source: American Association for the Advancement of Science
RES is needed to drive demand for retrofits and clean energy,
 because only in a few western states is there natural new demand
 prior to 2015 and beyond
                                                                                                                                      21%
                                                                                                                                            16%

                                                                         35%
                               31%
                                                                                          21%
                                                                               15%              15%                                   2009 2021-
                                                                                                                                           2023

                                       8%                                                                                              NEPOOL
                                                                                                                      25%
                                                                         2009 2017-       2009 2014-                        17%
                               2009   2021-                                   2019             2016
                                      2023                                                                                            21%
                                                                           MRO               MISO                                           15%
                               Northwest            13% 14%
                                                                                                                      2009 2012-
                                                                                                       28%                 2014
                                                                          31%
                  18% 15%                           2009 2013-                                                          PJM           2009 2020-
                                                         2015                                                15%                           2022
                                                                                 14%
                                                     CO-WY                                                            20%             New York
                                                                                                                            15%
                                       18%                                               48%
                  2009 2012-                  14%                                                      2009 2018-
                       2014                                                2009 2017-                       2020
                                                                                2019
                  California                                                                             TVA          2009 2013-
                                       2009 2012-                              SPP                                         2015
                                            2014                                               15%
                                                                                                        25%            VACAR
                                       AZ-NM-NV              19%
                                                                    13%                                        15%
                                                                                         2009 2019-                  35%
                                                                                              2021
                                                                                                                            19%
                                                             2009 2015-
                                                                  2017                    Entergy       2009 2014-
                                                                                                             2016
                                                                 ERCOT
                                                                                                         Southern
                                                                                                                            2014-
                                                                                                                     2009
Reserve Margin (%)= (Supply-Demand/Demand)                                                                                  2016
                                                                                                                       FRCC

    2009 Reserve Margin
    Equilibrium: Period when new capacity is needed to
    meet target reserve margins required for reliability                                                                            Source: PA Consulting Group
                                                                               Represents regional level and does not account for certain locational issues
                                                                               where generation may be needed sooner or later than what is presented
                                                                                                                                                       30
Large new capital expenditure in energy is feasible: Private
    investment in communications sector averaged approximately
    $70 billion a year 1997-2007
   •    Congressional communications regulatory strategies in             $ Revenue for the US communications
        the 1990s spurred more than $850 Billion in private               industries in 2008 was roughly $500b
        sector investment over 10 years, with no federal
        appropriations                                                    $ Revenue for the US electricity industry in 2008 was $365b¹
    • As of October 2009, the telecommunications industry
    employed 977,000 American workers according to the
    Bureau of Labor Statistics

                   $000s, 1997-2007
                                                        14,612

                                                        18,359   16,065

                                               10,624
                                                                 25,961
                                               10,722

                                      5,611                                14,532
                      6,810                                                                                      11,368   13,233
                                  14,485                                                               9,509
                     13,484                                                          10,243   9,043
   Cable                                                95,126             22,880
                                                                                                       26,436    25,977   25,272
                                               73,569            71,776              19,916   22,482
   Wireless
                                      48,447
                     43,285
   Wireline                                                                34,594                                29,363   28,188
                                                                                     26,260   24,588   26,619

                       1997            1998    1999     2000      2001    2002        2003     2004    2005      2006
                                                                                                                    *     2007
                                                                                                                            *
                                                           *          *          *        *       *       *

Source: CIBC; SG Cowen; Kagan; CTIA                                                                                              31 3
¹ Source: EIA
                                                                                                                                    1
By investing in efficiency and RES compliance over the next three
years, we can increase emissions abatements while waiting for the
effects of caps in the 2020s

                                         Cumulative Emissions Reductions (2012+)

                         5,000
                         4,500
                         4,000
                         3,500
         MM Short Tons

                         3,000

                         2,500
                         2,000
                         1,500
                         1,000
                          500
                            0
                                 2012 2013 2014 2015 2016 2017 2018 2019 2020 2021 2022 2023 2024 2025

                                                 Prorata Reduction in Emissions Req'd to Meet WM Cap

Source: PA Consulting Group
Assumes electricity sector is responsible for a pro rata portion of target based on electricity sector
emissions as a percent of total emissions for Waxman Markey emission reductions.                         32
A national RES with low cost financing will produce more jobs if
regulatory flexibility is assured

•   Credit ratings need to be bought by the Green Bank so as to facilitate small
    projects, especially small retrofits.
•   Credit subsidy costs need to be financed as part of the loans/guarantees
    from the Green Bank
•   A loan/guarantee should not extend the existing reach of NEPA
•   A Green Bank should be temporary, targeted, limited in funding, and not
    governed by OPM or APA
•   Another major issue is long term power purchasing agreements, and that is
    something that a loan guarantee can help with
•   The utility will give a PPA if there is an RES and if the price of the electricity
    can be lowered by Green Bank guarantee
•   A Green Bank should be able to make equity contributions to municipal and
    rural coops that are debt financed by the Department of Agriculture

                                                                                    33
Financing Wind Power

      Year                            Tax Equity ($m)           Project Finance
                                                                ($m)
      2007                            $4,022                    $2,141
      2008                            $4,217                    $2,491
      2009                            $1,651                    $5,781 *
       •Tax equity market has contracted 60% from peak
       •Substitution effect in favor of project finance lending
       •Lower tail risk to lenders due to structure of Treasury
       cash grant program (compared to PTC structure pre-
       2009) has sustained wind power development
       •Combined effect of cash grant program and low-cost
       financing through Green Bank can lead again double
       financing of wind power, which otherwise will shrink in
       2010.

       * Includes $2b capital raise by single large developer                     34
The Coalition believes that low cost long-term financing will help
    developers and utilities strike PPAs at consumer-friendly prices

•      The all in costs of projects in 2009 ranged from a low of $2 million per MW to a high
       of around $2.5 million/MW depending on location. This has obviously been jumping
       up over the years as they were down in $1.5 million/$1.7 million back in the 2007 time
       frame. Note that we are seeing this number trend lower today as people pick up
       secondary market turbines and rework deals with the manufacturers.

•      Long term debt is generally sized based on a 1:1 coverage in the P-99 production
       scenario (which generally equates to a 1.4 - 1.5 times coverage in the P-50) and
       given the current tenor limitations this results in leverage of about 40 - 55% of total
       cost. As tenors extend from the currently 10 -12 years out to 15-16 years, depending
       on the length of the PPA, this % will increase.

•      The biggest issue today in the market both from the developer side and from a
       financing side is the ability for projects to get long term PPAs at a price that make the
       project economic and financeable.

    Source: JP Morgan
                                                                                              35
On one day in October 2009, wind power provided 35 percent of
 electricity in Texas at 5.5 c/kwh wholesale

 Blown Away: Wind Power Keeps Growing in Texas
    Can the U.S. produce 20% of its electricity from wind? The U.S. Department of Energy thinks it
    can get there by 2030.

         Could even this be powered by the wind? That doesn’t sound so far fetched anymore. A couple
         weeks ago – October 28th to be exact – wind turbines provided about 25% of Texas’ power
         consumption. (See the second page of the Texas electric authority ERCOT CEO’s update here.)

         Of course, that could have been in the middle of the night when the good people of Flatonia,
         Amarillo and Gun Barrel City – not to mention Houston and Dallas – were asleep. (Update: It was
         in the middle of the night. Three a.m. to be exact.) Spain topped out at 53% of grid electricity from
         the wind earlier this month, but that occurred at about 5 a.m. while most Spaniards were asleep.

         But back in Texas, a little before 8:30 p.m. on Wednesday October 28th, the Lone Star State got
         about 6,223 megawatts from the wind. That’s a record. At the time, the total load was about
         35,000 megawatts. That’s 17.8% of its power from the wind. (That’s not sleepy-time power usage.
         Texas power consumption peaked in October at 49,100 megawatts.)

         What does this mean for Texans electric bills? They could be headed down. A recent report finds
         that wind power is replacing more expensive forms of power generation.

 •        On Oct. 28th at 3 am, Texas received 25% of its power from wind generation.
 •        Also on Oct. 28th at 8:30 pm (still in peak load), Texas maxed out wind generation at 6,223 MW,
         or 17.8%, of total load.
•http://blogs.wsj.com/environmentalcapital/2009/11/17/blown-away-wind-power-keeps-growing-in-texas/tab/article/
                                                                                                                  36
As it happens, unemployment, low electricity prices and carbon
intensity tend to concentrate in the same states

                                                       CO2 Emissions / MWh by State
                                                         Electricity Generation Sector

                                                                                                                           NH: .35                   ME
                     .15                                                                                                                            MA

                                               .76          1.09                                              VT: .00                               RI: .44
                                                                          .74                                                                       CT: .33
               .18
                                  .06                                                   .87                                                      NJ: .35
                                                            .55                                                                  .42
                                                                                                      .69                                    MD: .68
                                                1.05
                                                                            .89                                            .63           DC: 1.12
                                                             .75
                      .72                                                                                     .93                      DE: .87
                                                                                          .53       1.04
                                        1.04
                                                     .91                                                            1.00
         .23                                                      .89           .95                                           .58
                                                                                                       1.04
                                                                                                                              .63
                                                                                                     .62
                                  .55                               .79
                                                1.01                              .58                                  .43

                                                                                              .61    .65       .69
                                                                                  .51
                                                             .64

                            .54
                                                                                                                        .64

                                                                                          Short Tons of CO2
                                                           .79                            Emissions per MWh
                                                                                                            >.8
                                                                                                            .6 - .8
                                                                                                            .4 - .6
                                                                                                            0 - .4                                            37
Even CBO’s optimistic unemployment predictions suggest the
need for large scale action….and the relative insignificance of
adding less than $100b in debt guarantees to the national balance
sheet over the next three years

                                                                38
Each type of project, state by state, will create different levels of jobs

    # Sub-utility scale projects (100kW-2MW):                                         # A variety of jobs are created by
    ! Create jobs at the local and regional level                                         renewable projects, including:
    ! Have less permitting risk and therefore start                                   ! Electricians, carpenters, roofers, civil
       construction sooner, with immediate job                                            engineers, welders, software engineers,
       creation                                                                           truck drivers, construction managers

   Direct and indirect jobs created per $1M in output
    18
    16
    14
    12
    10                                                                                                                                            Green
                                                                                                                                                  industries
      8
      6
      4
      2
      0
                                                                             d
                                                      la r

                                                                                                                    al
                                                               in g
         ri d

                                                 s

                                                                             in

                                                                                                                                             as
                                                                                                                  Co
                                        g

                                                                                                        ns
                           )

                                                                                          ing
                                             as

                                                                                                                             e)
                                                     So
                       als

                                                                         W
                                     tin
         tg

                                                               gg

                                                                                                                                            g
                                                                                                      io

                                                                                                                               s
                                            om

                                                                                            r
                                     f it
      ar

                                                                                                                            en
                     p it

                                                                                         tu

                                                                                                                                         al
                                                             Lo

                                                                                                    at
                                 t ro

                                                                                                                                         r
                                            Bi

                                                                                         c
    Sm

                                                                                                   ic
                  os

                                                                                                                         ef

                                                                                                                                      tu
                                                                                      fa

                                                                                                 un
                               re

                                                                                                                         D

                                                                                                                                    na
                (H

                                                                                     u

                                                                                                                       t(
                                                                                  an

                                                                                                m
                             ng

                                                                                                                                 nd
                                                                                                                     en
             re

                                                                                             m
                                                                                  m
                            ld i
           Ca

                                                                                                                             il a
                                                                                            co

                                                                                                                    m
                                                                              e
                          i
                       bu

                                                                                                                   rn
                                                                             l

                                                                                          le

                                                                                                                             O
                                                                         hic
         th

                                                                                                                 e
                                                                                       Te
       al

                     en

                                                                                                              ov
                                                                        ve
     He

                  re

                                                                                                             lg
                                                                        or
                G

                                                                                                             ra
                                                                      ot

                                                                                                           de
                                                                    M

                                                                                                        Fe

     Source: PERI, “The Economic Benefits of Investing in Clean Energy”, June 2009; Bureau of Labor Statistics
     Employment Requirements Matrix                                                                                                                 39
Response to anticipated criticism of PACE program

•       Appendix 1: Anticipation of PACE Criticisms
         – “PACE increases risk to GSE’s due to senior status of PACE liens.”

•       Response:

          –     PACE lien seniority in foreclosure represents less than 1% of home value/GSE mortgage
                value
          –     PACE “Best Practices” should require states to have “no due upon sale” clauses for PACE
                liens. Essentially, the PACE lien does not accelerate upon foreclosure.
          –     “PACE” increases risk to borrower’s/GSE’s due to increased leverage”

•       Response:
         – PACE liens should be either positive net present value or cash flow positive in year 1
              • If they are cash flow positive in year 1, this frees up homeowner cash flow to make
                mortgage payments and reduces risk of default
              • If they have positive net present value, then this should result in increase in the value of
                the collateral

          –     “PACE programs run the risk of consumer fraud”

•       Response:
              • Best practice and quality assurance programs are being developed in conjunction with
                municipality feedback (see best practice handouts) to help ensure the integrity of PACE
                programs
    Source: http://pacenow.org/documents/Basic_Slide_Intro_to_PACE.pdf                                    40
Response to anticipated criticism of PACE program
    •      Appendix 2: Analysis of PACE Tax Lien Seniority to Existing Mortgage
    •      Conclusion: The amount of seniority to the existing mortgage created by a PACE lien
           will typically represent less than 1% of home value

              – •This is because in most PACE states, upon foreclosure, only the delinquent tax
                lien gets paid (not the whole PACE loan) while the homeowner assumes the
                remaining balance

    •      Assumptions:

            – Home Value$300,000
            – Mortgage250,000
            – PACE Lien15,000(5% of home value)
            – Annual PACE 1,392(7% rate, 20 year amortization)
    •      Property Surcharge
            – Average Period Between Less than 12 months

    •      Delinquency and Foreclosure
                 • Assume 1 year PACE surcharge is delinquent and paid ahead of the
                   mortgage:
                          » Senior Payment:$1,392
                          » % of Home Value:.5%
                          » % of Existing Mortgage:.6%
Source: http://pacenow.org/documents/Basic_Slide_Intro_to_PACE.pdf
                                                                                              41
You can also read