Cosmo Energy Holdings Co., Ltd. Results for of Fiscal 2020 - May 13, 2021

Page created by Victoria Chen
 
CONTINUE READING
Cosmo Energy Holdings Co., Ltd. Results for of Fiscal 2020 - May 13, 2021
Cosmo Energy Holdings Co., Ltd.
   Results for of Fiscal 2020

          May 13, 2021
Cosmo Energy Holdings Co., Ltd. Results for of Fiscal 2020 - May 13, 2021
Contents

        Highlights of Results and Forecast
    Progress in 6th Consolidated Medium-Term
                                               Pages 2 to
      Management Plan and Dividend Policy         11
           Renewable Energy Business
    Advancement of Sustainable Management

                FY2020 Results                 Pages 12 to
        Forecast for FY2021 Performance            24

                                                             1
Cosmo Energy Holdings Co., Ltd. Results for of Fiscal 2020 - May 13, 2021
Highlights of Results and Forecast

                                     2
Cosmo Energy Holdings Co., Ltd. Results for of Fiscal 2020 - May 13, 2021
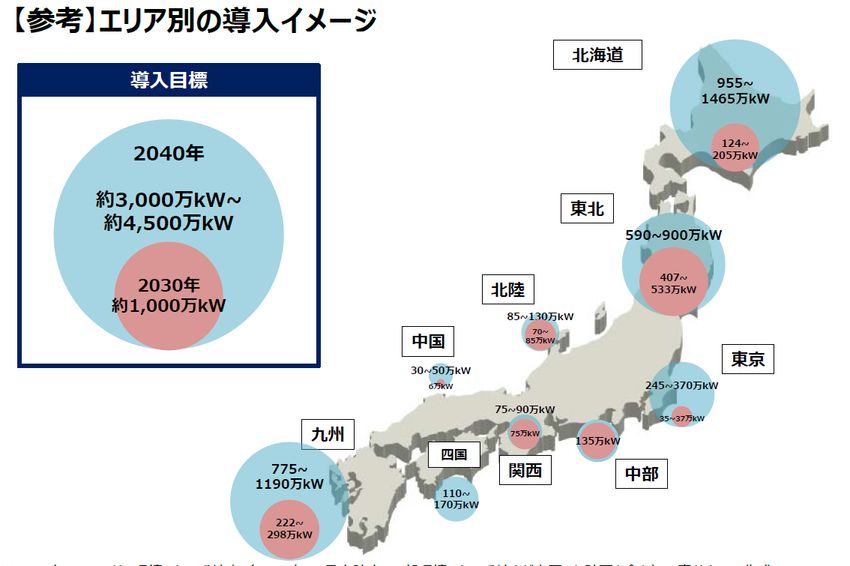
Highlights of FY2020 Results and FY2021 Forecast
                                  FY2020 Results and FY2021 Forecast
<FY2020 Results>
✓   The Company took comprehensive steps to prevent COVID-19 infections and maintained stable supply.
✓   Profit in the Oil E&P Business fell due to the fall in the crude oil prices, but overall ordinary profit, excluding inventory
    impact, rose ¥8.1 billion year on year, to ¥76.6 billion, reflecting an increase in the sales volume of the four major
    products attributable to the expanded supply to Kygnus Sekiyu and the positive effect of time lags on margins.
✓   Profit attributable to owners of parent increased ¥114.1 billion, to ¥85.9 billion, a record high, which was partly due to
    a tax effect.
<Forecast for FY2021 Performance>
✓   Ordinary profit excluding the inventory impact is forecast to be ¥80.0 billion yen, up ¥3.4 billion yen year on year, due
    to a rise in crude oil prices and a recovery in demand for petroleum products, despite the absence of the positive
    effect of time lags.
✓   COVID-19 is expected to cause sluggish demand for JET fuel, but its effect on results will be limited.

                                                                                                              Unit : billion yen

                                             FY2019             FY2020                           FY2021
                                                                                Changes                          Changes
                                          (Apr.-Mar. 2020)   (Apr.-Mar. 2020)                    Forecast

     1          Ordinary profit               16.3               97.4            81.1              88.0            -9.4

            (Impact of inventory
     2                                        -52.2              20.8            73.0              8.0            -12.8
                 valuation)
          Ordinary profit excluding the
     3
          impact of inventory valuation
                                              68.5               76.6             8.1              80.0             3.4

         Profit attributable to owners
     4                                        -28.2              85.9           114.1              40.0           -45.9
                    of parent

          Dubai crude oil price (USD/B)
     5
                   (Apr.-Mar.)
                                                60                 45            -15                60              15
          Dubai crude oil price (USD/B)
     6
                   (Jan.-Dec.)
                                                64                 42            -22                60              18              3
Cosmo Energy Holdings Co., Ltd. Results for of Fiscal 2020 - May 13, 2021
Progress in 6th Consolidated Medium-Term
  Management Plan and Dividend Policy

                                           4
Cosmo Energy Holdings Co., Ltd. Results for of Fiscal 2020 - May 13, 2021
Progress in Structural Reform in Medium-Term Management Plan

      ✓ Structural reforms in the Medium-Term Management Plan are progressing steadily.
      ✓ Recently, the Chiba Refinery got certified as a Specified Authorized Business Operator (commonly
        known as Super Certified Business Site), a plant with a high level of safety, by the Ministry of
        Economy, Trade and Industry. The refinery is the nation's ninth Super Certified Business Site.
      ✓ In the Renewable Energy Business, the Company started the commercial operation at the Chuki
        onshore site in April. In the second half, the Company plans to select operators for the project off the
        coast of Yurihonjo.

               FY2018            FY2019            FY2020            FY2021            FY2022                                                 Current Topics
                                                                                                           Segment                   Timing                                 Event
                                                                                                                                                     Installation work starts at the Oita onshore wind
               Utilizing Chiba Refinery Pipeline                                                   Renewable energy         January 2021
                                                                                                                                                     power site.
               Safe and stable operation, Improve utilization rate (Regular maintenance                                                              Car Life Square app achieves 3 million
               reduction・Chiba Refinery 4 year's operation), Synergy creation with petrochemical
                                                                                                   Petroleum business       February 2021
                                                                                                                                                     downloads.
Oil Refining   Achieve no heavy fuel oil
                                                                                                   Oil E&P business         February 2021            Acquire Offshore Exploration Block 4.
 and Sales     production (response to IMO)
                                                                                                                                                     Sign a joint venture agreement with Iberdrola
                               Start Supply to Kygnus Sekiyu k.K.                                  Renewable energy         March 2021               S.A. for the Aomori Northwest Offshore Wind
                                                                                                                                                     Farm Project.
               Expansion of vehicle life business                                                                                                    The Goto-hassakubana onshore wind power site
                                                                                                   Renewable energy         March 2021
                                                                                                                                                     starts commercial operation.
                                                                                                                                                     The total number of Cosmo My Car Lease
                                                                                                   Petroleum business       March 2021
               Stable production in existing and the Hail Oil Fields ・ OPEX                                                                          agreements reaches 85,000.
  Oil E&P
                                                                                                                                                     The Chuki onshore wind power site starts
               reduction                                                                           Renewable energy         April 2021
                                                                                                                                                     commercial operation.
                                                                                                                                                     The Chiba Refinery is certified as a Super
               Enhance competitiveness of basis petrochemical products,                            Petroleum business       April 2021
                                                                                                                                                     Certified Business Site.
Ptrochemical
             Pursue synergy with refinery                                                          Petroleum business       April 2021               EV car sharing service starts.
                                      Start C9 petroleum resin business                                                                              Chiba Arkon Production plans to start the
                                                                                                   Petrochemical business   First Half of FY2021     commercial operation of a facility for
               Expand onshore wind firms                                                                                                             hydrogenated petroleum resin.
                                                                                                                                                     Plan to select operators in the project off the
Renewable      (Power generation capacity 230,000kW➡400,000kW)                                     Renewable energy         Second Half of FY2021
                                                                                                                                                     coast of Yurihonjo.
  energy                                          Start offshore wind
               Develop offshore wind farms                                                                                                           Propylene rectification equipment scheduled to
                                                  power site project                               Petrochemical business   Second Half of FY2021
                                                                                                                                                     be completed.
                                                                                                                                                     Plan to invest in secondary oil recovery in the
               Deepen alliances with MIC, Hyundai Oilbank, and CEPSA                               Oil E&P business         Second Half of FY2021
                                                                                                                                                     Hail Oil Field.
 New area
               Sow the seed to new business                                                                                                                                                        5
Cosmo Energy Holdings Co., Ltd. Results for of Fiscal 2020 - May 13, 2021
Outlook for Financial Position and Dividend Policy
✓     The net debt equity ratio will likely reach between 1.0 to 1.5 times, the goal of the Medium-Term Management Plan,
      towards the end of FY2021.
✓     The Company still has some way to go before it achieves a net worth of ¥400.0 billion, the goal of the Medium-Term
      Management Plan, and will continue to seek to improve the financial position.
✓     In FY2020, the Company will pay a dividend of ¥80 per share (plan) and a dividend of ¥80 (plan) also in FY2021.
✓     The Company will put more weight on shareholder return in consideration of the improvement of financial condition, a
      basic policy of the Medium-Term Management Plan.

(Unit:billion yen)                                                                                                        (Unit:time)
                          Ordinary profit excluding the impact of inventory valuation(billion)left axis
                          Profit/loss attributable to owners of parent(billion)left axis                  Medium-Term Management 5.0
 300
                          Net D/E ratio(Times,After partially accounting for Hybrid Loans)right axis        Plan goal (net worth)
 400

 250
                                                                                                                                 4.5

                                                                                                                                 4.0
300
200

                                                                                                                                 3.5
 150

 200                                                                                                                             3.0

 100
                                                                                                                                 2.5

    50
                                                                                                                                 2.0

     0
                                                                                                                                 1.5
              FY2017            FY2018              FY2019              FY2020              FY2021              FY2022
                                                                                             (Plan)              (Plan)
    -50                                                                                                                          1.0
                                                                                                                                        6
                                                 Medium-Term Management Plan goal (net debt equity ratio)
Renewable Energy Business

                            7
Disclosure in Renewable Energy Business
✓   The Renewable Energy Business is a segment on which information is disclosed.
✓   The segment consists of Cosmo Eco Power, which engages in the wind power generation, and CSD Solar, which
    engages in solar power generation.
✓   Cosmo Eco Power obtained FIT approval for the installed capacity of 0.5milliom kW on onshore wind power sites for
    2030FY and now study the feasibility to expand the scale along with starting the non-firm connection strategy.
✓   As for the offshore wind power generation, new sites are expected to start operation in the latter half of 2020s. With
    the capacity of the onshore wind power sites, the company aims for starting more than 1.5million kW of operation in
    total in FY2030.
✓   In FY2019, new sites (Himekami and Watarai 2nd phase) started operation, the ordinary profit reached about ¥5
    billion. As for offshore wind power sites, there have been upfront cost (primarily development expenses and
    personnel expenses). With the planned start of operation at sites in the latter half of 2020s, ordinary profit is
    expected to improve significantly.

                                       Trend in Renewable Energy Business
     20                Onshore plant capacity(10,000 kW) right axis                                                        200

                       Offshore plant capacity(10,000 kW)right axis

                       Ordinary income(billion yen)left axis
     15                                                                                                                    150

                                                               Facility capacity expanded steadily as
     10                                                          onshore sites started to operate.                         100
                                                                                                                       Including non-farm
                                                                                                                       connection

      5                                                                                                                    50

      0                                                                                                                    0
                   FY2019                  FY2020              FY2021(Plan)              FY2022(Plan)   FY2030(Plan)
                                                                                                                                       8
          * Installed capacity is capacity commensurate with the Company’s investment.
Progress in Renewable Energy Business
      ✓        The Goto-hassakubana onshore site started to operate in March, and the Chuki onshore site started to operate in April.
      ✓        Three projects are under construction, and two projects are under development. Several offshore projects are being
               investigated and examined.

Onshore        Status                        Name                      Facility capacity

            In operation          Goto-hassakubana
                                                                       Approx. 1,000                                          FY2021                    FY2022         To      After
                                                                            kW

                                                                       Approx. 48,000
                                                                                                      In operation                                                   FY2030   FY2030
            In operation                    Chuki                           kW

                                                                       Approx. 49,000
       Under construction               Kamiyuchi                           kW
                                                                                                    Operations scheduled to start in the second half of FY2022
                                                                       Approx. 14,000
       Under construction                    Oita                           kW

                                                                       Approx. 90,000
           Being developed         Abukuma-minami                            kW1
                                                                       Approx. 50,000
                                                                                                                 Operations scheduled to start in the second half of FY2026
           Being developed              Chuki No.2                          kW
                                                                                           Subject to the act on renewable
Offshore       Status                        Name                      Facility capacity     energy sea area utilization

                                                                           Approx.                                             Operations scheduled to start in
       Under construction    Akita Port & Noshiro Port                                            Harbor area3
                                                                        140,000 kW 1                                                the second half of FY2022
                              Offshore Yurihonjo-shi,                      Approx.                                           Expecting to
                                                                                                                                       to place
                                                                                                                                          place a
                                                                                                                                                a bid
                                                                                                                                                  bid
                 FS                                                                            Promotional area              Expecting
                                       Akita                            700,000 kW1                                            in the
                                                                                                                               in the public
                                                                                                                                      public tender
                                                                                                                                             tender

                              Offshore northwest of
                 FS                   Aomori                               Approx.
                                                                                             High potential area
                                (The Sea of Japan, offshore near        600,000 kW1
                                            Aomori)
                                Central sea area near
                                                                                           Areas in which preparations
                 FS                     Akita                          Up to 500,000
                                                                                           have advanced to a certain
                             (Offshore near Katagami-shi/Akita-shi,         kW1,2
                                                                                                      level
                                             Akita)
                                 Offshore near Yuza,
                                                                                           Areas in which preparations
                 FS                   Yamagata                         Up to 500,000
                                                                                           have advanced to a certain
                                                                            kW1,2
                                 (Offshore near Yuza, Yamagata)                                       level

                             Offshore north of Niigata                 Up to 400,000
                                                                                           Areas in which preparations
            Assesment                                                                      have advanced to a certain
                             (Offshore near Murakami-shi/Tainai-shi,        kW1,2
                                                                                                      level
                                             Niigata)

                              Offshore in Ishikari Bay,                Up to 1,000,000
            Assesment                                                                                    -
                                     Hokkaido                               kW1,2

      *1 Installed capacity of the whole project
      *2 Maximum capacity stated in the environmental impact assessment report                                                                                                         9
      *3 Not subject to the Act on Promoting the Utilization of Sea Areas for the Development of Marine Renewable Energy Power Generation Facilities due to the port zone
Advancement of Sustainable Management

                                        10
Cosmo Energy Group's Net Zero Carbon Declaration

  ✓ The Group will aim to net zero greenhouse gas emissions* in its business by FY2050.
  ✓ The Group will conduct scenario analysis, which is recommended by the Task Force on Climate-
    related Financial Disclosures (TCFD), in this fiscal year and will set milestones to achieve long-term
    goals.
  ✓ The Group will formulate the 7th Consolidated Medium-Term Management Plan starting from
    FY2023, which includes financial and non-financial contents. The Cosmo Energy Group aims to
    achieve sustainable growth.
      *Emissions in Scope 1 and Scope 2

 FY2020        FY2021            FY2022                From FY2023                           FY2050

                   Net zero
Support for        Declaration
                       ・
                                  Formulation of 7th
                                    Medium-Term
                                                           Start of 7th
                                                          Medium-Term
                                                                                            Net zero
TCFD
                   Scenario       Management Plan        Management Plan                     carbon
                   Analysis

                                                                                                             11
FY2020 Results
Influence of the COVID-19 Pandemic
                                 Influence on Business Continuity and Operations
✓ The Company established a Crisis Countermeasures Meeting in accordance with the Group's Crisis
  Management Regulations and stringently managed the crisis.
✓ Business continuity, including the operation of refineries, is so far not affected.

                                                                  Influence on the Market
【Crude oil (DUBAI)】                                                                                                         【Petrochemical products】
                                                         【Petroleum products】                                               ✓ The PX price was low, although
✓ The price rose significantly
                                                         ✓ Demand for gasoline recovered from the                               it recovered to the level before
    after Saudi Arabia's voluntary
                                                             second quarter. The market was firm.                               the outbreak of the pandemic.
    output reductions and an
                                                         ✓ Demand for JET was weak throughout                               ✓ The BZ price exceeded the level
    OPEC Plus agreement on                                                                                                      before the outbreak of the
                                                             the year. The market was sluggish.
    output reductions.                                                                                                          pandemic.
                                                                                                                          ($/ton)
70 ($/B)                                                 120%                   Gasoline demand     JET demand              400          PX/Naphtha spread      BZ/Naphtha spread
60
                                                         90%                                                                300
50
                                                         60%                                                                200
40

30                                                       30%                                                                100

20
                                                          0%                                                                  0
10                                                              2020/1 2020/3   2020/6     2020/9   2020/12      2021/3           2020/1 2020/3   2020/6     2020/9   2020/12   2021/3
     2020/12020/3   2020/6   2020/9   2020/12   2021/3

✓      The COVID-19 pandemic significantly affected conditions and demand in a range of markets in the first quarter of
       2020. From the second quarter, markets and demand started to recover, but national demand for JET fell about 60%
       year on year and demand for gasoline declined about 10% year on year.
✓      In FY2021, demand, particularly demand for JET, will likely continue to fall.
                                                                                                                                                                                         13
FY2020 Review

  ✓ Consolidated ordinary profit excluding inventory impact was ¥76.6 billion (up ¥8.1 billion year on year),
    the inventory valuation impact was +¥20.8 billion. Consequently, consolidated ordinary profit stood at
    ¥97.4 billion (up ¥81.1 billion year on year), with net profit of ¥85.9 billion (up ¥114.1 billion year on year).
  ✓ Profit decreased in each business other than the Petroleum Business, chiefly due to a fall in crude oil
    prices and the sluggish petrochemical market. In the Petroleum Business, profit increased significantly,
    reflecting an increase in the sales volume of the four major products attributable to the expanded supply
    to Kygnus Sekiyu and the positive effect of time lags on margins.
  ✓ Owing to the record-high net profit, the net debt equity ratio came to 1.59 (an improvement of 0.82 from
    the end of the previous fiscal year). The financial position improved significantly.

  Petroleum Business
  ✓ Profit increased because of an increase in the sales volume of the four major products attributable to the
      expanded supply to Kygnus Sekiyu and the positive effect of time lags on margins during the period when
      crude oil prices rose, offsetting a sales decline due to a fall in the price of JET fuel and a slide in volume.
    --> Ordinary profit excluding inventory impact was ¥53.3 billion (up ¥48.9 billion year on year).

  Petrochemical business
  ✓ Profit decreased due to the deterioration of paraxylene market conditions and a decrease in volume
      associated with regular maintenance of Maruzen Petrochemical during the first quarter, and naphtha
      acceptance in a different fiscal year.
      --> Ordinary profit: -¥3.3 billion yen (down ¥8.5 billion year on year)

  Oil exploitation and production business
  ✓ Profit decreased following a fall in crude oil price
       --> Ordinary profit: ¥13.9 billion yen (down ¥31.1 billion year on year)

  Renewable energy business
  ✓ Profit fell due to upfront costs related to the development of offshore wind power generation.
     ⇒ Ordinary profit: ¥4.1 billion yen (down ¥0.8 billion year on year)                                           14
[FY2020 Results]
 Consolidated Income Statements– Changes from FY2019
                                                                                                       Unit: billion yen
                                                     FY2020            FY2019                             Forecast
  No.                       Item                                                      Changes
                                                  (Apr.-Mar.2020)   (Apr.-Mar.2019)                         FY2021
  1     Net sales                                       2,233.3           2,738.0         -504.7             2,150.0
  2     Operating profit                                   101.3              13.9          87.4                  93.0
        Non-operating
  3     income/expenses, net                                 -3.9               2.4             -6.3              -5.0
  4     Ordinary profit                                     97.4              16.3          81.1                  88.0
        Extraordinary
  5     income/losses, net                                   -3.7              -2.4             -1.3              -5.5
  6     Income taxes                                          4.4             34.9         -30.5                  35.2
        Profit attributable to non-controlling
  7     interests                                             3.3               7.1             -3.8               7.3

  8     Profit attributable to owners of parent             85.9              -28.2        114.1                  40.0

  9     Impact of inventory valuation                       20.8              -52.2         73.0                   8.0
        Ordinary profit excluding the
  10    impact of inventory valuation                       76.6              68.5              8.1               80.0
        Dubai crude oil price (USD/B)
  11    (Apr.-Mar.)                                            45                60             -15                 60
        JPY/USD exchange rate (yen/USD)(Apr.-
  12    Mar.)                                                 106               109              -3               105
 【Reference】
        Dubai crude oil price (USD/B)
  13 (Jan.-Dec.)                                               42                64             -22                 60
        JPY/USD exchange rate (yen/USD)(Jan.-
  14    Dec.)                                                 107               109              -2               105
                                                                                                                           15
[FY2020 Results] Outline of Consolidated Ordinary Profit by business segment
                     - Changes from FY2019

                                                                                                                                                        Unit : billion yen
                                                             FY2020                                   FY2019
                                                                                                                                               Changes
                                                         (Apr.-Mar.2020)                          (Apr.-Mar.2019)
                                                                        Ordinary profit                          Ordinary profit                          Ordinary profit
No                                                Ordinary profit     exc. the Impact of   Ordinary profit     exc. the Impact of   Ordinary profit     exc. the Impact of
                                                                     Inventory valuation                      Inventory valuation                      Inventory valuation

 1                            Total                       97.4                 76.6                16.3                 68.5                81.1                    8.1

 2                       Petroleum business               74.1                 53.3               -47.8                   4.4             121.9                  48.9
     (Each segment)

 3                      Petrochemical business                  -3.3                                         5.2                                      -8.5

 4                       Oil E&P business (*1)                 13.9                                     45.0                                      -31.1

 5                    Renewable energy business                     4.1                                      4.9                                      -0.8

 6                            Other (*2)                            8.6                                      9.0                                      -0.4
(*1) The Accounting period of three operators(Abu Dhabi Oil Company, Qatar Petroleum Development and United Petroleum Development) is December.
(*2) Including consolidated adjustment

                                                                                                                                                                             16
[FY2020 Results] Consolidated Ordinary Profit (Excluding the impact of inventory valuation)
                    - Analysis of Changes from FY2019

                                            Price           - 10.2
            Margins & Sales volume + 38.2   Volume          - 2.8      Price         - 39.6
            Expense,Other          + 10.7   Expense,Other   + 4.5      Volume        + 1.3
                                                                       Expense,Other + 7.2

                                                   -8.5

                                +48.9                                -31.1
                                                                                      -0.8               Unit : billion yen
                                                                                                 -0.4

             68.5                                                                                            76.6
                                                        Consolidated ordinary profit
                                                excluding the impact of inventory valuation
                                                    : Up ¥8.1 billion yen from FY2019

             FY2019
             Results
                                                                        FY2020 Results

              Ordinary                                                                                       Ordinary
             profit exc.                                                             Renewable              profit exc.
                                Petroleum       Petrochemical        Oil E&P
             the impact                                                                energy    Other      the impact
                                business          business           business
            of inventory                                                              business             of inventory
              valuation                                                                                      valuation

              68.5                 4.4      +       5.2         +      45       +       4.9       9.0

                                   53.3     +       -3.3        +     13.9      +       4.1       8.6         76.6
                                                                                                                              17
[FY2020 Results ]
Outline of of Consolidated Cash Flows and Consolidated Balance Sheet

                                         Consolidated Cash Flows

                                                                                                                 Unit: billion yen
                                                                                                  FY 2020         FY 2019
 No
                                                                                               (Apr.-Mar.2020) (Apr.-Mar.2019)
   1 Cash flows from operating activities                                                                 167.4                111.7
   2 Cash flows from investing activities                                                                 -84.6                -84.2
   3 Free cash flow (1+2)                                                                                  82.8                 27.5
   4 Cash flows from financing activities                                                                  -80.6                -24.7
   5 Cash and cash equivalents at end of the period                                                         44.5                 43.3

                                                 Consolidated Balance Sheets

                                                                                                                                             Unit: billion yen
                                                                                                   FY2020               FY2019
 No                                                                                                                                          Changes
                                                                                               (As of Mar.31, '21) (As of Mar. 31, '20)
   1 Total Assets                                                                                      1,709.0              1,639.8                     69.2
   2 Net assets                                                                                          449.1                362.8                     86.3
   3 Net worth                                                                                           324.9                239.8                     85.1
   4         Net worth ratio                                                                             19.0%                14.6%                    4.4%
   5 Net interest-bearing debt *1                                                                        556.4                628.3                   -71.9
   6     Net Debt Equity Ratio (times)     (after partially accounting for Hybrid Loan)   *2              1.59                 2.41       Improved 0.82 points

  *1 Total interest-bearing debts net of cash and deposits etc. as of the end of the period
  *2 Caluculated on the basis that 50% of 30 billion yen Hybrid Loan made on 31 March 2020 is included into Equity
                                                                                                                                                            18
[FY2020 Results] Highlights of Consolidated Capital Expenditures

  Capital Expenditures, Depreciation, etc.                                         Capital Expenditures by Business Segment
                                                  Unit: billion yen                                                                            Unit: billion yen
                                      FY2020      Change from                                              FY2020             FY2019
 No.                                                                  No.                                                                       Changes
                                      Results       FY2019                                                 Results            Results
  1 Capital expenditures                   79.6              -8.3        1 Petroleum                                 42.5             46.8                 -4.3
  2 Depreciation expense amount,etc        57.5              -0.1        2 Petrochemical                             19.7             18.1                  1.6
                                                                         3 Oil E&P                                   10.3             15.2                 -4.9
                                                                         4 Renewable energy                          10.0               6.8                 3.2
                                                                         5 Other・Adjustment                          -2.9               1.0                -3.9

                                                                         6 Total                                     79.6             87.9                 -8.3

                                                                         7 Investment securities,etc*                 5.6               5.8                -0.2

                                                                      *Investment securities, etc. are included in the net investment amount

                                                                       of ¥ 360.0 billion in the 6th mid-term plan (from FY2018 to FY2022).

                                                                                                                                                                   19
Key ESG Topics

        Promoting environmental                                        Enhancing human rights &
    E   measures                                                S      social contribution measures

✓ Support for TCFD                                            ✓ The company’s stock is selected for The MSCI Japan
                                                                Empowering Women Index (WIN)
✓ Cosmo Energy Group's Net Zero Carbon
  Declaration                                                 ✓ The company will increase the female representation
✓   Decided to switch to the electricity from renewable         on the board to 20%.
    sources at all of SS under Cosmo Energy Group.
✓   Started the EV mobility services with renewable           ✓ Improve the personnel system and put more weight on
    energy.                                                     diversity.
✓   Participated in the project of Next Generation Aviation
    Fuel which is derived from used cooking oil.

    G     Ensuring safety measures                             G       Strengthening corporate
                                                                       governance structure

✓   Chiba Refinery is approved as                             ✓ Rebuild the sustainable management system.
    Super Certified Business Site
                                                              ✓ The company will increase the number of independent
                                                                outside board directors.

                                                              ✓ Create the skill matrix for board director candidates.

                                                                                                                         20
Forecast for FY2021 Performance
FY2021 Forecast
  ✓ There is unlikely to be positive effects of time lags on margins, which there were in the previous fiscal
    year. However, consolidated ordinary profit excluding inventory impact is expected to increase chiefly
    due to an improvement in crude oil price and a recovery in demand for petroleum products.
  ✓ The Company forecasts that in FY2021, consolidated ordinary profit will stand at ¥88.0 billion yen
    (down ¥9.4 billion year on year), consolidated ordinary profit excluding inventory impact will come to
    ¥80.0 billion yen (up ¥3.4 billion yen year on year), and net profit will be ¥40.0 billion yen (down ¥45.9
    billion yen year on year).
  ✓ The net debt equity ratio is expected to be between 1.0 to 1.5 times due to an increase in net worth,
    or an improvement in financial position.

  Petroleum Business
  ✓ While the sales volume is likely to increase due to a recovery in demand for petroleum products, profit
      is expected to decrease chiefly due to the absence of the positive effect of time lags in the previous
      fiscal year and a rise in in-house fuel costs resulting from an increase in crude oil price.
    --> Ordinary profit excluding inventory impact will be ¥32.0 billion (down ¥21.3 billion year on year).

  Petrochemical business
  ✓ Profit is forecast to climb, reflecting the absence of the effects of regular maintenance at Maruzen
      Petrochemical and delayed naphtha acceptance in the previous fiscal year.
      --> Ordinary profit: ¥2.5 billion yen (up ¥5.8 billion year on year)

  Oil exploitation and production business
  ✓ Profit is expected to rise due to an improvement in crude oil price.
       --> Ordinary profit: ¥33.0 billion yen (up ¥19.1 billion year on year)

  Renewable energy business
  ✓ Although new sites (Chuki, Goto-hassakubana) will start to operate, profit is expected to fall due to
     upfront costs related to the development of offshore wind power generation.
     --> Ordinary profit: ¥3.3 billion yen (down ¥0.8 billion year on year)                                      22
[FY2021 Forecast] Highlights of Consolidated Business Outlook (Change from FY2020)
Precondition, and Business Sensitivity
                                                                                                                                                                                                 Unit : billion yen

                                                                          FY2021 Forecast                                  FY2020 Results                                             Changes
        No                                                                                Ordinary profit                                     Ordinary profit                                      Ordinary profit
                                                                  Ordinary profit       exc. the impact of      Ordinary profit             exc. the impact of       Ordinary profit             exc. the impact of
                                                                                        Inventory valuation                                 Inventory valuation                                  Inventory valuation

         1                            Total                                  88.0                    80.0                     97.4                       76.6                       -9.4                           3.4

         2                       Petroleum business                          40.0                    32.0                     74.1                       53.3                     -34.1                      -21.3
               (Each segment)

         3                      Petrochemical business                           2.5                                                -3.3                                                  5.8

         4                      Oil E&P business (*1)                            33.0                                               13.9                                                 19.1

         5                        Renewable energy                               3.3                                                 4.1                                                 -0.8

         6                             Other (*2)                                9.2                                                 8.6                                                  0.6

         7      The impact of inventory valuation                                8.0                                                20.8                                                -12.8

         8 Profit attributable to owners of parent                               40.0                                               85.9                                                -45.9
        (*1) The Accounting period of three operators(Abu Dhabi Oil Company, Qatar Petroleum Development and United Petroleum Development) is December.
        (*2) Including consolidated adjustment

         9                 Dividend per Share(Plan) (yen)                        ¥80                                                 ¥80                                                    -

        ■ Precondition                                                                                ■ Sensitivity

                                               FY2021                                                                                                                                           JPY/USD exchange
        No.                                                     FY2020 Results      Changes          No.                                         Item                Crude oil (Dubai)
                                               Forecast                                                                                                                                               rate
              Dubai crude oil price
        10 (USD/B)(Apr.-Mar.)                              60               45                15       14 Petroleum Business          Inventory Impact                    1.9 billion yen            1.1 billion yen
              JPY/USD exchange rate
        11    (Apr.-Mar.)                                 105              106                -1       15                             Refinery fuel cost etc.            -0.6 billion yen            -0.4 billion yen
              Dubai crude oil price
        12    (USD/B)(Jan.-Dec.)                           60               42                18       16                                                  Total          1.3 billion yen            0.7 billion yen
              JPY/USD exchange rate
        13    (Jan.-Dec.)                                 105              107                -2       17 Oil E&P Business                                                0.9 billion yen            0.6 billion yen
                                                                                                     * Figures above refer to the impacts of the price of crude oil (USD 1/bbl) and the yen-dollar exchange rate
                                                                                                       (+¥1/USD) fluctuations.A nine-month period of Apr.-Dec.2021 for oil E&P business.
                                                                                                                                                                                                                         23
[FY2021 Forecast] Consolidated Ordinary Profit (Excluding the impact of
inventory valuation) Analysis of Changes from FY2020

                                                                   Price         + 27.0
                Margins & Sales volume - 14.0                      Volume        - 2.8
                Expense,Other          - 7.3                       Expense,Other - 5.1                         Unit : billion yen
                                                                                            -0.8       +0.6

                                                                            +19.1
                                  -21.3                 +5.8

                                                Price           + 1.5
                                                Volume          + 3.2
                                                Expense,Other   + 1.1

               76.6                                                                                                80.0
                                                             Consolidated ordinary profit
                                                     excluding the impact of inventory valuation
                                                         : Up ¥3.4 billion yen from FY2020

               FY2020
                                                                              FY2021 Forecast
               Results

               Ordinary                                                                                            Ordinary
               profit exc.                                                                 Renewable               profit exc.
                                 Petroleum           Petrochemical          Oil E&P
              the impact                                                                     energy    Other      the impact
                                 business              business             business
             of inventory                                                                   business             of inventory
               valuation                                                                                           valuation

                76.6                53.3         +       -3.3           +    13.9      +      4.1       8.6

                                    32.0         +       2.5            +    33.0      +      3.3       9.2         80.0
                                                                                                                                    24
[FY2021 Forecast] Outline of Consolidated Capital Expenditures of Changes from
FY 2020

      Capital Expenditures, Depreciation, etc.                                        Capital Expenditures by Business Segment

                                                  Unit: billion yen                                                                            Unit: billion yen

                                     FY2021                                                                FY2021             FY2020
No.                                                  FY2020           No.                                                                       Changes
                                     Forecast                                                              Forecast           Results

 1 Capital expenditures                    72.0               -7.6     1 Petroleum                                  33.9               42.5               -8.6
 2 Depreciation expense amount,etc         63.1                5.6     2 Petrochemical                              16.6               19.7               -3.1
                                                                       3 Oil E&P                                    16.4               10.3                6.1
                                                                       4 Renewable Energy                             7.2              10.0               -2.8
                                                                       5 Other・Adjustment                           -2.1                -2.9               0.8
                                                                       6 Total                                      72.0               79.6               -7.6

                                                                       7 Investment securities,etc*                 16.1                5.6              10.5
                                                                      *Investment securities, etc. are included in the net investment amount
                                                                        of ¥ 360.0 billion in the 6th mid-term plan (from FY2018 to FY2022).

                                                                                                                                                              25
Supplementary Information
P.27-36 [FY2020 Results] Supplementary Information
           - Sales Volume, CDU Operating Ratios
           - Crude Oil Production Volume, Crude Reserves Estimate (Proved and Probable)
           - Results by Business Segment - Changes from FY2019
           - Main data of each business
           - Historical Changes in Dubai Crude Oil Price
           - Gasoline Export and Margin Environment
           - Diesel Fuel Export and Margin Environment
           - Market Condition of Benzene Products and Aromatic Products

P.37-38 Forecast for FY2021 Performance(Change from FY2020)
           - Outlook by Business Segment, Changes from FY2020
P.39-51 Overview of the Cosmo Energy Group (Business Outline)
           - Oil E&P Business , Petroleum Business, Petrochemical Business, Renewable energy Business

P.52    Subordinated loan (Announced on March 31,2020)
P.53-55 Zero Coupon Convertible Bonds due 2022 (being bonds with stock acquisition rights)
         (Announced on December 20,2018)

                                                                                                        26
Supplementary Information of
      FY2020 Results
[FY2020 Results ] Sales Volume, CDU Operating Ratios

                                                                                                                                                     Unit: thousand KL
                                                                                                                                                                FY2021
                                                                                    FY2020                  FY2019                               FY2021        forecast
No.                                                                                                                               Changes
                                                                                    Results                 Results                              Forecast    changes from
                                                                                                                                                                FY2020
  1   Selling volume in Japan              Gasoline                                          6,671                  6,295               106.0%       7,042        105.6%
  2                                        Kerosene                                          2,158                  1,968               109.6%       2,188        101.4%
  3                                        Diesel fuel                                       5,260                  5,001               105.2%       5,360        101.9%
  4                                        Heavy fuel oil A                                  1,681                  1,542               109.0%       1,522         90.6%
  5                                     Sub-Total                                          15,769                  14,806               106.5%      16,113        102.2%
  6                                        Naphtha                                           5,868                  6,115               96.0%        6,104        104.0%
  7                                        Jet fuel                                            268                    514               52.3%          450        167.6%
  8                                        Heavy fuel oil C                                    747                    779               95.9%          667         89.3%
  9                                     Total                                              22,653                  22,214               102.0%      23,333        103.0%

 10 Export volume                          Middle distillates Export                            93                    284               32.7%          550        593.0%

 11                                        Bonded products and other                         2,278                  2,942               77.4%        2,476        108.7%
 12                                        inc. Jet fuel                                     1,169                  1,901               61.5%        1,494        127.8%
 13                                        inc. Low-sulfur C fuel oil                          678                    353               192.3%         551         81.3%
 14                                     Sub-Total                                            2,371                  3,226               73.5%        3,026        127.6%
 15 Total                                                                                  25,023                  25,440               98.4%       26,359        105.3%

                                                                                    FY2020                 FY2019
No.                                                                                                                              Changes
                                                                                    Results                Results
 16 CDU operating ratio                 (Calendar Day basis) *1                            84.3%                   87.9%                -3.6%
 17                                     (Streaming Day basis) *1,2                         92.9%                   96.4%                -3.5%
*1: The operating ratio at the Company's three refineries

*2: Streaming day indicates operating ratio excluding the impact of suspended operations due to regular repairs and maintenance, etc.
                                                                                                                                                                            28
[FY2020 Results] Crude Oil Production Volume,
                     Crude Reserves Estimate (Proved and Probable)

   [1] Crude oil production volume
                                                                                                           FY2020              FY2019
                                                                                                                                                              Changes
                                                                                                           Results             Results
   Cosmo Energy Exploration & Production Co., Ltd. (B/D)                                                       49,208              50,773               -1,565                96.9%
   *1) The production volume represents the total production volumes of the three major developers: Abu Dhabi Oil Co., Ltd., Qatar Petroleum Development Co., Ltd., and United
       Petroleum Development Co., Ltd.
   *2) The production period has calculated in the January-December, because that the three major developers of the accounting period is December.
   *3) The Cosmo Energy Group has a 51.5% stake in Abu Dhabi Oil Co., Ltd., a 75.0% stake in Qatar Petroleum Development Co., Ltd.
       and a 50.0% stake in United Petroleum Development Co., Ltd.

                                                                                             (As of Dec 31, 2020)
   [2] Crude Reserves Estimate (working interest base) (*1)
                                                                                                            mmbls
   Total Proved(*2) and Probable Reserves (*3)                                                                  151.8
       (Ref.: Reserves to Production Ratio of Total                                                                       Note: The daily average crude production based on working
                                                                                                      about 17 years
                Proved and Probable Reserves )                                                                            interest reached 25 thousands bpd for FY2020(Jan-Dec).

   (*1) About results of reserves estimate
   The assessment of ADOC reserves which deemed to have significant impact on Cosmo’s future profitability was carried out in an
   independent assessment by Gaffney, Cline & Associate (hereinafter, “GCA”), a leading global independent reserve auditor. Their
   assessment confirmed Cosmo affiliates’ internal assessment of remaining reserves. The assessment was carried out in accordance
   with the 2007 “Petroleum Resources Management System (PRMS)” prepared by the Oil and Gas Reserves Committee of the “Society
   of Petroleum Engineers” (SPE), and reviewed and jointly sponsored by the “World Petroleum Congress” (WPC), the “American
   Association of Petroleum Geologists” (AAPG) and the Society of Petroleum Evaluation Engineers (SPEE). The assessment of QPD
   and UPD reserves were carried out in these companies respectively. These assessments of the reserves do not guarantee the
   reserves and production from them.
   (*2) Proved Reserves
   Proved Reserves are those quantities of petroleum, which by analysis of geoscience and engineering data, can be estimated with
   reasonable certainty to be commercially recoverable, from a given date forward, from known reservoirs and under defined economic
   conditions, operating methods, and government regulations. When probabilistic methods are used, there should be at least a 90%
   probability that the actual quantities recovered will equal or exceed the 1P estimate. (Definition of SPE PRMS 2007 March)
   (*3) Probable Reserves
   Probable Reserves are those additional Reserves which analysis of geoscience and engineering data indicate are less likely to be
   recovered than Proved Reserves but more certain to be recovered than Possible Reserves. When probabilistic methods are used,
   there should be at least a 50% probability that the actual quantities recovered will equal or exceed the 2P estimate. (Definition of SPE 29
   PRMS 2007 March)
[FY2020 Results] Results by Business Segment
                    – Changes from FY2019
   FY2020 Results – Changes from FY2019
                                                                                                                                    Unit: billion yen

                                                                                                                                Ordinary Profit
                                        Net Sales                 Operating Profit              Ordinary Profit           ( excluding the impact of
No.                                                                                                                          inventory valuation)

                                               Changes from                 Changes from                   Changes from                   Changes from
                                                 FY2019                       FY2019                         FY2019                         FY2019
 1 Petroleum business               2,055.8         -451.0           74.3         121.5             74.1        121.9           53.3             48.9
 2 Petrochemical business             304.5         -109.9           -1.4            -1.8           -3.3          -8.5           -3.3            -8.5
 3 Oil E&P business                     60.4         -37.5           14.7          -30.5            13.9         -31.1          13.9            -31.1
 4 Renewable energy business            11.7           -0.1           3.9            -0.9            4.1          -0.8            4.1            -0.8
 5 Other・Adjustment                  -199.1           93.8            9.8            -0.9            8.6          -0.4            8.6            -0.4
 6 Total                            2,233.3         -504.7          101.3           87.4            97.4          81.1          76.6              8.1

         Cosmo Energy Group (by Segment)

                               Cosmo Oil Co.,Ltd., Cosmo Oil Marketing Co., Ltd., Cosmo Oil Sales Corp, Cosmo Oil Lubricants Co., Ltd.,
Petroleum business             Sogo Energy Co., Ltd.,Gyxis Corporation (owned by the Cosmo Energy Group on the equity method),
                               Kygnus Sekiyu K.K.(owned by the Cosmo Energy Group on the equity method) , etc.

                               Cosmo Matsuyama Oil Co., Ltd., CM Aromatics Co., Ltd., Maruzen Petrochemical Co., Ltd.,
Petrochemical business
                               Hyundai Cosmo Petrochemical Co., Ltd. (owned by the Cosmo Energy Group on the equity method), etc.

                               Cosmo Energy Exploration & Production Co., Ltd.,Abu Dhabi Oil Co., Ltd., Qatar Petroleum Development Co., Ltd.,
Oil E & P business
                               United Petroleum Development Co., Ltd. (owned by the Cosmo Energy Group on the equity method), etc.
Renewable energy business      Cosmo Eco Power Co.,Ltd , etc.
Other                          Cosmo Engineering Co.,Ltd., Cosmo Trade & Services Co., Ltd., etc.

                                                                                                                                                         30
[FY2020 Results] Main data of each business

 1. Petroleum business
     (1) Refinery Operating Ratio
                                                                 FY2015          FY2016           FY2017           FY2018          FY2019          FY2020
     CDU operating ratio(Calender Day basis)*1                    83.2%           88.3%            94.1%            86.1%           87.9%           84.3%
     (2) Number of SSs by Operator Type
                                                                 FY2015          FY2016           FY2017           FY2018          FY2019          FY2020
     Subsidiary                                                      920             895              885              855             843             843
     Dealers                                                       2,134           2,062            1,973            1,936           1,912           1,886
     Total *2                                                      3,054           2,957            2,858            2,791           2,755           2,729
     Number of Self-Service SSs          *2                        1,036           1,038            1,034            1,048           1,072           1,099
     (3) "Cosmo The Card" – Number of credit cards in force & Accumulative number of contracted my car lease & "Carlife Square" –Number of App members

                                                                 FY2015          FY2016           FY2017           FY2018          FY2019          FY2020
      Cosmo The Card (million cards) *2                             4.39            4.44             4.44             4.33            4.21            4.12
      My car lease(Units) *2                                      27,401          37,077           47,602           60,579          73,634          85,126
      Carlife Square(million downloads) *2                                                                                           1.92             3.17
 2. Oil E&P business
     Crude oil production volume
                                                                 FY2015          FY2016           FY2017           FY2018          FY2019          FY2020
      Cosmo Energy E&P Co., Ltd. (B/D) *3                         39,201          39,032           38,826           52,303          50,773          49,208

 3. Renewable energy business
     Wind power plant capacity(ten thousand kW)
                                                                 FY2015          FY2016           FY2017           FY2018          FY2019          FY2020
      Plant Capacity*2                                             18.4            21.1             22.69            22.7            26.6            26.1
     *1) April-March results for each fiscal year *2) At the end of March of each fiscal year
     *3) January-December results for each fiscal year

                                                                                                                                                             31
Historical Changes in Dubai Crude Oil Price

 【$/B】                    Dubai Crude Oil             Average(Jan.-Dec.)             Average(Apr.-Mar.)
   80

                                                    Jan- Dec 2018 average

                                                  Apr 2018-Mar 2019 average Jan- Dec 2019 average

                                                                                                    Jan- Mar 2021 average
   60
                                        Apr 2017-Mar 2018 average           Apr 2019- Mar 2020 average

                                           Jan- Dec 2017 average
               Apr 2016-Mar 2017 average
                                                                                               Apr 2020- Mar 2021 average

   40
                Jan- Dec 2016 average
                                                                                                   Jan - Dec 2020 average

   20
        2016               2017                  2018                 2019                  2020                 2021
  *Trend of crude oil price from January 2016 to March 2021

                                                                                                                            32
Gasoline Export and Margin Environment (Domestic /Overseas)

  [thousand
  [thousandKL]
            KL]                                                                                                   [yen/L]

    1,000                                                                                                             20.0

     800                                                                                                              15.0

     600                                                                                                              10.0

     400                                                                                                              5.0

     200                                                                                                              0.0

        -                                                                                                             -5.0
            2016         2017                 2018                 2019                 2020                   2021
                   Total Gasoline export volume from Japan (left axis)
                   Gasoline - Japanese spot market spread between Dubai Crude and Product price (right axis)
                   Gasoline - Singapore market spread between Dubai Crude and Product price (right axis)

                                                                                                                             33
Diesel Fuel Export and Margin Environment (Domestic /Overseas)

  [thousand KL]
      3,000                                                                                                              25.0 ]
                                                                                                                       [yen/L

      2,500                                                                                                             20.0

      2,000                                                                                                             15.0

      1,500                                                                                                             10.0

      1,000                                                                                                             5.0

        500                                                                                                             0.0

          -                                                                                                             -5.0
              2016            2017                 2018                 2019              2020                  2021

                     Total diesel fuel export volume from Japan (left axis)
                     Diesel fuel - Japanese spot market spread between Dubai Crude and Product price (right axis)
                     Diesel fuel - Singapore market spread between Dubai Crude and Product price (right axis)

                                                                                                                                  34
Market Conditions for Benzene Products

      600
   [$/ton]                                              Bz-Naphtha Spread

     500

     400

     300

     200

     100

        0

     -100
       FY2016                   FY2017                 FY2018                 FY2019      FY2020   FY2021

             (*) Horizontal line indicates the average of each calendar year(Apr.-Mar.)
                                                                                                            35
Market Conditions for Aromatic Products

     800                                              PX-Naphtha Spread
   [$/ton]

     700

     600

     500

     400

     300

     200

     100
       FY2016                  FY2017                 FY2018                 FY2019        FY2020   FY2021

             (*) Horizontal line indicates the average of each calendar year(Jan.-Dec.).
                                                                                                             36
Forecast for FY2021 Performance
     (Change from FY2020)
[FY2021 Forecast] Outlook by Business Segment, Changes from FY2020

   FY2021 Forecast – Changes from FY2020
                                                                                                                                     Unit: billion yen

                                                                                                                                 Ordinary Profit
                                          Net Sales                Operating Profit              Ordinary Profit           ( excluding the impact of
  No.                                                                                                                         inventory valuation)

                                                Changes from                 Changes from                   Changes from                 Changes from
                                                  FY2020                       FY2020                         FY2020                       FY2020
   1 Petroleum business               1,822.0         -233.8          41.0         -33.3           40.0           -34.1          32.0          -21.3
   2 Petrochemical business             315.0          10.5            6.5            7.9             2.5           5.8           2.5            5.8
   3 Oil E&P business                    82.0          21.6           32.5          17.8           33.0            19.1          33.0           19.1
   4 Renewable energy business           14.0            2.3           3.3            -0.6            3.3          -0.8           3.3           -0.8
   5 Other・Adjustment                   -83.0         116.1            9.7            -0.1            9.2           0.6           9.2            0.6
   7 Total                            2,150.0          -83.3          93.0            -8.3         88.0            -9.4          80.0            3.4

           Cosmo Energy Group (by Segment)

                                 Cosmo Oil Co.,Ltd., Cosmo Oil Marketing Co., Ltd., Cosmo Oil Sales Corp, Cosmo Oil Lubricants Co., Ltd.,
  Petroleum business             Sogo Energy Co., Ltd.,Gyxis Corporation (owned by the Cosmo Energy Group on the equity method),
                                 Kygnus Sekiyu K.K.(owned by the Cosmo Energy Group on the equity method) , etc.

                                 Cosmo Matsuyama Oil Co., Ltd., CM Aromatics Co., Ltd., Maruzen Petrochemical Co., Ltd.,
  Petrochemical business
                                 Hyundai Cosmo Petrochemical Co., Ltd. (owned by the Cosmo Energy Group on the equity method), etc.

                                 Cosmo Energy Exploration & Production Co., Ltd.,Abu Dhabi Oil Co., Ltd., Qatar Petroleum Development Co., Ltd.,
  Oil E & P business
                                 United Petroleum Development Co., Ltd. (owned by the Cosmo Energy Group on the equity method), etc.
  Renewable energy business      Cosmo Eco Power Co.,Ltd , etc.
  Other                          Cosmo Engineering Co.,Ltd., Cosmo Trade & Services Co., Ltd., etc.

                                                                                                                                                         38
Business Outline
Cosmo Energy Group Business Overview

                                                                                                                                                    Renewable energy                      Other・ Including                            *2
    Each segment                     Oil E&P business                  Petroleum business                  Petrochemical business                                                                                            Total
                                                                                                                                                       business                        consolidated adjustment

       Net sales* 1                      82.0billion yen 1,822.0billion yen                                        315.0billion yen                      14.0billion yen                     -83.0billion yen 2,150.0billion yen

    Ordinary profit * 1                  33.0billion yen                    40.0billion yen                             2.5billion yen                     3.3billion yen                      9.2billion yen           88.0billion yen
  Ordinary profit excluding * 1
impact of inventory valuation            33.0billion yen                    32.0billion yen                             2.5billion yen                     3.3billion yen                      9.2billion yen           80.0billion yen
                         *1
                                  ■Partnerships                      ■ CDU capacity           ■Olefinic production capacity * 5
                                                                                          * 5, * 6                                                            *5                                                 ■Corporate brand awareness
                                                                                                                                    ■Wind power plant capacity
                                  Solid relationship of trust                      400,000 BD       Ethylene     1.29 mil tons/year
                                  with oil producing countries   (Domestic market share:                                                               261,000 kW                                                                          98.4%
                                  for about 50 years              Approx. 11.4%)              (Domestic market share:               (No. 3 in Japan and
                                                                                                           Approx. 19%)               a 6% domestic share)
                                  ■Operatorship (self-operation) ■ Domestic Sales Volume *3
                                  We produces the largest
                                  volume of crude oil in the                      22,653thousand KL
                                  Middle East region for a
                                  Japanese operator.                 ■Number of Service station      *5                                                                                                          ※Survey of 1,239 customers
       Major assets                                                                                                                     *5
                                  ■ Crude Oil Production    *3                              ■Aromatic production capacity      ■ Solar power generation * 5                                                      (men and women, 18-64 years
                                                                                    2,729                                                                                                                        old) who used a service station
                                       Approx. 49 thousand B/D                                 Para-xylene 1.360 mil tons/year   capacity
                                                                                                                                                                                                                 in the past one month(as of
                                  (Comparison with refining    ■ Number of the                   Benzene 0.735 mil tons/year                      24,000 kw
                                                                                                                                                                                                                 Octorber 30, 2017)
                                        capacity: Approx. 12%) “Cosmo the Card” Holders * 5  Mixed-xylene 0.618 mil tons/year
                                  ■Crude Oil Reserves                                4.12million cards
                                     (Proved and Probable) * 4 ■ Car leasing business for * 5
                                             151.8 million barrels individuals
                                  (Equivalent to approx.            Cumulative total 85,126cars
                                               17 years of supply)

                                  ・Cosmo Energy                      ・Cosmo Oil                           ・Maruzen Petrochemical                 ・Cosmo Eco Power                    ・Cosmo Engineering
                                    Exploration & Production         ・Cosmo Oil Lubricants                  (Chiba/Yokkaichi)                     (Wind power generation)            ・Cosmo Trade and Service
                                  ・Abu Dhabi Oil (UAE)               ・Gyxis(LPG)                          ・Cosmo Matsuyama Oil                   ・CSD solar
                                  ・Qatar Petroleum Development                                            ・CM Aromatics (Chiba)                   (Solar power generation)
          Major
                                   (Qatar)                                                                ・Hyundai Cosmo Petrochemical
  business companies                                                                                                                                                                                                           -
                                  ・United Petroleum                                                        (Korea)
   related companies                                                 ・Cosmo Oil Marketing
                                  Development
                                   (UAE/Qatar)                       ・Cosmo Oil Sales
                                                                     ・Sogo Energy

                                  (*1) FY2021 Forecast、(*2) Including consolidated adjustment、(*3)FY2020 Results、(*4)As of Dec. 31, 2020、(*5)As of Mar. 31, 2021、
                                  (*6))Including the supply of the petroleum product/semi product (37,000 bbls/day equivalent) from Idemitsu Showa Shell Group with the business alliance.

                                                                                                                                                                                                                                                   40
[Oil E&P Business] Overview: High Competitiveness Due to Operatorship

   ✓ Based on a strong relationship of trust with Emirate of Abu Dhabi in the Middle East developed
     almost five decades, we have achieved low-risk, low-cost development.
   ✓ Abu Dhabi Oil Company extended concessions (30 years) in 2012 and obtained new concessions
     area, the Hail Oil Field is projected to the same production volume as its three existing oilfields.
   ✓ Started production from the Hail Oil Field in FY 2017 with production ramping up to full-scale in
     January 2018.
  ■ Cosmo Energy Group Oil E&P Division                                                                                                            ■ Cosmo Energy Group’s oil fields
                                     63.0%
                                                                      MIC*(Former IPIC)
                                                                                      20.7%
                                                                   Cosmo Energy Holdings
                                                                                       100.0

                                                                                                                                                   State of Qatar
                                                                                                                                                                                                               Arabian
                                                                                                                                                                       QPD’s Oil Fields                        Peninsula
                     CEPSA                                  Cosmo Energy Exploration & Production
                            20.0%                     80.0%                                                  50.0%                                                                        UPD’s Oil Fields

                                                                                     75.0%
                Cosmo Abu Dhabi Energy Exploration & Production                                                                                                                               ADOC’s Oil Fields

                                           64.4%
                Abu Dhabi Oil Company (ADOC)                         Qatar Petroleum Development             United Petroleum Development
                         (Operator)                                              (QPD)                                   (UPD)
                                                                                                                                                                                                    Hail Oil Field
         ■ Investment Ratios:                                     ■ Investment Ratios:                    ■Investment Ratios:
         Cosmo Abu Dhabi Energy Exploration & Production          Cosmo Energy Exploration & Production   Cosmo Energy Exploration & Production
         (64.4%),                                                 (75%), Sojitz (25%)                     (50%), JX Nippon Oil & Gas Exploration                    United Arab Emirates / Emirate of Abu Dhabi
         JX Nippon Oil & Gas Exploration (32.2%),                                                         (50%),
         The Kansai Electric Power (1.7%), Chubu Electric
         Power(1.7%)                                              ■ Start of Production:                  ■ Start of Production:
                                                                  2006                                    1975
         ■ Start of Production:
         1973 - 2012                                              ■ Contract Type:                        ■ Contract Type:
          > Interests extended for 30 years (to 2042)             Product Sharing Agreement               Concession Agreement
         ■ Contract Type:                                         ■ Production Oilfields:
         Concession Agreement                                                                             ■ Production Oilfields:
                                                                  A-North Oilfield, A-South Oilfield,
                                                                                                          El-Bunduq Oilfield
         ■ Production Oilfields:                                  Al-Karkara Oilfield
         Mubarraz Oilfield, Umm Al-Amber Oilfield,
         Neewat Al Ghalan Oilfield,
         Hail Oilfield ( started production in FY2017)

(*) MIC (Mubadala Investment Company) in which The Emirate of Abu Dhabi has a 100% stake ,has been established as a holding company                                                                                        41
in association with the business combination of IPIC (International Petroleum Investment Company), and MDC (Mubadala Development
Company).
[Oil E&P Business] Cosmo Energy Group’s Strengths

✓ Risk Tolerance                                         : Low oil price risk, exploration risk, funding risk
✓ Growth Strategy (Production Increase)                  : The Hail Oil Field development,
                                                           Consideration of joint development with Cepsa
✓ Long-term Stable Production                            : Solid trust relationships with oil producing countries,
                                                           High quality oil fields and oil recovery technologies
  ■ Risk Tolerance ■
  ➢   Earning power under low oil prices → For FY2016 Q1 (January to March), we maintained profitability under conditions
      where Dubai crude was priced at $30 per barrel.
  ➢   Achieving low-cost development through discovered and undeveloped oilfields (including the Hail oilfield)
  ➢   Loans provided by Japanese public institutions (JBIC) with credit of the operator (ADOC)

  ■ Growth Strategy ■
  ➢   At peak production, production capacity of the Hail Oil Field is equivalent to the three existing oilfields of ADOC
  ➢   Strategic comprehensive alliance with MIC(former IPIC)-owned Cepsa, deliberating new oilfield development with Abu Dhabi
      National Oil Company and CEPSA

  ■ Long-term Stable Production ■
  ➢   Obtained interests before founding of UAE, with safe operation and stable production for almost five decades
  ➢   Long-term, stable purchase of crude oil from UAE (Abu Dhabi) and Qatar
  ➢   Contributions to both countries in terms of culture(Japanese language education, etc.) and the environment
      (zero flaring, etc.)

                                   Business Environment in the Middle East Region (UAE / QATAR)

  ➢   The Arabian Gulf has many reserves and a lot of exploratory data has been accumulated
      (which translates into low oil exploration costs)
  ➢   Shallow water depth (relatively lower exploration, development and operating costs)

                                                                                                                                 42
[Oil E&P Business] Growth Strategy

   ✓         The Hail Oil Field started production in November 2017. (interest period – through year 2042)
   ✓         The Hail Oil Filed investment has been curbed with the shared use of existing oil processing, storage and shipping
             facilities (Estimated savings of 300-400 million dollars), and after the start of production, per unit operating costs
             are expected to decline for the increment of production volume.

                                                                                                                                          Hail Oil Field and existing shipping terminal
                                      Prolonged stable oil production                                                                                    (Mubarraz Island)
                                                                                                                                                                    Mubarraz Island

                Crude oil production volume (total of three development companies)and crude oil
 (B/D)
 60,000                                                                                                                             140
                   Production volume total of three development companies (Left axis)

                   Crude Oil Price (Right axis)                                                                                     120

                                                                                                                                    100                         Existing facilities (crude oil processing,
 40,000                                                                                                                                                         storage, shipping facilities) can be
                                                                                                                                                                shared with the Hail Oil Fields.
                                                                                                                                    80

                                                                                                                                           Approx.
                                                                                                                                    60      10km                     Underwater pipeline cable

 20,000
                                                                                                                                    40

                                                                                                                                    20

      0                                                                                                                             0                                              Hail Artificial Island
           1973
           1974
           1975
           1976
           1977
           1978
           1979
           1980
           1981
           1982
           1983
           1984
           1985
           1986
           1987
           1988
           1989
           1990
           1991
           1992
           1993
           1994
           1995
           1996
           1997
           1998
           1999
           2000
           2001
           2002
           2003
           2004
           2005
           2006
           2007
           2008
           2009
           2010
           2011
           2012
           2013
           2014
           2015
           2016
           2017
           2018
           2019
           2020
           2021
           2022

                                                                                                                                                 Expanded
                                                                 (ADOC)                                       November, 2017                      dredged
(ADOC)           (UPD)                    (ADOC)                                        (QPD)
Mubarraz         El-Bunduq                Umm Al Ambar           Neewat Al Ghalan       Al-Karkara,           (ADOC)                             waterway
Start of                                                         Start of production    A-North               Hail
                 Start of                 Start of
production                                                                              Start of production   Start of production
                 production               production

    *1)   ADOC : Abu Dhabi Oil Company、UPD:United Petroleum Development、QPD:Qatar Petroleum Development
    *2)   Production volume of three development companies are per year (annual average of January to December each year)
    *3)   Crude oil prices (Platt's Dubai crude) are average monthly                                                                                                                                         43
    *4)   The production volume of three development companies after fiscal 2020 is prospective volume.
[Oil E&P Business] A Successful Bid for Offshore Exploration Block 4

 In the Abu Dhabi 2019 Block Bid Round in the United Arab Emirates, the Company won a bid for Offshore
 Exploration Block 4 (the “Block”). Recently established Cosmo E&P Albahriya Limited will engage in
 exploration with a view toward early exploitation and production. Main points are as follows.
  • Oil indications have been confirmed in part of the Block.
  • The Block is adjacent to the exploration zone of Abu Dhabi Oil Co., Ltd., a Cosmo Energy Group
     company. Integration with processing, storage and shipping facilities will reduce the two companies’
     capital investment and operating expenses and maximize synergy.
  • With production in this Block, the Company will build a robust busines portfolio that makes a profit even
     in a low oil price environment while maintaining the Group’s crude oil production level.
  • With a view toward the creation of a sustainable society, the Group will positively study the development
                                                       100 required for a decarbonized society.
     and application of CCS, CCUS and other technologies

                                                                       Schematic of trend in
         Location of Offshore Block 4                 80          the Group’s crude oil production

                                                      60 (thousand B/D)

                                                      40
                                  Offshore Block 4                                Maintaining
                Abu Dhabi Oil’s                                                   production volume
               exploration zone
                                                                                  and competitiveness
                                                      20                          through exploration in
                                                                                  the new block

                                                       0
                    Emirate of Abu Dhabi, UAE              FY20     FY21   FY22    FY23    FY24    FY25    FY30
Saudi
Arabia

                                                                                                                  44
[Petroleum Business]
- Strengthening competitiveness through an alliance with Kygnus Sekiyu K.K.

✓ Conclude a capital and business alliance with Kygnus Sekiyu K.K. and acquired 20% of common
  shares.
✓ Begin supplying petroleum products to Kygnus Sekiyu K.K. around CY2020.
✓ Advance discussion and consideration with a view to a business alliance, in addition to the supply of
  petroleum products.
                                           Kygnus Sekiyu K.K.

   Cosmo Oil Refineries
 (Chiba, Yokkaichi, Sakai)

                                                                                       Service station
                                         Capital and Business                            operators
                                               Alliance

                                          Cosmo Energy Group

                                              ・Domestic Sales Volume
                                                  22,653 thousand KL
                                              ・Number of Service stations                Factory etc.
                                                  2,729
                                              (As of Mar.31,2021)                                         45
[Petroleum Business] IMO(International Maritime Organization)Regulations

  ✓ International Maritime Organization (IMO) is to strengthen its regulation in 2020 by setting the upper limit of sulfur
    content from 3.5% down to 0.5 and the shipping fuel will be switched from high sulfur C heavy fuel to conforming
    low sulfur C heavy fuel.

                          Before                                                           After
      Chiba Refinery
           To increase production of low sulfur C heavy oil by utilizing Chiba Refinery’s DDS(direct desulfurization)

                      Surplus
 Atmospheric          capacity           Low-sulfur C             Atmospheric                              Low-sulfur C
   residue                                  fuel oil                residue                                  fuel oil
                       Fuel Oil                                                          Fuel Oil
                  Hydrodesulfurization                                              Hydrodesulfurization
                         Unit                                                              Unit

      Sakai Refinery
      Enhance Sakai Refinery’s Delayed coker capacity and turn high sulfur C heavy oil into high value added products

                                                                                    Capacity enhancement
                                                                                                            Naphtha
                                         Naphtha
 High-sulfur C                                                    High-sulfur C                             Middle distillates
    fuel oil                             Middle distillates          fuel oil
                   Delayed Coker                                                     Delayed Coker
                        Unit             Low-sulfur C fuel oil                            Unit             Low-sulfur C fuel oil

                                         Cokes                                                              Cokes            46
[Petroleum Business] Strengthening the Retail Business (Individual Car Leasing Business)
                                                     Low-risk Business Model that Takes Advantage of Strengths of SS

✓     Market : Enter the niche market of auto-leases for individuals that leasing companies could not serve
✓     Strategy : Acquire customers using the strengths of SS (frequent contacts of individual customers, etc.)
✓     Risk     : Low risk due to the absence of car inventory and credit risk
✓     Business model: All parties, including customers, leasing companies, Cosmo, and dealerships, win.

                               Characteristics                                                           Win-win business model
■ Entry to the market with high potential demand                                            Customers       : - Being able to drive new cars of any maker
                                                                                                                and model for a price lower than purchasing
                                                             Extremely small ratio of                         - No complicated procedures
             Ownership                                      ownership of private vehicles                       e.g. Simplified expenses for using a car
                                        Potential           by lease
                                        demand              ⇒ High potential demand                                  (monthly flat rate that includes safety
                                                                                                                      inspections, taxes, insurance, etc.)
                  Lease                                                                     Lease companies : Capture new customers
                                                                                            Cosmo, dealerships : Secure revenue sources that are not
■ Using the strengths of SS                                                                                       solely dependent on fuel oil
    • Frequent contact with individual Customers
      (500,000 units/day) (*1)
      (*1) The number of cars of customers visiting Cosmo SS (estimated by Cosmo)
                                                                                                               Cosmo Energy Group/Dealers
    • Acquire customers using membership cards
      (“Cosmo The Card”: effective number of members
                        4.21 mil cards) (*2) (*2) As of March 31, 2020                       Window                 Fee income, etc.                        Negotiations on vehicle price
                                                                                                                                       Agency contract
    • Fuel oil discount system (patented business model)
■ Low risk
    • Because the SS play the role of dealerships,                                          Customers
                                                                                                         contract              Lease                Purchase              Car
                                                                                                          Lease               company              of vehicles          dealers
      there is no credit risk or risk of keeping vehicle
      inventory.
                                                                                                                                                                                        47
[Petrochemical Business] Targeting Ethylene and Para-xylene Markets in Which Growing
Demand is Expected - High Capacity Utilization of Competitive Equipment

                                                                                Expected global demand for petrochemical products

                                          Source: Global Demand Trends for Petrochemical Products of the Ministry of Economy, Trade and Industry (2016-2022)

                                                 Strengths of Cosmo Energy Group                                                                                                       Production capacity
                                                                                                                                                                       Product                        Manufacture               Production capacity
                                                                                                                                                             Olefin-based       Ethylene         Maruzen Petrochemical           *1.290 mil t/year
                                                   HCP (*)
                                                   - Adjacent to the area of demand(China)                                                                   Aroma-based      Para-xylene    Hyundai Cosmo PetroChemical          1.360 mil t/year
                                                   - One of the highest PX production
                                                     capacities in the world                                                                                                    Benzene          Maruzen Petrochemical            0.395 mil t/year
     xylene)
     (world’s highest demand for para-
                                         China

                                                                                                             Maruzen Petrochemical (Chiba plant)
                                                                                                             - Located in Keiyo industrial complex,
                                                                                                               one of the largest of its kind in the world
                                                                                                                                                                                             Hyundai Cosmo PetroChemical          0.250 mil t/year
                                                                                                             - One of the highest ethylene production
                                                                                                               capacities in Japan                                                                Cosmo Matsuyama Oil             0.090 mil t/year
                                                                                                             - High capacity utilization of competitive

                                                    Para-xylene
                                                                                                               devices (Part of ethylene is exported)                                                                   Total     0.735 mil t/year
                                                                                                             - Pursue synergy with oil refining
                                                                                                                                                                              Mixed-xylene   Cosmo Oil (Yokkaichi Refinery)       0.300 mil t/year
                                                                             Mixed-xylene
                                                                                                                                                                                                      CM Aromatics                0.270 mil t/year
                                                                                                                                       CM Aromatics
                                                                                                                                                                                                  Cosmo Matsuyama Oil             0.048 mil t/year
                                                                                                             Yokkaichi Refinery
                                                                                                           Maruzen Petrochemical
                                                                                                             (Yokkaicih plant)
                                                                                                                                                                                                                        Total     0.618 mil t/year
                                                                                              Cosmo Matsuyama Oil                                                                                          Aroma-based, total   2.713 mil t/year
                                                                                                                                                                            * Includes production capacity of Keiyo Ethylene
                                                                                                                                                                               (55% owned, consolidated subsidiary of Maruzen Petrochemical)
                                                               (*) Hyundai Cosmo Petrochemical: JV of Cosmo Oil and Hyundai Oilbank
                                                                                                                                                                                                                                              48
[Renewable energy business] Achieving Stable Earnings in a Market
Where Demand Is Expected to Expand, Using the FIT Scheme

     Changes in wind power generation capacity                                                                                    Overview of Cosmo Eco Power

                                                                                                     Capital                        : 7.1 billion yen
                   Onshore plant capacity              Offshore plant capacity                       Number of power generators     : 166 (23 areas)
    400                                                                                              Power generation capacity       : 261,000 kW                                     ●

                                                                                                                                                                                      ●
(10,000 kW)                                                                                          Industry share                 : around 6%                                           Construction started(onshore)
                                                                                                     *As of 31 Mar,2021
                                                                                                                                                                                  ●                Kamiyuchi
                                                                                                                                                                                          (During the current medium-
                                                                                                                                                                                                ●

    300
                                                                                                                                                                                  ●
                                                                                                                                                                              ●

                                                                                                             Construction started(offshore)
                                                                                                                                                                                            term management plan)
                                                                                                                                                                                              (approx. 49,000 kW
                                                                                                                                                                ●

                                                                                                           Akita port & Noshiro Port                            ●
                                                                                                                                                                          ●
                                                                                                                                                                                  ●

                                                                                                        (FY2022)(approx. 140,000 kW)                                          ● ●

                                                           Over 1.5
    200                                                   million kW                                                                                        ●   ●
                                                                                                                                                                ●
                                                                                                                                                                                  ●       Under development(onshore)
                                                                                                                                                                              ●

                                                                                                        Construction started(onshore)                       ●                                      Abukuma
                                                                                                                                                                                           (During the next medium-
                                                                                                                                                            ●   ●

                                      Around                                                                         Oita
    100                             400,000 kW                                                           (During the current medium-
                                                                                                                                                                 ●
                                                                                                                                                                     ●                      term management plan)
                                                                                                           term management plan)                                                              (approx. 90,000 kW)
                                                                                                                    (approx. 14,000 kW)
                                                                                                                                                                     ●
                                                                                                                                                                      ●

                                                                                                                                                            ●
                                                                                                                                                                                                                   Under
        0                                                                                                                                 ●       ●
                                                                                                                                                        ●
                                                                                                                                                                              In operation(onshore)         development(onshore)
                Fy2020               FY2022               FY2030             Long-term
                                                                                                                                            ●

                                                                                                                          ●
                                                                                                                              ●
                                                                                                                                                                                                                  Chuki No.2
                                                                                                                ●
                                                                                                                                                                                         Chuki
                                                                                                                                                                                                          (During the next medium-
                                                                                 vision                                                                                               (1H FY2021)
                                                                                                                                                                                                           term management plan)
                                                                                                                                                                                  (approx. 48,000 kW)
    * Installed capacity is capacity commensurate with the Company’s investment.                                                                                                                             (approx. 50,000 kW)

                                                               Characteristics (strengths) of the Group
    ✓       Making Eco Power Co., Ltd., a pioneer in the wind power generation business (founded in 1997), a Group company in 2010.
    ✓       Achieving high on-wind availability (90% or more) through development, construction, operation, and maintenance within the Group.
    ✓       Reducing risks of changes in wind conditions in each region and securing stable profit by placing wind power plants across the nation.
    ✓       Aiming to expand the business in the long term by expanding sites on land and participating in an offshore wind farm project.

                                                                      Business environment in Japan
    ✓       The ratio of wind power generation to total power generation in Japan in 2030 is expected to be around three times
            greater (10 million kW) than the 2017 level (*2).
    ✓       The FIT scheme was introduced in 2012, and the acquisition price is fixed for 20 years.
    ✓       Entry into the market is not easy because advanced expertise is required in the identification of suitable sites
            and environmental assessment. (*3)
    (*2) Source: "The current situation of renewable energy and Calculation Committee for Procurement Price, etc. of this year" Agency for Natural Resources and
         Energy, September 2017                                                                                                                                                                                           49
    (*3) Identification of suitable sites (2 to 3 years) → Environmental assessment (4 to 5 years) → Construction work (1 to 2 years) → Start of operation
[Renewable energy business] Circumstances Surrounding the Wind Power
     Generation Business
    ✓ The Japanese government formulated a Green Growth Strategy towards Carbon Neutrality in 2050.
    ✓ Decarbonization in the electric power sector is a prerequisite and renewable energy will be introduced to a
      maximum extent.
    ✓ Offshore wind power generation is defined as a main power source from renewable energy.
    ✓ The Green Growth Strategy is outlined as follows.
     ・ The government sets introduction targets of 10 gigawatts (GW) by 2030 and 30 to 45 GW by 2040.
     ・ A government-led proactive project formation scheme (a Japanese version of the central method) is under
      consideration
     ・ Infrastructure development: Grid operation rules prioritizing renewable energy, grid construction linking
      locations suited to wind power generation and power demand locations and the construction of base ports

                          Concept for the Introduction of Offshore Wind Power Generation

<Installed wind power capacity>                                            Concept for the introduction                                                                         (GW)
                                                             30 to 45 GW      エリア別の導入イメージ
                                                                           by area
                                                                                                                                                 Hokkaido
                                                                                 Introduction goal                                                                 9.55 to
                                                                                                                             The Company’s                          14.65
                                                                                                                            main development
                                                                                                                                                                      1.24 to
            The Government is committed                                               FY2040                                     regions                               2.05

            to introducing 30 to 45 GW of
                                                                                    Approx. 30                                                Tohoku
            wind power capacity,                                                     to 45 GW                                                               5.9 to 9
            including of the floating type,
                                                                                                                                                            4.07 to
            by 2040.                                                                  FY2030                                       Hokuriku                  5.33
                                                                                   Approx. 10 GW                                     0.85 to 1.3
                                                                                                                                        0.7 to
                                                                                                                  Chugoku                0.85
                                                                                                                                                                        Tokyo
                                      10 GW                                                                          0.03 to 0.05
                                                                                                                                                            2.45 to 3.7
                                                                                                                        0.06
                                                                                                                                   0.75 to 0.9               0.35 to 0.37
          3.8 GW                                                                                       Kyushu                         0.75         1.35
                                                                                                                      Shikoku
                                                                                                     7.75 to                          Kansai              Chubu
                                                                                                      11.9                1.1 to
                                                                                                                           1.7

         FY2018
          2018年                     FY2030
                                     2030年                     FY2040
                                                                2040年                                 2.22 to
                                                                                                       2.98
                                                                                                                                                                                       50
    ※ Target value for offshore wind power generation only                     ※ From the summary of the Vision for the Offshore Wind Power Industry (Primary) (draft)
[Renewable energy business] Progress in Wind Power Generation Business

           ✓      The Goto-hassakubana onshore site started to operate in March, and the Chuki onshore site stated to operate in April.
           ✓      Three projects are under construction, and two project is under development. Several offshore projects are being
                  investigated and examined.

Onshore        Status                        Name                      Facility capacity

                                                                       Approx. 1,000                                          FY2021                    FY2022         To      After
            In operation          Goto-hassakubana                          kW

                                                                       Approx. 48,000
                                                                                                      In operation                                                   FY2030   FY2030
            In operation                    Chuki                           kW

                                                                       Approx. 49,000
       Under construction               Kamiyuchi                           kW
                                                                                                    Operations scheduled to start in the second half of FY2022
                                                                       Approx. 14,000
       Under construction                    Oita                           kW

                                                                       Approx. 90,000
           Being developed         Abukuma-minami                            kW1

                                                                       Approx. 50,000
                                                                                                                 Operations scheduled to start in the second half of FY2026
           Being developed              Chuki No.2                          kW
                                                                                           Subject to the act on renewable
Offshore       Status                        Name                      Facility capacity     energy sea area utilization

                                                                           Approx.                                             Operations scheduled to start in
       Under construction    Akita Port & Noshiro Port                                            Harbor area
                                                                                                                  3
                                                                        140,000 kW 1                                                the second half of FY2022
                              Offshore Yurihonjo-shi,                      Approx.                                           Expecting to
                                                                                                                                       to place
                                                                                                                                          place a
                                                                                                                                                a bid
                                                                                                                                                  bid
                 FS                                                                            Promotional area              Expecting
                                       Akita                            700,000 kW1                                            in the
                                                                                                                               in the public
                                                                                                                                      public tender
                                                                                                                                             tender

                              Offshore northwest of
                 FS                   Aomori                               Approx.
                                                                                             High potential area
                                (The Sea of Japan, offshore near       500,000 kW1,2
                                            Aomori)
                                Central sea area near
                                                                                           Areas in which preparations
                 FS                     Akita                              Approx.
                                                                                           have advanced to a certain
                             (Offshore near Katagami-shi/Akita-shi,    500,000 kW1,2
                                                                                                      level
                                             Akita)
                                 Offshore near Yuza,
                                                                                           Areas in which preparations
                 FS                   Yamagata                             Approx.
                                                                                           have advanced to a certain
                                                                       500,000 kW1,2
                                 (Offshore near Yuza, Yamagata)                                       level

                             Offshore north of Niigata                     Approx.
                                                                                           Areas in which preparations
            Assesment                                                                      have advanced to a certain
                             (Offshore near Murakami-shi/Tainai-shi,   400,000 kW1,2
                                                                                                      level
                                             Niigata)

                              Offshore in Ishikari Bay,                    Approx.
            Assesment                                                                                    -
                                     Hokkaido                          1,000,000 kW1,2

      *1 Installed capacity of the whole project
      *2 Maximum capacity stated in the environmental impact assessment report                                                                                                         51
      *3 Not subject to the Act on Promoting the Utilization of Sea Areas for the Development of Marine Renewable Energy Power Generation Facilities due to the port zone
You can also read