Ashburton Large Format Retail - Economic impact assessment 15 July 2019 -final - Ashburton District Council
←
→
Page content transcription
If your browser does not render page correctly, please read the page content below
Ashburton Large Format
Retail
Economic impact assessment

15 July 2019 –final
Ashburton Large Format
Retail
Economic impact assessment

Prepared for
River Crossing Ltd

Document reference: RIV002.18
Date of this version: 15 July 2019
Report author(s): Derek Foy
Director approval: Greg Akehurst
www.me.co.nz

Disclaimer: Although every effort has been made to ensure accuracy and reliability of the information
contained in this report, neither Market Economics Limited nor any of its employees shall be held liable for
the information, opinions and forecasts expressed in this report.

Contents
1     INTRODUCTION ................................................................................................................. 1

1.1   KEY ISSUES............................................................................................................................ 1

1.2   OBJECTIVES .......................................................................................................................... 1

2     THE PROPOSED DEVELOPMENT ........................................................................................ 2

2.1   LOCATION ............................................................................................................................ 2

2.2   DEVELOPMENT OVERVIEW ....................................................................................................... 2

2.3   CATCHMENTS ........................................................................................................................ 3

2.4   SALES PERFORMANCE ............................................................................................................. 4

3     PLANNING ISSUES.............................................................................................................. 5

3.1   DISTRICT PLAN ...................................................................................................................... 5

3.2   URBAN DEVELOPMENT CAPACITY NPS ...................................................................................... 8

4     ASHBURTON RETAIL ENVIRONMENT ............................................................................... 10

4.1   TOWN CENTRE ECONOMIC ACTIVITY ......................................................................................... 10

4.2   INNER COMMERCIAL AREA FLOORSPACE AUDIT ........................................................................... 11

4.3   OTHER CENTRES................................................................................................................... 13

4.4   PLANNED SUPPLY CHANGES .................................................................................................... 13

4.5   RETAIL SPEND FLOWS ............................................................................................................ 13

4.6   HOUSEHOLD PROJECTIONS ..................................................................................................... 16

4.7   DEMAND PROJECTIONS ......................................................................................................... 16

5     IMPACT ASSESSMENT...................................................................................................... 18

5.1   IMPACT TYPES ..................................................................................................................... 18

5.2   DIRECT RETAIL IMPACTS......................................................................................................... 18

5.3   INDIRECT CENTRE IMPACTS ..................................................................................................... 24

6     ECONOMIC AND OTHER BENEFITS .................................................................................. 27

6.1   TRAVEL EFFICIENCY AND ACCESSIBILITY ..................................................................................... 27

6.2           SHORT TERM CONSTRUCTION EFFECTS ...................................................................................... 27

6.3           CONSUMER CHOICE .............................................................................................................. 27

6.4           EMPLOYMENT EFFECTS .......................................................................................................... 27

7              CONCLUSION................................................................................................................... 29

Figures
FIGURE 2.1: SITE LOCATION ........................................................................................................................ 2

FIGURE 2.2: PROPOSED DEVELOPMENT INDICATIVE SITE PLAN ........................................................................... 3

FIGURE 2.3: PROPOSED DEVELOPMENT SALES PERFORMANCE ON OPENING ($M, 2020) ...................................... 4

FIGURE 4.1: ASHBURTON INNER COMMERCIAL AREA EMPLOYMENT BY ZONE (2017) ......................................... 10

FIGURE 4.2: ASHBURTON INNER COMMERCIAL AREA RETAIL AND HOSPITALITY STORE COUNTS.............................. 12

FIGURE 4.3: ASHBURTON INNER COMMERCIAL AREA STORE RETAIL AND HOSPITALITY GROSS FLOORSPACE (M2) ...... 12

FIGURE 4.4: DESTINATION OF SPEND BY ASHBURTON RESIDENTS ..................................................................... 14

FIGURE 4.5: ORIGIN OF ASHBURTON SALES ................................................................................................. 15

FIGURE 4.6: CATCHMENT HOUSEHOLD PROJECTIONS..................................................................................... 16

FIGURE 4.7: CATCHMENT RETAIL DEMAND PROJECTIONS ($M) ....................................................................... 17

FIGURE 5.1: CENTRE SALES WITHOUT PROPOSED DEVELOPMENT (IN 2020, $M) ............................................... 20

FIGURE 5.2: ORIGIN OF PROPOSED DEVELOPMENT SALES BY ZONES (IN 2020, $M, LFR AND SFR STORES) ........... 21

FIGURE 5.3: ORIGIN OF PROPOSED DEVELOPMENT SALES BY STORE TYPE (IN 2020, $M, LFR AND SFR STORES)..... 21

FIGURE 5.4: CENTRAL ASHBURTON RETAIL SALES WITH PROPOSED DEVELOPMENT, INCLUDING LFR STORE (IN 2020,
$M) ....................................................................................................................................................... 22

FIGURE 5.5: PROPOSED DEVELOPMENT EFFECT ON ASHBURTON DISTRICT RETAIL LEAKAGE.................................. 22

FIGURE 5.6: DIRECT RETAIL IMPACTS ON CENTRE SALES ($M, IN 2020) ........................................................... 23
1 Introduction
Market Economics Ltd (M.E) has been commissioned by River Crossing Ltd to assess the potential economic
and retail impacts of a proposed large format retail store, and small amount of small format retail space on
South Street, Ashburton.
1.1 Key issues
The proposed retail development would represent an increase of retail supply in Ashburton, and therefore
change how consumers in the area access retail goods. That change may have an effect on the sales of
other Ashburton retail businesses, and, relevant to this RMA assessment, the centres they are located in.
Those effects are the subject of this assessment.
1.2 Objectives
The specific objectives of this report are to:
• Examine current and future demand for retail space in the study area (Ashburton
District).
• Determine current retail supply in the study area, and identify any likely changes to that
supply that is currently in the pipeline.
• Assess the likely direct retail effects of the proposed retail development on existing
retail centres both in central Ashburton, and any other centres in Ashburton.
• Assess the likely cumulative direct retail effects of the proposed development and any
other identified new retail supply on existing retail centres in the study area.
• Consider the likely flow-on, indirect effects of the proposed development that will occur
as a result of the direct retail effects.
• Consider other positive and negative economic effects of the proposed development.
1.3 Update
This report is substantially unchanged from the version peer reviewed by Property Economics Ltd in “River
Crossing Limited Development Economic Peer Review” (“the peer review”). Since the peer review was
completed in June 2019, there has been revision to the proposed building plans resulting in a decrease in
floor area now proposed for both the large and small format retail tenancies, with some associated
reduction in the impacts assessed arising from the creation of those tenancies. We provided an addendum
to our original version of this report (i.e. the version that was reviewed) responding to several matters
identified in the peer review. Our addendum was dated 28 June 2019, and it has not been necessary to
update that document.
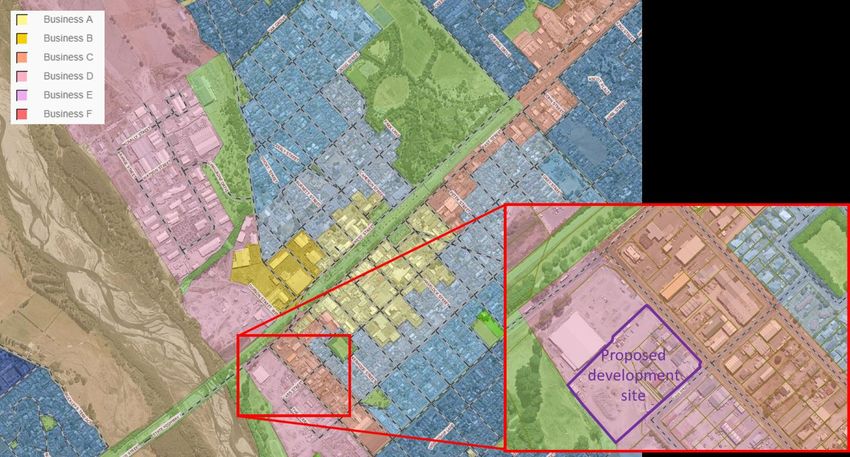
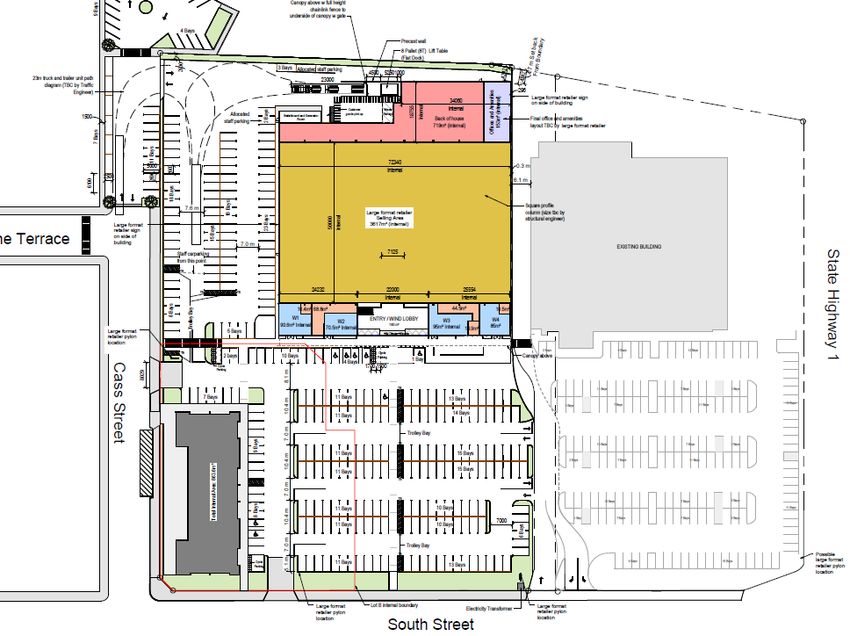
Page | 12 The proposed development 2.1 Location The development site is located adjacent to the Countdown on South St, Ashburton, immediately north of the Ashburton River. The site is zoned Business D in the operative Ashburton District Plan. Figure 2.1: Site location 2.2 Development overview The proposed development is for some 6,036m2 of gross floor area (GFA), comprised of 4,831m2 for the anchor tenant, a large format retail (“LFR”) store1, 341m2 of small format retail space in the LFR store building2, and 864m2 of retail space in a standalone building3. (Figure 2.2). All of the retail activities proposed are non-complying in the Business D zone. 1 Including amenities, lobby and offices 2 Indicatively split across four tenancies (71m2, 85m2, 95m2 and 258m2), but that configuration is subject to change. 3 Indicatively four tenancies of c.200-240m2 each Page | 2
Figure 2.2: Proposed development indicative site plan

2.3        Catchments
The proposed development would have a District-wide draw for most of its elements, and would likely also
attract some spend from neighbouring districts, predominantly those to the south. The likely draw of
customers is assessed in section 4.5. As with other retail activity in Ashburton now, the proposed
development would be expected to make around 75% of its sales to Ashburton District residents, and the
balance to consumers from other districts. For this assessment the catchment for the proposed
development is taken to include all of Ashburton District, Timaru District, Mackenzie District and Waimate
District, with penetration into each consistent with that currently achieved by Ashburton’s existing
retailers, on a retail storetype by storetype basis. The proposed LFR store is also assumed to capture a share
of its sales from other locations, again consistent with currently observed capture as assessed in section
4.5.

Because the proposed small format retail tenancies in the LFR store development would rely, to a large
extent, on their location adjacent to that store for their patronage, the same catchment penetration into
each part of the catchment is also assumed for those stores.

Page | 3
2.4        Sales performance
The LFR store is confirmed as the tenant of the majority of the development, with tenants yet to be
confirmed for the 1,205m2 of small format retail tenancies. For this assessment we have derived the
development’s projected sales by considering the market penetration into each catchment for each
storetype. We then cross-checked that sales performance against the performance of comparable, existing
developments in other locations, and against estimated sales of comparable stores (other department
stores and small format retailers) in Ashburton. The sales performance applied in the impact modelling is
shown in Figure 2.3.

Figure 2.3: Proposed development sales performance on opening ($m, 2020)

                           GFA (m2)    $/m2    Sales ($m)
LFR tenancy                    4,831 $   2,330 $      11.3
SFR tenancies                  1,205 $   4,190 $       5.0
Total development              6,036 $   2,705 $      16.3

The LFR store is projected to yield sales of $11.3m, which on opening would give it the average (post-
impact) sales productivity of Ashburton’s other department stores. For the purposes of this assessment we
have not assumed any particular storetypes for the SFR tenancies, because the relevant effects are at a
centre-wide (or at least zone-wide) level, and so the SFR tenancies are attributed an average sales
productivity (of $4,000/m2 in 2018, increasing to nearly $4,200/m2 in 2020) and would in aggregate
compete with, and draw sales away from retailers elsewhere in Ashburton. The assumption is that they
would draw sales away only from the retailers in the Business A zone, which is the zone with stores that
are most similar to the SFR stores proposed.

Page | 4
3 Planning issues
A planning assessment of the proposal has been undertaken by David Harford Consulting Ltd, and
adherence or otherwise to plan objectives, policies and rules is not provided in this report. However, it is
useful to provide a summary of the key planning matters relevant to the application to place the economic
assessment in a regulatory context.
3.1 District Plan
3.1.1 General issues
The operative Ashburton District Plan (ADP) sets out that:
Ashburton’s business zones represent significant investment, and are part of the
physical resource of the District. Business activities provide employment and generate
economic activity which enables communities to provide for their economic and social
well-being. The land and buildings of business areas provide the space and resources
for these activities to take place. It is therefore necessary that they are recognised for
the importance of their role in the District’s economy. These buildings may also be
used for undertaking social and cultural activities, also important to the community’s
wellbeing.4
A key issue identified is that the inappropriate location of business activities or the fragmentation of
business areas can result in loss of vitality, convenience, accessibility and the identity of such areas5. The
District’s town centres are recognised as an important community resource, the commercial heart of
towns, and an important influence on community perception of their local environment. Centres are also
important to provide good access to goods and services, and commercial activities “should be located in
reasonably accessible areas that are or can be economically serviced”.
Consolidation of business areas is also identified as an important driver of the location of economic activity
in Ashburton:
Consolidation of business areas will prevent the general dispersal of activities into new
locations, which may leave existing areas vacant, unattractive, under-utilised and
unable to provide the services the community desires. Given the central and or
convenient location of most business areas within the District, consolidation of
business activities into defined areas, combined with public investment in roads and
other services in these areas, will assist the vitality of business centres. This has
benefits for the District’s community in terms of the range of services available, their
convenience, pleasantness and accessibility.6
4 ADP section 5.1
5 ADP section 5.2.1
6 ADP section 5.2.1
Page | 53.1.2 Business zones
The main business zones of relevance to this assessment are:
• The Business A zone provides principally for small scale retail activity, and includes the
inner commercial area of Ashburton, and smaller suburban shopping centres in
Ashburton and in rural towns. This zone is the focal point of small-scale shops, and is
intended to be a pedestrian friendly environment that provides for a wide range of
residential, visitor accommodation, community and commercial activities.
• The Business B Zone provides predominantly for large format retail activities, which
typically require large carparks. Shopping malls are intended to be prevented from the
zone to avoid the dispersal of retail activity and avoid detracting from the Business A
zone. The Business B zone is recognised as a vehicle-oriented activity and anticipates
some limited smaller retailing premises.
• The Business C zones provides for commercial, retail, service and community activities,
are located adjacent or close to Business A and B zones, and provide for larger scale
retailing such as car yards. The character is defined by larger buildings with off-street
parking and limited landscaping.
• The Business D Zone anticipates mainly light industrial, service and commercial
activities, with limited retailing which should be auxiliary to an industrial or service
activity. Some parts of the zone will undergo a gradual change to introduce a higher
level of amenity to some areas. The proposed development is located in this zone.
3.1.3 Key objectives and policies
Key objectives and policies relevant to this assessment include:
• Objective 5.1: Growth, maintenance and consolidation of business areas.
• Policy 5.1A: Maintaining and enhancing the function, integrity, convenience and
viability of the inner commercial areas of Ashburton, Methven and Rakaia, and small
villages.
• Policy 5.1B: Ensuring that opportunities are available in the suburban areas of
Ashburton for the establishment and on-going operation of business activities,
providing retail and service activities to local neighbourhoods, in locations which are
convenient.
• Policy 5.1C: Providing for the establishment of large format/big box retail activities that
generate high volumes of traffic and require large areas of parking, in locations which
do not detract from the amenity of adjoining areas, the safety and efficiency of the
roading network, or from the consolidation of the inner retail area of central Ashburton.
The explanation and reasons for these policies include that:
Page | 6• Inner commercial areas are focal points for a broad range of commercial, professional
and administrative activities in the District’s towns.
• The ADP aims to encourage the continued vitality, pleasantness and convenience of
these centres and their role in the attractiveness and identity of the District’s towns.
• The consolidation of business areas is important to ensure that people have access to
well-maintained and functioning business areas with a wide range of business activities
that maintain their vitality, pleasantness and convenience.
• The dispersal of business activities to new locations can leave existing areas vacant,
under-utilised, unattractive, and unable to provide the services the community desires.
• The occupation and redevelopment of existing sites is to be encouraged through
enabling a broad range of activities to establish throughout the business areas, although
this is not intended to prevent growth of business areas alongside the existing areas,
provided that the adverse effects of this growth are avoided, remedied or mitigated.
In summary then, it is anticipated that the majority of business activity will be accommodated within areas
zoned for that purpose, but with some opportunity for future expansion.
3.1.4 Key rules
There are two key rules that are relevant to this assessment:
• Business A zone: the maximum gross floor area of any individual retail tenancy shall not
exceed 500m2 (5.8.2 (f)). Larger tenancies are discretionary activities (5.8.5(f)).
• Business D: retail activity is limited to that which is ancillary to goods produced or
processed on site (5.8.2 (i)).
These rules are relevant because they indicate that the LFR store would not be permitted in the Business
A zone, where a fine-grained urban fabric is anticipated, and that the proposal is non-complying in the
Business D zone. The proposal would be a permitted activity on retail/economic grounds if it were in the
Business B zone, and would be appropriate in that zone, although there is insufficient vacant capacity there
to accommodate a store the size of the LFR store proposed.
Overall, the retail floorspace rules exist7 to ensure the consolidation of the business areas and the
functioning, integrity, convenience and viability of the inner commercial areas of the towns is realised, and
for other matters such as reverse sensitivity and traffic effects. The rules aim to avoid, in inner commercial
areas:
• the closure of shops
• a reduction in the range of services available
• a loss of vitality and attractiveness to shoppers
7 As explained in ADP section 5.7.16
Page | 7• undermining their roles as principal areas for comparison retailing, and as focal-points
and sources of identity for their communities
• a loss of convenient, walkable access for pedestrians.
3.1.5 Summary of District Plan content
The adherence or otherwise to the ADP objectives, policies and rules will be provided in the planner’s report
accompanying the application for the LFR store. Understanding key ADP coverage in relation to economic
and retail matters is important for this report, and an assessment of the key relevant District Plan content
indicates that:
• There is a recognition of the importance of the Ashburton inner commercial area as the
focal point of retail and economic activity in the town, as there is in other towns in the
District.
• The LFR component of the proposed development would not be permitted in the
Business A zone, but would in the Business B zone. The SFR tenancies would be
permitted in the Business A zone.
• The ADP does anticipate some out of zone development can be appropriate to provide
opportunities for growth which may otherwise be precluded from establishing as
permitted or discretionary activities.
3.2 Urban Development Capacity NPS
The National Policy Statement (NPS) on Urban Development Capacity provides direction to policy- and
decision-makers under the RMA in relation to planning for urban environments. The focus of the NPS is
ensuring that local authorities enable urban environments to grow and change in response to the needs of
their population, and provide enough space for their populations to live and work.
The following extracts from the NPS are relevant to this assessment:
Objective OA2: Urban environments that have sufficient opportunities for the
development of housing and business land to meet demand, and which provide
choices that will meet the needs of people and communities and future generations
for a range of dwelling types and locations, working environments and places to locate
businesses
Policy PA1: Local authorities shall ensure that at any one time there is sufficient
housing and business land development capacity8
PA3: When making planning decisions that affect the way and the rate at which
development capacity is provided, decision-makers shall provide for the social,
8 with different levels of availability in the short, medium and long terms
Page | 8economic, cultural and environmental wellbeing of people and communities and
future generations, whilst having particular regard to:
a) Providing for choices that will meet the needs of people and communities and
future generations for a range of dwelling types and locations, working environments
and places to locate businesses;
b) Promoting the efficient use of urban land and development infrastructure and
other infrastructure; and
c) Limiting as much as possible adverse impacts on the competitive operation of
land and development markets.
PA4: When considering the effects of urban development, decision-makers shall take
into account:
a) The benefits that urban development will provide with respect to the ability for
people and communities and future generations to provide for their social, economic,
cultural and environmental wellbeing; and
b) The benefits and costs of urban development at a national, inter-regional,
regional and district scale, as well as the local effects.
Those extracts together indicate that there is some responsibility incumbent upon ADC to provide adequate
space for the needs of the community. One such need is access to retail goods, and of relevance to this
assessment to those sold from large retail stores in particular. Given the limited opportunities for large
format retail (LFR) to establish in, compliance with the NPS supports the need for some additional LFR space
in Ashburton. Development of the site would provide for additional retail space so that:
• There is adequate provision made in Ashburton for retail space. The development
would fill a gap that currently exists in the District in that market so that supply more
closely matches demand. This will allow local residents to shop locally and businesses
that wish to establish in the District a place to locate (consistent with OA2, PA3a and
PA4a).
• The site, which is accessible given its proximity to State Highway 1 and the town centre
will provide efficient access to retail supply, both for Ashburton residents and residents
of the low density rural catchments to the south (consistent with OA2 and PA3b).
• Adverse effects under PA3c and PA4b are limited, by restricting the range of retail
sought for the development, and creating positive effects of providing for retail types
not currently widely provided for.
Taking all these factors into account, the proposed development is consistent with NPS objectives and
policies, and will enable ADC to provide for the needs of growth. Without the proposed development’s
supply, it would be very difficult for a large LFR retailer to enter the Ashburton market, indicating there is
inadequate provision for this type of retail activity in Ashburton. Consenting the application would make it
easier for Council to meet its requirements under objective OA2, policy PA1, and policy PA3 of the NPS.
Page | 94 Ashburton retail environment
This section provides an overview of the Ashburton retail environment, including town centre employment,
business count, floorspace and planned supply changes, as well as catchment spending flow patterns and
market size assessment.
4.1 Town centre economic activity
The Ashburton central Business A zone accommodates some 3,440 MECs9, of which only 650 (19%) are
engaged in the retail and hospitality sector10. By far the largest proportion are in sectors typically based in
offices (commercial sectors such as professional services), where there are 1,400 MECs employed, 41% of
the Business A workforce. There are broadly as many employees in the Civic and services sector (650) as in
retail and hospitality in the Business A zone (Figure 4.1).
In the Business B zone, Industrial employment is much more prominent than it is in the Business A zone.
That is partly due to the spatial definition of the zones is this assessment11, but the employment structure
in this zone reflects the ADP description of the area’s built form and intended economic role. The retail and
hospitality sector is very important in the Business B zone, with over 500 MECs employed, which reflects
the presence of several very large, LFR stores such as The Warehouse and Mitre 10 Mega.
Figure 4.1: Ashburton inner commercial area employment by zone (2017)
Business Business Business Business Business Business
A B C A B C
Employment (MECs) Businesses
Retail and hospitality 650 520 400 100 20 40
Primary industries 240 100 40 90 - 10
Industrial 490 670 710 120 50 60
Office-based 1,400 110 110 270 40 50
Civic and services 660 50 130 90 10 20
Total 3,440 1,450 1,390 670 120 180
Share of employment Share of businesses
Retail and hospitality 19% 36% 29% 15% 17% 22%
Primary industries 7% 7% 3% 13% 0% 6%
Industrial 14% 46% 51% 18% 42% 33%
Office-based 41% 8% 8% 40% 33% 28%
Civic and services 19% 3% 9% 13% 8% 11%
Total 100% 100% 100% 100% 100% 100%
9 Modified employment count, a measure of employment which includes both paid employees and working proprietors
10 Retail and hospitality is retail trade and accommodation and food services; Primary industries is agriculture and mining; Industrial
is manufacturing, utilities, construction, wholesale and transport; Office-based is ANZSIC divisions J to N (information media,
finance, property, professional and administrative services), and Civic and services is public administration, education, health, arts
and recreation and other services
11 because data is aggregated to zone totals as the sum of meshblocks, with meshblocks being the most detailed spatial level at
which business demography data is published. Some of the meshblocks classified as the Business B for this assessment actually
extend into the Business D zone
Page | 10The Business C zone is split into two parts that are north and south of the core town centre, and are peripheral areas adjacent to that core. The Business C zone on those locations has a predominantly industrial form, with a large proportion of retail employment (total 400 MECs) being in car yards and trade retail, although the Ashburton North Countdown at Willis St (105 MECs) and Bunnings Warehouse (60 MECs) are both in the Business C zone. 4.2 Inner commercial area floorspace audit 4.2.1 Methodology In April 2018 we visited Ashburton and recorded the type and location of retail and hospitality activities in Ashburton’s inner commercial Business A, B and C zones. We reconciled the classification of each store with Statistics NZ Business Directory information where possible, mostly for larger stores, although in many retail categories there will be some difference between our categorisation and Statistics NZ’s, as it is not always easy to categorise particular stores. One example of this is department stores. Statistics NZ identify four department stores (The Warehouse, Briscoes, Farmers, Harvey Norman) in Ashburton, although two of those (Briscoes and Harvey Norman) might have been coded respectively as homewares and furniture stores, without interrogation of the Business Directory dataset. Any differences between our categorisation and Statistics NZ’s is not material, because ultimately it is the total quantum of floorspace and sales that effects the direct impact assessment, not the allocation of activities within that total. The focus of this section is on the retail and hospitality businesses that form the core of the Ashburton town centre urban fabric, so does not include data for service businesses on the ground floor (e.g. banks, insurance, automotive), or any above-ground floor activity or space. Instead, a broader assessment of town centre economic activity is provided in section 4. Data is aggregated to storetypes that are competitors of the proposed development, and so those of little relevance (notably supermarkets and food retail) are grouped to a single “Other retail and hospitality” group. 4.2.2 Results The survey recorded some 70 retail and hospitality businesses in the Business A zone, 12 in the Business B zone and 32 in Business C. In the Business A zone, the dominant storetype was apparel stores (20 stores, 29% of Business A stores), with 36 stores in the large miscellaneous retail category (51% of Business A stores by number) (Figure 4.2). All other categories in the Business A zone had less than five stores, with most having only one or two. Similarly in the Business B zone, there were only one or two stores in each category. There were 8 vacant tenancies recorded in the Business A zone, a vacancy rate of 10% (by store count, or 9% by floor area). That is towards the upper end of a range within which most retail centres would attempt to keep vacancy rates. Some level of vacancies are inevitable to accommodate tenant churn and as premises are refitted, but a high rate indicates a lack of demand for space and potentially a struggling centre. That does not appear to be the case in Ashburton, with sales per store and per employee similar to Page | 11
national average levels (as assessed for, although not specifically presented in section 5.2). Anecdotally
there are quite significant problems with buildings being unfit for occupation due to structural stability
concerns, and while we do not have data about how many buildings in Ashburton fall into that category,
that may be a reason why some of the premises are vacant. Not all of the premises recorded as vacant are
listed for lease or sale12, indicating that the owners may not be actively seeking tenants.

Figure 4.2: Ashburton inner commercial area retail and hospitality store counts

                                      Business Business Business            Business Business Business
                                                                  Total CBD                            Total CBD
                                         A         B       C                   A          B      C
                                      Number of stores                      Share of stores
Department stores                             2         2    -            4       2%         2%     0%        4%
Furniture                                  -            2       1         3       0%         2%     1%        3%
Textiles                                      4      -          1         5       4%         0%     1%        4%
Houseware                                     1      -       -            1       1%         0%     0%        1%
Electrical                                    1         1    -            2       1%         1%     0%        2%
Recreation                                    4         2       3         9       4%         2%     3%        8%
Apparel                                      20         1    -           21      18%         1%     0%       18%
Pharmaceuticals                               2      -          1         3       2%         0%     1%        3%
Other retail and hospitality                 36         4      26        66      32%         4%    23%       58%
Total                                        70        12      32       114      61%        11%    28%     100%
Vacant (n)                                    8      -          4        12
Vacant (%)                                 10%         0%    11%        10%

Despite the very large stores in the Business B zone, the Business A zone has much more gross floor area
devoted to retail and hospitality stores (22,080m2) than the Business B zone (16,330m2). Average store size
in the former is just over 300m2, while in the latter is 1,360m2 (Figure 4.3). The adjacent Business C zone
makes up only 18% of the retail and hospitality floorspace measured, with nearly 50% being in the Business
A zone.

Figure 4.3: Ashburton inner commercial area store retail and hospitality gross floorspace (m2)

                                      Business Business Business            Business Business Business
                                                                  Total CBD                            Total CBD
                                         A        B        C                   A         B       C
                                      GFA (sqm)                             Share of GFA
Department stores                        4,500    8,090      -      12,590       10%       17%      0%       27%
Furniture                                  -        610      680      1,290       0%        1%      1%        3%
Textiles                                 1,860      -        -        1,860       4%        0%      0%        4%
Houseware                                  110      -        -          110       0%        0%      0%        0%
Electrical                                 660      700      -        1,360       1%        1%      0%        3%
Recreation                               1,220    1,020    1,330      3,570       3%        2%      3%        8%
Apparel                                  4,700      250      -        4,950      10%        1%      0%       11%
Pharmaceuticals                            410      -        100        510       1%        0%      0%        1%
Other retail and hospitality             8,620    5,660    6,360    20,640       18%       12%     14%       44%
Total                                   22,080   16,330    8,470    46,880       47%       35%     18%     100%
Vacant (n)                               2,065      -        719      2,784
Vacant (%)                                   9%       0%       8%        6%

12   In a search of properties in central Ashburton for sale or lease, May 16 2018

Page | 12
4.3 Other centres
The Ashburton town centre is very much the focal point of retail activity in the District. There are several
other retail centres, including Tinwald, small neighbourhood centres at Allenton, Netherby and Creek Rd,
and rural service centres such as Mayfield and Methven, but these all serve a very local role, and have a
very limited amount of retail floorspace.
4.4 Planned supply changes
We are aware of the following two proposals for new retail developments in Ashburton:
• 22-34 Kermode St, Business B zone. A proposed new large format retail centre of up to
3,000m2 across the road from Mitre 10 Mega.
• 519 East St, Ashburton, Business C zone. A proposed new large format retail centre of
760m2, across the road from the Ashburton North Countdown supermarket.
The impact assessment below takes these new developments into consideration, and although
construction has not yet started on them this assessment assumes that they would be fully tenanted and
form part of the existing environment at the time the proposed development opens in 2020. A further
assumption is that the new space would accommodate stores in a similar proportion to existing LFR stores
in Ashburton, except with no department stores or supermarkets.
We are aware of a number of buildings in Ashburton that do not meet current earthquake standards, for
which reason they are untenanted. That indicates that there would need to be some structural work
undertaken on those buildings to bring them up to tenantable standard, however we are unaware of any
specific proposals for any such work. There are also some vacant lots in the Business A zone where buildings
have been recently demolished, and it is possible that small format retail developments might reappear o
those sites, although again we have no knowledge of those. Any such developments would have little effect
on the impacts assessed, given the small size of the potential developments in relation to the existing retail
base.
4.5 Retail spend flows
4.5.1 Marketview data
For this assessment Marketview data was used to understand the current retention of local spend in
Ashburton, and inflows from other areas. Marketview data identifies credit and debit card transactions
from BNZ customers, and establishes the geographic link between the residential address of the
cardholders and the location and type of merchant involved in the transaction. It is estimated that the
Marketview transactions data accounts for approximately 15% of all spending in the NZ economy.
Marketview data is only made available in an aggregated form that protects the confidentiality of
customers and the commercial sensitivity of merchants.
Page | 13Data for this project was commissioned specifically for this project, and covers the year ending March 2018.
Data was provided for:
• Merchant location being the following territorial authorities: Ashburton, Christchurch,
Timaru, Selwyn, Rest of NZ;
• Consumer place of residence: Ashburton, Timaru, Mackenzie, Waimate and all other
places combined;
• Spending in the following storetypes: apparel, appliances; department stores; food and
liquor retail; furniture/flooring; homeware; other retail; toys, games and sports. These
categories were defined to reflect the general competitive sectors for LFR sales, and
were limited by the availability of data from Marketview give their confidentiality rules
that require a minimum level of activity in each published group.
That data provides an understanding of retail flows into and out of Ashburton, and gives a basis for
estimating potential future changes to these patterns, as the proposed development changes the ability to
access particular types of retail goods.
4.5.2 Destination of spend by Ashburton residents
The Marketview data shows that there is very high leakage in some categories, especially housewares
(where 61% of total spend by Ashburton residents is not spent in Ashburton but leaks to other
destinations), recreation (56% leakage), apparel (65% leakage) and furniture (61% leakage) (Figure 4.4).
The LFR store would be expected to have some competitive overlap with all of those specialty storetypes,
although department stores selling those specialty products would also be competitors for the LFR store.
Leakage of department store spend was the lowest (26% leakage) of the storetypes assessed, indicating
the Ashburton has a relatively good representation of department store brands now (Farmers and The
Warehouse).
Figure 4.4: Destination of spend by Ashburton residents
Spent in Spent in Spent
Ashburton Christchurch elsewhere
Department stores 74% 15% 11%
Furniture 39% 48% 13%
Textiles no data
Houseware 39% 41% 20%
Electrical 61% 30% 9%
Recreation 44% 36% 21%
Apparel 35% 45% 20%
Pharmaceuticals no data
Other retail and hospitality 66% 21% 13%
Total all categories 68% 16% 16%
Nevertheless, given 15% of Ashburton residents’ spend in department stores flows out to Christchurch,
and 11% elsewhere (7% is outside the areas defined, and 4% to Timaru and Selwyn), there is potential to
Page | 14recapture some of that leakage. Given the similarity between product ranges in stores within each brand
(e.g. Rolleston The Warehouse vs. Ashburton The Warehouse), a new brand in the Ashburton market would
be likely to influence consumers to stop visiting Christchurch LFR stores and repatriate that spend to
Ashburton. This assessment does not assume that the LFR store will reduce leakage, and so as a ‘worst
case’ scenario assumes that LFR store’s sales will come predominantly from sales diverted from local
retailers, with only a small share from non-local businesses.
4.5.3 Origin of sales by Ashburton businesses
Ashburton’s retail stores attract a fairly consistent proportion of their sales from local (Ashburton District)
residents, at 70-80% across each category (Figure 4.5). Of the balance (20-30% of sales), most sales are
made to residents from outside Timaru, Mackenzie and Waimate, with only around 5-12% of total
Ashburton sales made to residents of those areas. That data indicates that the LFR store is unlikely to attract
any significant proportion of its sales from non-locals, and will be quite reliant on local sales. For that
reason, the conservative assumption is made that the LFR and associated SFR stores will attract consumers
from the same geographic distribution as Ashburton’s current retail stores.
Figure 4.5: Origin of Ashburton sales
Spent
Spent from
coming in
Ashburton
from
residents
elsewhere
Department stores 76% 24%
Furniture 81% 19%
Textiles no data
Houseware 74% 26%
Electrical 79% 21%
Recreation 71% 29%
Apparel 73% 27%
Pharmaceuticals no data
Other retail and hospitality 69% 31%
Total all categories 76% 24%
4.5.4 Online spending
Online spending is taken into account in the Marketview data summarised above, and is therefore built
into our impacts assessment. Nationally online spending is currently about 9.1%13. It is not known what
that proportion is for Ashburton households, although we have no reason to suspect it is different to the
national average. Any increased local provision of retail space will help to reduce existing leakage,
supporting local jobs and retaining money in the Ashburton community, and mitigating the direct retail
effects on trade competitors in Ashburton.
13 $4.5b out of $49b, per https://www.bnz.co.nz/business-banking/support/commentary/online-retail-sales-index
Page | 154.6 Household projections
The household projections applied in this assessment are those recently (2017) published by Statistics NZ,
for the catchment identified in section 2.3, which takes into account the above assessment of spending
flows (section 4.5). There are currently (2018) nearly 40,000 households living in the broad catchment, with
13,700 in Ashburton District. The projections indicate that only modest growth is expected in the
catchment, with average annual growth approaching 1% in Ashburton, but slower in other parts of the
catchment. (Figure 4.6).
Figure 4.6: Catchment household projections
Growth 2018-2038
2018 2028 2038
n % Avg. ann.
Ashburton District 13,720 14,800 16,200 2480 18% 0.8%
Timaru District 20,350 21,530 22,270 1920 9% 0.5%
Mackenzie District 1,900 2,010 2,110 210 11% 0.5%
Waimate District 3,490 3,620 3,730 240 7% 0.3%
Total these districts 39,460 41,960 44,310 4850 12% 0.6%
4.7 Demand projections
Projections of retail demand show similar patterns to household projections. In this section not all retail
demand is shown, and only demand in the competitive sectors assessed in section 5. That is because
demand in other sectors, such as supermarkets, is unimportant for the LFR store’s sales, although spend in
other retail sectors, and non-retail sector activity, is important to understand as the base for total centre
activity that may be impacted by the development.
Household growth in the Ashburton catchment is expected to drive an increase in retail14 demand of $56m
to 2038 (40%) (Figure 4.7). That is an average annual growth rate of 1.7%, which takes into account
historically observed trends for households to spend more on retail goods over time, which is why the
demand projections in Figure 4.7 exceed the household growth rates in Figure 4.6. Total catchment
demand in the relevant storetypes is currently approaching $400m, and even on the back of the relatively
modest household growth projected, that would increase to over $520m by 2038, a 32% increase.
14 ‘Retail’ for the rest of this assessment excludes hardware and automotive
Page | 16Figure 4.7: Catchment retail demand projections ($m)
Growth 2018-2038
2018 2028 2038
n % Avg. ann.
Ashburton District $ 140.4 $ 164.5 $ 195.9 $ 55.5 40% 1.7%
Timaru District $ 191.5 $ 216.8 $ 244.0 $ 52.5 27% 1.2%
Mackenzie District $ 33.4 $ 39.3 $ 44.8 $ 11.4 34% 1.5%
Waimate District $ 29.3 $ 32.9 $ 36.8 $ 7.5 26% 1.1%
Total these districts $ 394.6 $ 453.4 $ 521.6 $ 127.0 32% 1.4%
It is important to remember that not all of that spend is retained in the catchment, and is certainly not all
directed to Ashburton. The longer-term parts of the projections are not very relevant to this assessment,
because the key issue is the retail effects immediately after the proposed development opens (indicatively
2020). The key point then is how current Ashburton town centre sales might grow from their current (2018)
level by the time the proposed development opens, as that growth will mitigate impacts to a small extent.
That is taken account of in the impacts assessed in section 5.2.5.
Page | 175 Impact assessment
This section summarises the results of the impact assessment.
5.1 Impact types
There are two main types of potential effects of the proposed development relevant to this assessment:
• Direct impacts: These arise when a new store opens and causes a redistribution of retail
spending among existing stores, and a decrease in sales at some existing stores. Impacts
of this type are the effects of trade competition, and cannot be considered under the
RMA.
• Indirect impacts: These arise as the flow-on consequence of direct impacts, and are
relevant under the RMA. As consumer travel patterns change, patronage of the centres
that those stores are in could also change. A decrease in patronage could have adverse
impacts on centres’ amenity, vitality or vibrancy, making them less attractive places to
visit. Indirect impacts may not occur if centre patronage does not change, such as when
trips to a new development are additional to, and not a replacement for an existing
centre visit.
5.2 Direct retail impacts
5.2.1 Approach
By applying assumed market shares that the development will capture from each catchment to the total
demand from that catchment, we have, in section 2.4, estimated the sales potential of the proposed
development. Given an assumption that development will not stimulate more retail spending, those sales
must be diverted away from existing retail destinations, and the distribution of those diverted sales has
been estimated based on what we know about how LFR stores and small format stores currently operate
in Ashburton. As described in section 4.5 Ashburton functions as a retail focal point for the entire District,
and also attracts spend from neighbouring districts. That process yields an estimate of the amount of spend
that will be diverted from existing centres within each storetype.
The impacts presented describe the difference in centre sales in each of the three main retail zones
(Business A, B and C) with the proposed development operating in 2020, compared to if the proposed
development was not to open.
The same approach for assessing where spend will be diverted from to go to the proposed development is
applied for the LFR and the small format retail stores. That approach is to:
• Estimate total sales of each store.
• Assess the storetypes each store will compete against, as follows:
Page | 18• The smaller format stores are assumed to compete against stores in the Business
A zone, as the core location of small format stores in Ashburton. The assessment
avoids assuming the particular type of stores that might establish in the
development, and instead assesses total sales of those stores in aggregate
against Business A stores in aggregate.
• For the LFR store the assumed mix of sales was informed by the store’s product
mix, from visiting existing comparable FLR stores and reviewing product ranges
on store websites. A further assumption was then made as to the type of stores
each product segment will compete against. Each segment (e.g. homewares, or
clothing, etc.) can compete against Ashburton specialty stores, Ashburton
department stores, or non-Ashburton stores.
• The degree to which stores in each category will compete with the proposed
development is informed by considering the market positioning of those stores,
from the floorspace audit described in section 4.2. For example, the town’s four
department stores will compete to varying degrees with the LFR store, and that
variance (more with Farmers and The Warehouse, and less with Harvey Norman),
is accounted for in our assessment.
• Assume sales diverted from other stores will be diverted equally from all stores in
central Ashburton, pro rata to their current floorspace. This step allocates diverted
spend to zone (Business A, etc.).
• Sum the total sales diverted from storetypes each zone to a zone total.
• Compare diverted sales from each zone against total current sales in each zone. This is
the measure of direct (trade competition) impact on each zone.
5.2.2 Sales without development
This assessment assumes that the proposed development would open in 2020. The rest of the data in this
section is presented at that time, and is projected from the 2018 baseline. In 2020 the Ashburton town
centre (Business zones A, B and C) would produce $252m in sales, of which 50% would come from the
Business A zone ($126m), 30% from Business B ($75m) and 20% from Business C ($51m) (Figure 5.1). Note
that these shares (50:30:20) are coincidentally ‘round’ only. These figures will be dominated by sales from
the supermarkets ($121m) and department stores ($41m), which will together yield $161m in sales, or 64%
of total Ashburton Central sales.
Page | 19Figure 5.1: Centre sales without proposed development (in 2020, $m)
Business A Business B Business C Total CBD
Department stores $ 14.5 $ 26.1 $ - $ 40.6
Furniture $ - $ 2.1 $ 2.4 $ 4.5
Textiles $ 4.1 $ - $ - $ 4.1
Houseware $ 0.3 $ - $ - $ 0.3
Electrical $ 17.3 $ - $ - $ 17.3
Recreation $ 3.5 $ 3.9 $ 4.8 $ 12.2
Apparel $ 16.8 $ 0.5 $ - $ 17.3
Pharmaceuticals $ 8.4 $ - $ 2.0 $ 10.4
Other retail and hospitality $ 60.6 $ 42.1 $ 42.0 $ 144.7
Total $ 125.6 $ 74.7 $ 51.2 $ 251.5
Share by zone 50% 30% 20% 100%
5.2.3 Origin of sales
The proposed development would capture a proportion of sales from each of those zones, as well as some
that is not currently spent in Ashburton. As discussed above, the LFR store is projected to make $11.3m in
sales in year 1 (2020), with a further $5.0m from the SFR tenancies, a total of $16.3m for the proposed
development (per Figure 2.3).
Of that $16.3m, just over half ($9.5m, 58%) would be drawn away from the Business A zone, including all
of the $5.0m in sales from the SFR tenancies (Figure 5.2). A large proportion (28%, $4.6m) would be
diverted away from business in the Business B zone, the location of most of Ashburton’s department store
space. Only a very small amount would be diverted from the Business C zone, and $2.0m (13%) would be
sourced from other locations outside Ashburton.
That $2.0m includes spending by Ashburton residents that currently leaks from Ashburton, and spend by
non-Ashburton residents that does not flow into Ashburton. Currently some 24% of Ashburton retail stores’
sales are made to non-Ashburton residents, or some $61m of sales by central Ashburton businesses
(section 4.5). The $2.0m of leakage recapture assumed is consistent with how existing stores in Ashburton
draw sales from non-locals, and is relatively conservative, given the size of the LFR store and emerging
popularity of the brand around the country, which makes other stores in the brand attractive to broad
catchments.
Page | 20Figure 5.2: Origin of proposed development sales by zones (in 2020, $m, LFR and SFR stores)
Other Total all
Business A Business B Business C Total CBD
locations locations
Department stores $ 2.5 $ 4.5 $ - $ 7.0 $ - $ 7.0
Furniture $ - $ 0.0 $ 0.0 $ 0.0 $ 0.1 $ 0.1
Textiles $ 0.8 $ - $ - $ 0.8 $ 0.2 $ 1.0
Houseware $ 0.0 $ - $ - $ 0.0 $ 0.4 $ 0.4
Electrical $ 0.3 $ - $ - $ 0.3 $ 0.1 $ 0.4
Recreation $ 0.4 $ 0.1 $ 0.1 $ 0.6 $ 0.4 $ 1.0
Apparel $ 2.8 $ 0.1 $ - $ 2.8 $ 0.8 $ 3.7
Pharmaceuticals $ 0.3 $ - $ 0.0 $ 0.3 $ - $ 0.3
Other retail and hospitality $ 2.5 $ - $ - $ 2.5 $ - $ 2.5
Total $ 9.5 $ 4.6 $ 0.1 $ 14.3 $ 2.0 $ 16.3
Share by type 58% 28% 1% 87% 13% 100%
Having identified all retail stores in Ashburton, and assessed the likelihood of each store to compete with
the LFR store, our conclusion is that the LFR store will draw its sales relatively equally from Ashburton’s
existing department stores15 ($7.0m) and smaller specialty retailers ($7.3m) (Figure 5.3). The stores most
affected in the specialty (i.e. non-department) category will be apparel (clothing, shoes and accessories), a
segment in which the LFR store is particularly strong, and the “other retail and hospitality” group, which
will compete with the four SFR tenancies in the proposed development.
Figure 5.3: Origin of proposed development sales by store type (in 2020, $m, LFR and SFR stores)
Ashburton Ashburton
Other Total all
specialty department Total CBD
locations locations
stores stores
Department stores $ - $ - $ - $ - $ -
Furniture $ 0.0 $ 0.2 $ 0.2 $ 0.1 $ 0.3
Textiles $ 0.8 $ 0.8 $ 1.6 $ 0.2 $ 1.8
Houseware $ 0.0 $ 1.6 $ 1.7 $ 0.4 $ 2.1
Electrical $ 0.3 $ 0.3 $ 0.7 $ 0.1 $ 0.8
Recreation $ 0.6 $ 1.5 $ 2.1 $ 0.4 $ 2.5
Apparel $ 2.8 $ 2.0 $ 4.8 $ 0.8 $ 5.7
Pharmaceuticals $ 0.3 $ 0.4 $ 0.7 $ - $ 0.7
Other retail and hospitality $ 2.5 $ - $ 2.5 $ - $ 2.5
Total $ 7.3 $ 7.0 $ 14.3 $ 2.0 $ 16.3
Share by type 45% 43% 87% 13% 100%
5.2.4 Sales with development
Taking away the sales that the proposed development would draw from each zone then leaves a lower
amount of future sales for each zone, as shown in the tables below. Total retail and hospitality sales in
central Ashburton would drop from $251m to $237m as a result of the proposed development (Figure 5.4),
15 Four department stores (The Warehouse, Briscoes, Farmers, Harvey Norman), per discussion in section 0
Page | 21although taking into account also the sales of the proposed development ($16.3m) total sales would
actually increase slightly ($2.0m) as a result of a small amount of leakage recapture.
Figure 5.4: Central Ashburton retail sales with proposed development, including LFR store (in 2020, $m)
Business A Business B Business C Total CBD
Department stores $ 12.0 $ 21.6 $ - $ 33.6
Furniture $ - $ 2.1 $ 2.4 $ 4.5
Textiles $ 3.3 $ - $ - $ 3.3
Houseware $ 0.2 $ - $ - $ 0.2
Electrical $ 17.0 $ - $ - $ 17.0
Recreation $ 3.1 $ 3.8 $ 4.7 $ 11.6
Apparel $ 14.0 $ 0.4 $ - $ 14.5
Pharmaceuticals $ 8.1 $ - $ 2.0 $ 10.1
Other retail and hospitality $ 58.2 $ 42.1 $ 42.0 $ 142.2
Total $ 116.0 $ 70.1 $ 51.1 $ 237.2
LFR store proposed $ 11.3
SFR stores proposed $ 5.0
Total all locations $ 116.0 $ 70.1 $ 51.1 $ 253.5
The sales assessed in Figure 5.4 assume no specific reduction in leakage from Ashburton District, rather
assume that the proposed development would source sales from a similar geographic spread to existing
stores. That means that District retail leakage would change little (a reduction of around 0.5%) with the
development. In reality the development might result in a greater reduction in leakage, and therefore
either produce higher sales than assessed in section 2.4 or result in lower trade competition effects than
assessed below in section 5.2.5. For that reason, the following impacts assessment will tend to overstate
potential direct and indirect effects, and is conservative in that regard.
Figure 5.5: Proposed development effect on Ashburton District retail leakage
Ashburton
District District
Demand Central
Leakage Leakage
Sales
Pre-development $ 430.3 $ 251.5 $ 178.8 41.6%
Post-development $ 430.3 $ 253.5 $ 176.7 41.1%
Development impact $ - $ 2.0 -$ 2.0 -0.5%
5.2.5 Direct retail impacts
The ‘with development’ sales presented in section 5.2.4 can be compared against the base case ‘without
LFR development’ sales in section 5.2.2. The difference in sales is the direct (trade competition) impact due
to the development diverting sales away from each zone. The impact on each storetype is not overly
relevant, because impacts on individual storetypes represent a pure trade competition impact on one or a
small number of stores. That level of impact is not relevant in RMA terms. The more important
consideration is the total impact on sales in each centre, because it is that change which might influence a
Page | 22change in patronage of the centre, which is the indirect effects referred to in section 5.1 and which is the
relevant consideration in RMA terms.
Figure 5.6: Direct retail impacts on centre sales ($m, in 2020)
Business A Business B Business C Total CBD
2018 $ 119.9 $ 71.3 $ 48.9 $ 240.1
2020 Pre-development $ 125.6 $ 74.7 $ 51.2 $ 251.5
2020 Post-development $ 116.0 $ 70.1 $ 51.1 $ 237.2
Kmart impact (c.f. 2020 base) -$ 9.54 -$ 4.62 -$ 0.13 -$ 14.28
Kmart impact % -7.6% -6.2% -0.2% -5.7%
The total decrease in central Ashburton’s 2020 retail sales would amount to 6%, as a result of the
development opening. The greatest impact would be on sales of the Business A zone (-7.6%), followed by
the Business B zone (-6.2%) (Figure 5.6). The Business A impacts are likely to be the most critical in
determining the indirect impacts, because that zone is the fine-gained core of the town centre that is
identified as most important to the functioning of the town centre in the District Plan.
Viewed another way, the decrease in sales would reduce sales in the Business A and B zones to only just
below current (2018) sales, equating to an impact of only -3.2% in the former, and -1.7% in the latter,
relative to current sales levels, and within about another two years after opening (i.e. by 2022) Business A
and B sales would have returned to 2018 levels.
It is unlikely that many, if any, businesses would close as a result of new competition from the new
development, because of the breadth of offer in the LFR store’s range. The LFR store would be expected to
compete primarily with Ashburton’s department stores, which have a similarly broad range, and to a lesser
extent with Ashburton’s specialist stores. Trade competition impacts on specialist stores will be spread
across many businesses, most of which will have a point of differentiation to the LFR store, such as price
point, quality, service or range, and would be expected to be relatively resilient to the FLR store’s broad,
and general trading focus.
5.2.6 Interpretation of direct retail impacts
Those impacts are the direct retail impacts, and would be classified as trade competition impacts under the
RMA. In our opinion the impacts assessed on each centre would not reach a level of significance, as defined
in RMA case law because:
• Some of the loss in sales by existing stores will be mitigated by market growth between
now and the time the impacts occur (i.e. on opening in 2020). The increase in retail
demand from Ashburton households is projected to be 4.7% between 2018 and 2020,
given population growth and the ongoing increase in average household spend over
time.
• Ashburton will remain as the only significant retail destination in the District, with or
without the proposed development, and in fact the only significant retail presence
within at least 45 minutes’ drive (to Rolleston). It will continue to provide by the far the
Page | 23You can also read