2021 Half-Year Report - Sanoma
←
→
Page content transcription
If your browser does not render page correctly, please read the page content below
Half-Year Report

2021

Sanoma Corporation
P.O.Box 60, 00089 Sanoma, Finland
www.sanoma.com
ID 1524361-1
Half-Year Report 2021                                                                                                          2

SANOMA CORPORATION, HALF-YEAR REPORT JANUARY–JUNE 2021

Strong growth in net sales and
operational EBIT in both businesses
Q2 2021
 ◼    The Group’s net sales grew to EUR 303 million (2020: 246) driven by acquisitions and strong organic growth both in
      Learning and Media Finland. The Group’s comparable net sales growth of 10% (2020: -14%) was driven primarily
      by the recovering advertising sales.
 ◼    Operational EBIT excl. PPA grew to EUR 65 million (2020: 54). Earnings improved in Learning supported by the
      acquisition of Santillana and in Media Finland by net sales growth and synergies of the acquisition of the regional
      news media business.
 ◼    EBIT was EUR 52 million (2020: 43). Items affecting comparability (IACs) were EUR -3 million (2020: -6). Purchase
      price allocation adjustments and amortisations (PPAs) increased to EUR 11 million (2020: 6) as a result of the
      Santillana acquisition.
 ◼    Operational EPS was EUR 0.24 (2020: 0.21) and EUR 0.24 (2020: 0.22) including discontinued operations.
 ◼    EPS was EUR 0.22 (2020: 0.17) and EUR 0.22 (2020: 0.20) including discontinued operations.
 ◼    On 1 June, Sanoma announced it had increased its ownership in event organiser Nelonen Media Live Ltd. from
      60% to 100%.
 ◼    On 29 April, Sanoma announced it had received a decision from the Finnish Tax Adjustment Board that they had
      accepted a claim made by the Finnish Tax Ombudsman related to tax audits at Sanoma Media Finland in 2015-
      2018. Sanoma considers the claims completely unjustified and has appealed the decisions. On 1 July, Sanoma has
      paid the required VAT, the related penalty and interests of EUR 25 million and will book the amount paid as a
      receivable in Q3 2021.

H1 2021
 ◼    Net sales grew in both businesses both organically and through acquisitions, and the Group’s net sales amounted to
      EUR 513 million (2020: 434). The Group’s comparable net sales growth of 7% (2020: -8%) was driven by
      advertising sales rebounding from previous year’s coronavirus pandemic impact and 5% organic growth in Learning.
 ◼    Operational EBIT excl. PPA grew to EUR 55 million (2020: 46) driven by solid net sales growth in both Learning and
      Media Finland.
 ◼    EBIT was EUR 28 million (2020: 26). IACs totalled EUR -7 million (2020: -10). PPAs increased to EUR 20 million
      (2020: 11) as a result of the Santillana acquisition.
 ◼    Operational EPS decreased to EUR 0.11 (2020: 0.14) due to higher financial costs and taxes. Operational EPS
      including discontinued operations was EUR 0.12 (2020: 0.23).
 ◼    EPS was EUR 0.08 (2020: 0.10) and EUR 0.08 (2020: 0.18) including discontinued operations.
 ◼    Free cash flow improved to EUR -51 million (2020: -65) while being negative in-line with its typical seasonal pattern.
 ◼    Net debt/Adj. EBITDA was 3.1 (2020: 2.6) at its typical seasonal peak and increased due to the Santillana
      acquisition.

Outlook for 2021 (unchanged)
In 2021, Sanoma expects that the Group’s reported net sales will be EUR 1.2‒1.3 billion (2020: 1.1). The Group’s operational
EBIT margin excluding PPA is expected to be 14%–16% (2020: 14.7%).

Regarding the operating environment and its implications for the business and financials Sanoma expects that:

 ◼    Net sales of the events business will be approximately half of the 2019 level (2019: EUR 35 million) and profitability
      around break-even.
 ◼    The advertising demand will be weighted towards the second half of the year.
 ◼    The learning business will not be significantly impacted by prolonged school closures in its main operating countries.
Half-Year Report 2021 3 Alternative performance measures and discontinued operations Sanoma presents certain financial performance measures on a non-IFRS basis as alternative performance measures (APMs). The APMs exclude certain non-operational or non-cash valuation items affecting comparability (IACs) and are provided to reflect the underlying business performance and to enhance comparability between reporting periods. The APMs should not be considered as a substitute for performance measures in accordance with IFRS. Unless otherwise stated, all income statement related quarterly and FY figures presented in this report cover continuing operations only. Figures related to balance sheet and cash flow cover both continuing and discontinued operations. Media Netherlands is reported as discontinued operations until the completion of the divestment on 20 April 2020. In addition, certain Learning operations that are under strategic review are reported as discontinued operations for 2020 and 2021. Sanoma’s continuing operations include Learning and Media Finland, which are also Sanoma’s reporting segments. Definitions of key IFRS indicators and APMs are available on p. 37. Reconciliations are available on p. 18-19. More information on discontinued operations is available on p. 34-35.
Half-Year Report 2021                                                                                                                                   4

Key indicators for continuing operations

EUR million                                      Q2 2021        Q2 2020        Change        H1 2021        H1 2020        Change        FY 2020
Net sales                                            302.8         246.0           23%           512.9         433.6           18%        1,061.7

Operational EBITDA 1)                                103.7           87.2          19%           134.4         117.9           14%           309.9
             1)
   Margin                                           34.3%         35.4%                         26.2%          27.2%                        29.2%

Operational EBIT excl. PPA 2)                         65.0           54.0          20%            55.0           46.2          19%           156.5
             2)
   Margin                                           21.5%         22.0%                         10.7%          10.7%                        14.7%

EBIT                                                  51.5           42.8          20%            27.7           25.8            7%          270.1

Result for the period                                 37.0           29.5          25%            12.6           17.1         -26%           237.8

Operational EPS, EUR 1)                               0.24           0.21          15%            0.11           0.14         -20%               0.58

EPS, EUR                                              0.22           0.17          29%            0.08           0.10         -23%               1.46

Average number of employees
                                                                                                 4,887         4,150           18%           4,255
(FTE)
Number of employees at the end of
                                                                                                 5,059         4,457           14%           4,806
the period (FTE)

Key indicators incl. continuing and discontinued operations 3)

EUR million                                      Q2 2021        Q2 2020        Change        H1 2021        H1 2020        Change        FY 2020
Result for the period                                 36.9           33.5          10%            12.4           29.7         -58%           247.1

Free cash flow                                         -3.0          -4.9          38%           -51.4          -65.1          21%               94.8

Equity ratio 4)                                                                                 32.9%          34.4%                        37.4%

Net debt                                                                                         769.8         543.9           42%           660.7

Net debt / Adj. EBITDA                                                                              3.1           2.6          19%                2.6

Operational EPS, EUR 1)                               0.24           0.22            9%           0.12           0.23         -50%               0.67

EPS, EUR                                              0.22           0.20          13%            0.08           0.18         -57%               1.51

Free cash flow per share, EUR                        -0.02          -0.03          38%           -0.32          -0.40          21%               0.58
1) Excluding IACs
2) Excluding IACs and purchase price allocation adjustments and amortisations (PPAs)
3) In 2021, discontinued operations include certain Learning operations that are under strategic review. In 2020, discontinued operations also
included Sanoma Media Netherlands. More information on discontinued operations’ financial performance is available on p. 34.
4) Advances received included in the formula of equity ratio were EUR 171.8 million in H1 2021 (2020: 164.9)
Half-Year Report 2021 5 President and CEO Susan Duinhoven: ”Our first half of the year was strong in all aspects. Net sales grew and earnings improved as a result of both acquisitions and organic growth both in Learning and Media Finland. In Learning, we had 5% organic growth and this was in particular strong in countries where a curriculum renewal or a transformation to subscription model is ongoing, i.e. the Netherlands and Poland. We are also very satisfied with the performance of Santillana, which has met our expectations and the integration is proceeding steadily according to our plans. The team in Spain is well-prepared not only for the third quarter high season of this year, but even more importantly for the upcoming education renewal in 2022–2023. With the acquisition of Santillana, the annual seasonality has become even stronger in Learning, as the business in Spain is even more focused on the third quarter than in our other operating countries. Across our learning business, we have continued to support remote learning and teaching with our digital tools and do not expect any major impact on the business due to the pandemic. Media Finland continued its solid performance during the second quarter. Subscription sales continued to grow driven by the daily newspaper Helsingin Sanomat (HS) and the VOD service Ruutu+. At HS, the number of subscriptions grew by 3% year-on-year. B2B advertising sales bounced back substantially compared to the second quarter of 2020 which was strongly impacted by the coronavirus pandemic. The most relevant comparison being against 2019, H1 2021 advertising sales were 6% lower than H1 2019. Visibility into the B2B demand continues to be very short-term only, though we expect the overall demand to be more weighted on the second half of the year, if the coronavirus pandemic continues to subside. The regional news media business has been part of Sanoma for more than a year now. The teams and operations are well integrated and we can see the synergy benefits in earnings. Despite its quite small size, our events business has been a hot topic this year. During this summer season 2021, we will be organising eleven events between midsummer and the end of July, most of them with significant restrictions related to the number of attendees. During the second quarter, we took several steps to implement our recently launched Sustainability Strategy. In May, we committed to the UN Global Compact as a signatory and in June to the Science Based Target initiative to align and reinforce our climate target of net-zero emissions across the value chain by 2030. We also presented the full strategy to the investors and analysts in our virtual Sustainability Day in June. Presentations and recording of the event are available at www.sanoma.com/en/investors. Our leverage increased due to the Santillana acquisition and was at its typical seasonal peak slightly above the long-term target of ‘below 3.0’. With the seasonality of our business and financial performance, we will be returning to our target level again during the second half of the year. Overall we have come through the coronavirus pandemic in a good way both in Learning and especially in the Finnish media business, which has proven to be nicely resilient due to its already large share of consumer and subscription-based income. We have not changed our long-term financial targets and have progressed well in our strategic transformation during the past 18 months. I want to thank our teams in all the different businesses for their perseverance throughout the pandemic and their continued customer focus while working under challenging circumstances. We have a solid financial position and the ability to create a good cash flow, and our aim is to continue to grow our businesses organically, and especially our K12 learning business also through M&A.”
Half-Year Report 2021                                                                                                          6

Financial review Q2 2021
Net sales by SBU

EUR million                                                                        Q2 2021         Q2 2020         Change
Learning                                                                              149.0           115.2            29%

Media Finland                                                                         154.1           130.9            18%

Other operations                                                                        -0.4            -0.1         -299%

Group total                                                                           302.8           246.0            23%

The Group’s net sales grew to EUR 303 million (2020: 246). Net sales grew in Learning driven particularly by the acquisition
of Santillana. Net sales of Media Finland grew driven by recovery of advertising sales compared to a weak comparison
period of the previous year and continued solid subscription sales growth. In addition, net impact of the acquisition of the
regional news media business and the divestment of the online classified business Oikotie on quarterly net sales was
somewhat positive. The Group’s comparable net sales growth of 10% (2020: -14%) was driven primarily by the recovering
advertising sales.

Operational EBIT excl. PPA by SBU

EUR million                                                                        Q2 2021         Q2 2020         Change
Learning                                                                               48.9            39.2            25%

Media Finland                                                                          19.3            16.0            20%

Other operations                                                                        -3.1            -1.2         -154%

Group total                                                                            65.0            54.0            20%

Operational EBIT excl. PPA improved in both businesses and amounted to EUR 65 million (2020: 54). In Learning, earnings
improvement was supported in particular by the acquisition of Santillana Spain, while in Media Finland earnings grew mainly
driven by good net sales growth and synergies related to the acquisition of the regional news media business.

IACs, PPAs and reconciliation of operational EBIT

EUR million                                                                                        Q2 2021         Q2 2020
EBIT                                                                                                   51.5            42.8
Items affecting comparability (IACs)
Restructuring expenses                                                                                  -3.9            -5.5
Capital gains/losses                                                                                    1.3
IACs total                                                                                              -2.5            -5.5
Purchase price allocation adjustments and amortisations (PPAs)                                        -11.0             -5.7
Operational EBIT excl. PPA                                                                             65.0            54.0
A detailed reconciliation on SBU level is presented on p. 18.

EBIT was EUR 52 million (2020: 43). The IACs totalled EUR -3 million (2020: -6) and consisted largely of costs related to
strategic business development and integration of recent acquisitions. PPAs increased to EUR 11 million (2020: 6) mainly
due to the acquisition of Santillana.

Net financial items decreased to EUR -3 million (2020: -4). The improvement was due to a foreign currency translation loss
included in the comparison period and lower financial expenses of external loans during the quarter.

Result before taxes grew to EUR 49 million (2020: 39). Income taxes grew to EUR 12 million (2020: 10). Result for the
period was EUR 37 million (2020: 30) and EUR 37 million (2020: 34) including discontinued operations.

Operational earnings per share were EUR 0.24 (2020: 0.21) and EUR 0.24 (2020: 0.22) including discontinued operations.
Earnings per share were EUR 0.22 (2020: 0.17) and EUR 0.22 (2020: 0.20) including discontinued operations.
Half-Year Report 2021                                                                                                              7

Financial review H1 2021
Net sales by SBU

EUR million                                                                           H1 2021         H1 2020          Change
Learning                                                                                 217.2           173.1             25%

Media Finland                                                                            296.4           260.7             14%

Other operations                                                                           -0.7            -0.3          -138%

Group total                                                                              512.9           433.6             18%

The Group’s net sales increased to EUR 513 million (2020: 434) driven by good growth in both businesses. In Learning,
growth resulting from the acquisition of Santillana was supported by comparable net sales growth of 5%. Net sales of Media
Finland grew driven by the acquisition of the regional news media business, strong recovery of advertising sales and
continuing growth in subscription sales. Net sales were adversely impacted by the divestment of the online classified
business Oikotie in July 2020. The Group’s comparable net sales growth of 7% (2020: -8%) was driven by the advertising
sales recovery during the second quarter and 5% comparable growth in Learning.

Operational EBIT excl. PPA by SBU

EUR million                                                                           H1 2021         H1 2020          Change
Learning                                                                                  28.9            24.1             20%

Media Finland                                                                             30.5            25.6             19%

Other operations                                                                           -4.4            -3.4           -28%

Group total                                                                               55.0            46.2             19%

Operational EBIT excl. PPA improved to EUR 55 million (2020: 46). The improvement was mainly driven by solid net sales
growth in both businesses. Operating costs increased in-line with net sales particularly in Media Finland, but also in Learning,
as corona-related cost savings lowered the cost level in the comparison period.

IACs, PPAs and reconciliation of operational EBIT

EUR million                                                                                           H1 2021          H1 2020
EBIT                                                                                                       27.7            25.8
Items affecting comparability (IACs)
Restructuring expenses                                                                                     -8.2             -9.6
Impairments                                                                                                -0.6
Capital gains/losses                                                                                        1.3
IACs total                                                                                                 -7.5             -9.6
Purchase price allocation adjustments and amortisations (PPAs)                                            -19.8           -10.8
Operational EBIT excl. PPA                                                                                 55.0            46.2
A detailed reconciliation on SBU level is presented on p. 18.

EBIT was EUR 28 million (2020: 26). The IACs totalled EUR -8 million (2020: -10) and consisted largely of integration costs
related to recent acquisitions in Learning and of strategic business development costs. PPAs increased to EUR 20 million
(2020: 11) due to the acquisitions of Santillana and the regional news media business.

Net financial items increased to EUR -7 million (2020: -4). In the comparison period, net financial expenses included some
positive foreign currency translation impact and a one-time interest income, which explain most of the change. Average
interest rate of the Group’s external loans increased to 1.1% (2020: 0.7%) as a result of the 3-year EUR 200 million bond
issued in March.

Result before taxes was EUR 21 million (2020: 21). Income taxes grew to EUR 8 million (2020: 4) mainly as a result of a
one-time tax expense related to the liquidation of a former foreign subsidiary in Ukraine. Result for the period was
EUR 13 million (2020: 17) and EUR 12 million (2020: 30) including discontinued operations.
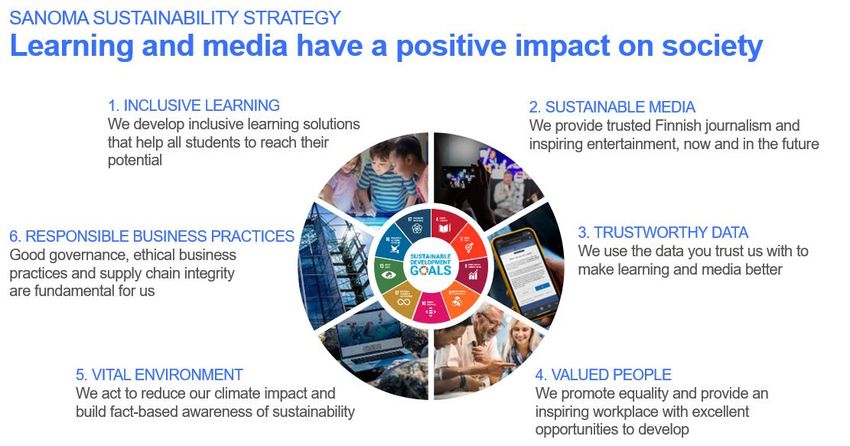
Half-Year Report 2021                                                                                                           8

Operational earnings per share were EUR 0.11 (2020: 0.14) and EUR 0.12 (2020: 0.23) including discontinued operations.
Earnings per share were EUR 0.08 (2020: 0.10) and EUR 0.08 (2020: 0.18) including discontinued operations.

Financial position
At the end of June 2021, interest-bearing net debt increased to EUR 770 million (2020: 544) and net debt to adjusted EBITDA
ratio to 3.1 (2020: 2.6) as a result of the acquisition of Santillana completed at the end of December 2020. Compared to the
end of March, the slight increase in net debt reflects the impact of the typical annual seasonal pattern of the business with
net sales, earnings and operating cash flow of the learning business focusing strongly on the third quarter, as well as the
first instalment of dividend paid in April. Equity ratio was 32.9% (2020: 34.4%).

At the end of June 2021, the Group’s equity totalled EUR 636 million (2020: 492) and the consolidated balance sheet totalled
EUR 2,105 million (2020: 1,596).

Cash flow
The Group’s free cash flow amounted to EUR -51 million (2020: -65) or EUR -0.32 per share (2020: -0.40). The divestment
of Media Netherlands had a positive impact on the Group’s free cash flow as in the comparison period, the seasonally
negative January-April free cash flow of Media Netherlands was included in the Group’s free cash flow. In addition, Media
Finland had a positive cash flow contribution mainly through improved EBITDA and working capital. Part of the overall
improvement was offset by the seasonally negative free cash flow of Learning, which was further impacted by the recently
acquired Santillana.

Capital expenditure included in the Group’s free cash flow amounted to EUR 20 million (2020: 21) and mainly consisted of
investments in digital platforms and ICT development in Learning.

Acquisitions and divestments
On 1 June, Sanoma announced that it had acquired remaining minority shares of its festival and events business, thus
increasing its ownership in the festival and events company Nelonen Media Live Ltd. from 60% to 100%. The seller was the
founder of N.C.D. Production Ltd. of which Sanoma acquired a majority stake in 2018.

Information on  acquisitions   and   divestments    conducted            in    2020     and    earlier   is   available    at
www.sanoma.com/en/investors/sanoma-as-an-investment/.

Events during the reporting period
On 8 June, Sanoma announced it will commit to the Science Based Targets initiative (SBTi) by setting emission reduction
targets aligned with the SBTi’s criteria. The commitment reinforces Sanoma’s climate target to reach net-zero emissions
across its value chain by 2030 as defined in its Sustainability Strategy.

On 27 May, Sanoma announced it will further strengthen its sustainability commitments by becoming a signatory of the
United Nation’s Global Compact. Sanoma’s Code of Conduct already encompasses the Ten Principles of the UN Global
Compact on human rights, labour, environment and anti-corruption and its recently updated Sustainability Strategy is aligned
to support nine out of seventeen UN Sustainable Development Goals.

On 29 April, Sanoma announced it had received a decision from the Finnish Tax Adjustment Board that they had accepted
a claim made by the Finnish Tax Ombudsman related to tax audits at Sanoma Media Finland Oy. The claim concerned the
treatment of value added tax (VAT) of certain magazines that were printed in multiple locations in Europe and distributed
through a centralised logistics centre in Norway in 2015-2018. Sanoma considers the claims completely unjustified and has
appealed the decisions. Thus, no provisions related to the matter have been made. On 1 July, Sanoma has paid the required
VAT, the related penalty and interests of EUR 25 million in order to avoid further interest accumulation. Sanoma considers
this payment to be a deposit with the tax authority while the dispute is ongoing and consequently will report the amount paid
as a receivable in Q3 2021. For dividend calculation purposes, the Group’s free cash flow will be adjusted for the payment.

On 11 March, Sanoma announced that it had issued a senior unsecured bond of EUR 200 million. The 3-year bond matures
on 18 March 2024. It carries a fixed annual interest of 0.625% and has an issue price of 99.625% and a yield of 0.752%.
The offering was allocated to approx. 65 investors. The net proceeds from the issuance of the bond were used to repay a
EUR 200 million bridge loan drawn in connection with the acquisition of Santillana.

On 8 March, Sanoma published its updated Sustainability Strategy to further strengthen sustainability in both the learning
and media businesses. The strategy focuses on six themes; Inclusive learning, Sustainable media, Trustworthy data, Valued
people, Vital environment and Responsible business practices; each having their own targets and KPIs. It is designed to
Half-Year Report 2021                                                                                                       9

maximise Sanoma’s positive impacts on society and to minimise its environmental footprint. Sanoma has integrated selected
UN Sustainable Development Goals (SDGs) into the strategy. In 2021, sustainability targets will make up 20% of Sanoma’s
annual short-term management incentives on target level. The targets are related to achieving certain data and privacy as
well as employee engagement targets.
Half-Year Report 2021                                                                                                                              10

Learning
Sanoma Learning is the leading European learning company, serving over 20 million students in 11 countries. Our learning
products and services enable teachers to develop the talents of every child to reach their potential. We offer printed and
digital learning materials as well as digital learning and teaching platforms for K12, i.e. primary, secondary and vocational
education, and we aim to grow our business throughout Europe. We develop our methodologies based on deep teacher
and student insight and truly understanding their individual needs. By combining our educational technologies and
pedagogical expertise, we create learning products and services with the highest learning impact.

Key indicators

 EUR million                                    Q2 2021       Q2 2020        Change        H1 2021       H1 2020       Change        FY 2020
 Net sales                                         149.0         115.2           29%          217.2         173.1           25%          499.7

 Operational EBITDA 1)                               66.0          56.2          18%           65.2           59.6           9%          167.1
                                  2)                 48.9
 Operational EBIT excl. PPA                                        39.2          25%           28.9           24.1          20%           95.9

     Margin 2)                                    32.8%          34.0%                       13.3%         13.9%                        19.2%

 EBIT                                                38.7          34.8          11%           10.0           14.8         -33%           66.4

 Capital expenditure                                  8.2           8.6           -5%          16.2           15.2           7%           32.6
 Average number of employees
                                                                                              2,592         1,918           35%          1,987
 (FTE)
1)Excluding IACs
2)Excluding IACs of EUR -0.9 million in Q2 2021 (2020: -0.3), EUR -2.4 million in H1 2021 (2020: -1.1) and EUR -13.2 million in FY 2020 and PPA
adjustments and amortisations of EUR 9.3 million in Q2 2021 (2020: 4.1), EUR 16.4 million in H1 2021 (2020: 8.1) and EUR 16.2 million in
FY 2020.
Full reconciliation of operational EBITDA and operational EBIT excl. PPA is presented in a separate table on p. 18.

Net sales by country

 EUR million                                    Q2 2021       Q2 2020        Change        H1 2021       H1 2020       Change        FY 2020
 The Netherlands                                     47.0          42.8          10%           81.1           75.1           8%          199.8

 Poland                                               6.4           5.5          18%           13.6           11.3          20%          112.5

 Spain                                               34.2           3.1         987%           41.6            6.3        563%            17.1

 Finland                                             31.6          31.3            1%          37.3           36.6           2%           52.9

 Belgium                                             17.0          20.9         -19%           22.8           25.6         -11%           76.1
                                       1)
 Other countries and eliminations                    12.9          11.6          11%           20.9           18.3          14%           41.2

 Net sales total                                   149.0         115.2           29%          217.2         173.1           25%          499.7
1) Other countries include Sweden, Norway, France, Germany, Denmark and the UK.

The learning business has, by its nature, an annual cycle with strong seasonality. Most net sales and earnings are accrued during the
second and third quarters, while the first and fourth quarters are typically smaller in net sales and loss-making. The acquisition of Santillana
will further increase the importance of the third quarter, when the new school year starts, for the business. Shifts of single orders between
quarters may have a material impact when comparing quarterly net sales and earnings on a year-on-year basis, and therefore year-to-date
figures typically provide a more comprehensive picture of Learning’s business performance and development than quarterly figures. Review
of H1 2021 is available on the next page.

Q2 2021
Net sales of Learning grew to EUR 149 million (2020: 115). Net sales of Santillana in Spain, acquired on 31 December 2020,
amounted to EUR 31 million. Net sales grew organically driven by higher pre-ordering particularly in the Netherlands and
Poland compared to the second quarter of 2020. This was partially offset by orders shifting from the second to the third
quarter in Belgium.

Operational EBIT excl. PPA improved to EUR 49 million (2020: 39) driven by the impact of the Santillana acquisition. The
positive earnings impact of organic net sales growth was more than offset by higher marketing and sales costs especially
compared to lower costs levels due to the coronavirus pandemic in Q2 2020.
Half-Year Report 2021 11 EBIT was EUR 39 million (2020: 35). IACs totalled EUR -1 million (2020: 0) and mainly consisted of costs related to acquisitions. PPAs increased to EUR 9 million (2020: 4) as a result of the acquisition of Santillana. Capital expenditure totalled EUR 8 million (2020: 9) and consisted of growth-investments in digital platforms and ICT. H1 2021 Net sales of Learning grew to EUR 217 million (2020: 173). Net sales of Santillana amounted to EUR 35 million. Solid comparable net sales growth of 5% was driven by higher pre-ordering in the Netherlands and Poland throughout the first half of the year. Operational EBIT excl. PPA grew to EUR 29 million (2020: 24). The majority of the earnings improvement resulted from the recently acquired Santillana business. The positive earnings impact of good organic net sales growth was partially offset by higher marketing and sales costs across the business, particularly compared to some corona-related cost savings in Q2 2020. EBIT decreased to EUR 10 million (2020: 15). IACs totalled EUR -2 million (2020: -1) and mainly consisted of integration costs related to the acquisition of Santillana. PPAs increased to EUR 16 million (2020: 8) as a result of the acquisition of Santillana. Capital expenditure totalled EUR 16 million (2020: 15) and consisted of growth-investments in digital platforms and ICT.
Half-Year Report 2021                                                                                                                             12

Media Finland
Media Finland is the leading media company in Finland, reaching 97% of all Finns weekly. We provide information,
experiences, inspiration and entertainment through multiple media platforms: newspapers, TV, radio, events, magazines,
online and mobile channels. We have leading brands and services, like Helsingin Sanomat, Ilta-Sanomat, Aamulehti, Me
Naiset, Aku Ankka, Nelonen, Ruutu, Supla and Radio Suomipop. For advertisers, we are a trusted partner with insight,
impact and reach.

Key indicators

 EUR million                                     Q2 2021       Q2 2020        Change        H1 2021        H1 2020        Change      FY 2020
 Net sales                                          154.1          130.9           18%          296.4         260.7            14%      562.6
                          1)
 Operational EBITDA                                   40.0          31.8           26%           72.2           60.9           19%      146.6

 Operational EBIT excl. PPA 2)                        19.3          16.0           20%           30.5           25.6           19%       66.6
               2)
     Margin                                        12.5%          12.3%                        10.3%           9.8%                    11.8%

 EBIT                                                 16.1            9.4          71%           23.5           14.6           61%      209.6

 Capital expenditure                                   1.0            1.3         -23%             2.6           3.4           -25%        5.1
 Average number of employees
                                                                                                2,082         2,001             4%      2,052
 (FTE)
1) Excluding  IACs
2)Excluding IACs of EUR -1.5 million in Q2 2021 (2020: -5.1), EUR -3.6 million in H1 2021 (2020: -8.3) and EUR 149.1 million in FY 2020 and PPA
adjustments and amortisations of EUR 1.7 million in Q2 2021 (2020: 1.6), EUR 3.4 million in H1 2021 (2020: 2.7) and EUR 6.1 million in FY 2020.
Full reconciliation of operational EBITDA and operational EBIT excl. PPA is presented in a separate table on p. 18.

Net sales by category

 EUR million                                       2 2021      Q2 2020        Change        H1 2021        H1 2020        Change      FY 2020
 Print                                                79.2          67.1           18%          156.5         131.6            19%      291.4

 Non-print                                            74.9          63.7           18%          139.9         129.1             8%      271.1

 Net sales total                                    154.1          130.9           18%          296.4         260.7            14%      562.6

 EUR million                                     Q2 2021       Q2 2020        Change        H1 2021        H1 2020        Change      FY 2020
 Advertising sales                                    65.4          51.5           27%          119.1         107.4            11%      231.6

 Subscription sales                                   60.4          54.3           11%          124.1         103.9            19%      230.0

 Single copy sales                                    10.7          10.5            2%           20.5           21.0           -2%       42.8

 Other                                                17.6          14.5           21%           32.7           28.4           15%       58.1

 Net sales total                                    154.1          130.9           18%          296.4         260.7            14%      562.6
Other sales mainly include festivals and events, marketing services, event marketing, custom publishing, books and printing.

Q2 2021
Net sales of Media Finland grew to EUR 154 million (2020: 131). Net sales of the regional news media business, acquired
on 30 April 2020, amounted to EUR 21 million compared to EUR 12 million included in the Q2 2020 financial reporting. On
a comparable basis (excl. the acquired regional news media business), subscription sales grew driven by strong
development both in the daily newspaper Helsingin Sanomat and the VOD service Ruutu+. Advertising sales development
was particularly volatile during the quarter. Comparable advertising sales grew by 33% year-on-year against a very weak
second quarter of 2020, when advertising demand was severely hit by the coronavirus pandemic. As a more relevant
comparison, the second quarter comparable advertising sales were 6% below 2019 levels and were still somewhat affected
by the coronavirus pandemic especially in the beginning of the quarter. The divestment of the online classifieds business
Oikotie had an adverse net sales impact of EUR 5 million.

According to the Finnish Advertising Trends survey for June 2021 by Kantar TNS, the advertising market in Finland grew by
43% on a net basis in Q2 2021. During the quarter, advertising grew by 43% in online (excluding search and social media),
Half-Year Report 2021 13 by 36% in newspapers, by 11% in magazines, by 43% in TV and by 47% in radio. In January-June 2021, the advertising market in Finland grew by 14%. During the first half of the year, advertising grew by 23% in online (excluding search and social media) by 8% in newspapers, by 18% in TV and by 19% in radio but declined by 3% in magazines. Operational EBIT excl. PPA improved to EUR 19 million (2020: 16) driven by good net sales growth and synergies related to the acquisition of the regional news media business. Overall operational expenses including TV programming costs increased in-line with recovering net sales offsetting part of the earnings improvement. In Q2 2020, profitability of the events business was positive due to insurance compensation received, while this year it was somewhat negative as only one festival, with restricted number of attendees, could be organised during the quarter. EBIT was EUR 16 million (2020: 9). IACs totalled EUR -2 million (2020: -5) and mainly consisted of costs related to strategic business development. PPAs were EUR 2 million (2020: 2). Capital expenditure totalled EUR 1 million (2020: 1) and consisted of maintenance investments.
Half-Year Report 2021                                                                                                           14

Personnel
In January–June 2021, the average number of employees in full-time equivalents (FTE) in continuing operations was 4,887
(2020: 4,150). The average number of employees (FTE) per SBU was as follows: Learning 2,592 (2020: 1,918), Media
Finland 2,082 (2020: 2,001) and Other operations 213 (2020: 231). At the end of June, the number of employees (FTE) of
the Group was 5,059 (2020: 4,457) and 8 (2020: 46) in discontinued operations. The number of employees increased as a
consequence of the acquisitions of Santillana in Spain and the regional news media business in Finland.

Employee benefit expenses amounted to EUR 178 million (2020: 145).

Share capital and shareholders
At the end of June 2021, Sanoma’s registered share capital was EUR 71 million (2020: 71), and the total number of shares
was 163,565,663 (2020: 163,565,663), including 318,614 (2020: 528,977) own shares. Own shares represented 0.2%
(2020: 0.3%) of all shares and votes. The number of outstanding shares excluding Sanoma’s own shares was 163,247,049
(2020: 163,036,686).

In March 2021, Sanoma delivered a total of 210,363 (2020: 324,163) own shares (without consideration and after taxes) as
part of its long-term share-based incentive plans.

Sanoma had 23,221 (2020: 23,043) registered shareholders at the end of June 2021.

Share trading and performance
At the end of June 2021, Sanoma’s market capitalisation was EUR 2,282 million (2020: 1,469) with Sanoma’s share closing
at EUR 13.98 (2020: 9.01). In January–June 2021, the volume-weighted average price of Sanoma’s share on Nasdaq
Helsinki Ltd. was EUR 14.68 (2020: 9.33), with a low of EUR 13.22 (2020: 6.84) and a high of EUR 17.12 (2020: 12.49).

In January–June 2021, the cumulative value of Sanoma’s share turnover on Nasdaq Helsinki Ltd. was EUR 142 million
(2020: 172). The trading volume of 10 million shares (2020: 18) equalled an average daily turnover of 78,000 shares
(2020: 150,000). The traded shares accounted for some 6% (2020: 11%) of the average number of shares. Sanoma’s share
turnover, including alternative trading venues BATS and Chi-X, was 10 million shares (2020: 21). Nasdaq Helsinki
represented 100% (2020: 88%) of the share turnover. (Source: Euroland)

Decisions of the Annual General Meeting
Sanoma Corporation’s Annual General Meeting (AGM) was held on 13 April 2021 in Helsinki. The AGM was held based on
the so-called temporary act so that the shareholders of the Company and their proxy representatives participated in the
meeting and exercised the shareholder’s rights only by voting in advance as well as by submitting counterproposals and
asking questions in advance.

The meeting adopted the Financial Statements, the Board of Directors’ Report and the Auditor’s Report for the year
2020, discharged the members of the Board of Directors as well as the President and CEO from liability for the financial
year 2020, and made an advisory decision on the adoption of the Remuneration Report of the governing bodies.

The AGM resolved that a dividend of EUR 0.52 per share shall be paid and a sum of EUR 700,000 shall be transferred to
the donation reserve and used at the Board of Directors’ discretion. The dividend shall be paid in two instalments. The first
instalment of EUR 0.26 per share shall be paid to a shareholder who is registered in the shareholders’ register of the
Company maintained by Euroclear Finland Ltd on the dividend record date 15 April 2021. The payment date for this
instalment is 22 April 2021.

The second instalment of EUR 0.26 per share shall be paid in November 2021. The second instalment shall be paid to a
shareholder who is registered in the shareholders’ register of the Company maintained by Euroclear Finland Ltd on the
dividend record date, which, together with the dividend payment date, shall be decided by the Board of Directors in its
meeting scheduled for 26 October 2021. The dividend record date would then be on or about 28 October 2021 and the
dividend payment date on or about 4 November 2021.

The AGM resolved that the number of the members of the Board of Directors shall be set at nine. Pekka Ala-Pietilä, Julian
Drinkall, Rolf Grisebach, Mika Ihamuotila, Nils Ittonen, Denise Koopmans, Sebastian Langenskiöld and Rafaela Seppälä
were re-elected as members, and Anna Herlin was elected as a new member of the Board of Directors. Pekka Ala-Pietilä
was elected as the Chairman of the Board and Nils Ittonen as the Vice Chairman. The term of all Board members ends at
the end of the AGM 2022.
Half-Year Report 2021                                                                                                               15

The AGM resolved that the monthly remuneration payable to the members of the Board of Directors remained
unchanged. The meeting fees of the Board of Directors also remained unchanged.

The AGM appointed audit firm PricewaterhouseCoopers Oy as the auditor of the Company, with Samuli Perälä, Authorised
Public Accountant, as the auditor with principal responsibility. The Auditor shall be reimbursed against invoice approved by
the Company.

The AGM authorised the Board of Directors to decide on the repurchase of a maximum of 16,000,000 of the Company’s
own shares (approx. 9.8% of all shares of the Company) in one or several instalments. The shares shall be repurchased
with funds from the Company's unrestricted shareholders’ equity, and the repurchases shall reduce funds available for
distribution of profits. The authorisation will be valid until 30 June 2022, and it terminates the corresponding authorisation
granted by the AGM 2020.

The AGM authorised the Board of Directors to decide on issuance of new shares and the conveyance of the Company's
own shares held by the Company (treasury shares) and the issuance of option rights and other special rights entitling to
shares as specified in Chapter 10, Section 1 of the Finnish Companies Act. Option rights and other special rights entitling
to shares as specified in Chapter 10, Section 1 of the Finnish Companies Act may not be granted as part of the Company’s
incentive programme. The Board will be entitled to decide on the issuance of a maximum of 16,000,000 new shares (approx.
9.8% of all shares of the Company) as well as conveyance of a maximum of 5,000,000 treasury shares held by the Company
in one or several instalments. The issuance of shares, the conveyance of treasury shares and the granting of option rights
and other special rights entitling to shares may be done in deviation from the shareholders’ pre-emptive right (directed issue).
The authorisation will be valid until 30 June 2022 and it will replace the corresponding authorisation granted by the AGM
2020.

Seasonal fluctuation
The learning business has, by its nature, an annual cycle with strong seasonality. Most net sales and earnings are accrued
during the second and third quarters, while the first and fourth quarters are typically loss-making. The recent acquisition of
Santillana will further increase the importance of the third quarter, when the new school year starts, for the business. Shifts
of single orders between quarters may have a material impact when comparing quarterly net sales and earnings on a year-
on-year basis, and thus year-to-date figures typically provide a more comprehensive picture of Learning’s business
performance and development.

In the media business, net sales and results are particularly affected by the development of advertising. Advertising sales
are influenced, for example, by the number of newspaper and magazine issues published each quarter, which varies
annually. TV advertising in Finland is usually strongest in the second and fourth quarters. The events business in Finland is
typically focused on the second and third quarters. In 2021, Sanoma organises 11 festivals between 24 June and 31 July,
most of them with restrictions related to the number attendees. Net sales of the events business is expected to be approx.
half of the 2019 level and profitability around break-even. In 2020, no events were arranged due to the restrictions related
to the pandemic, but earnings of the business were somewhat positive due to insurance compensation received.

Seasonal business fluctuations influence the Group’s net sales and EBIT. Due to the seasonality in the learning business,
the first and fourth quarters are traditionally the smallest ones in terms of net sales, and loss-making. With the acquisition of
Santillana, the learning business is even more focused on the third quarter, when the new school year starts.

Significant near-term risks and uncertainties
Sanoma is exposed to numerous risks and opportunities, which may arise from its own operations or the changing operating
environment in the short-term or long-term. Significant risks that could have a negative impact on Sanoma’s business,
performance, or financial status, and their likelihood and/or magnitude in the short-term, are described below. However, in
addition to risks mentioned below, other currently unknown or immaterial risks may arise or become material in the future.

The general economic conditions and trends in Sanoma’s operating countries could influence Sanoma’s near-term business,
performance or financial status. Currently, these conditions are particularly impacted by the ongoing coronavirus pandemic
that may pose a risk for the Group’s business and financial performance in 2021. In Media Finland, the coronavirus pandemic
has a material impact on the events business. Organising of live events continues to be impacted by restrictions; Sanoma
organises 11 festivals between 24 June and 31 July, most of them with restrictions related to the number attendees. In
addition, uncertainty and low visibility on advertising demand continues. In Q2 2021, Media Finland’s comparable advertising
sales grew by 33% after declining by 4% in Q1 2021, by 38% in Q2 2020 and by 9% in FY 2020. In 2021, Sanoma expects
the advertising demand to be weighted towards the second half of the year. In Learning, the prolonged school closures in
Sanoma’s main operating countries could impact net sales related to training and opportunities for market share gains in
connection to curriculum renewals. Currently, these impacts are not expected to be significant in 2021.
Half-Year Report 2021                                                                                                                 16

For its own part, the Group’s well-balanced business portfolio mitigates the impacts of the general economic conditions and
the coronavirus pandemic on the Group’s business to a certain extent: the majority of the Group’s operational earnings will
come from Learning in 2021. In addition, Sanoma takes active actions to mitigate the risks related to the pandemic and
continuously updates the risk situation and mitigation plans for employee safety and impact on the financial results. Cost
mitigation actions include careful and demand-dependent cost containment of all non-mandatory cost categories including
overall administration and travelling, marketing, offices and content creation. Certain costs related to e.g. IT and warehouse
handling may increase somewhat due to the pandemic. Throughout its operations, Sanoma follows the guidance and
measures recommended by authorities in its operating countries.

Sanoma’s strategic aim is to grow through acquisitions. The key near-term risks in M&A may relate to the availability and
valuation of the potential targets as well as the suitability of timing for the parties and the transaction process itself. M&A
risks may also relate to the unidentified liabilities of the target companies or their assets, changes in market conditions, the
inability to ensure the right valuation and effective integration of acquisitions or that the anticipated economies of scale or
synergies do not materialise.

In learning, digital and blended (= print-and-digital) learning materials, methods and platforms have gradually been gaining
ground, and the coronavirus pandemic has further amplified the growing need for remote learning tools and digital learning
materials. In the learning material distribution services, this shift is being paralleled by a move from renting and selling books
towards subscription-based commercial models. Both trends and/or their acceleration may have an impact on the near-term
operational performance, financial performance and/or financial position of Sanoma Learning.

With the continued development of alternative forms of media, particularly digital media, the Group’s media business and
the strength of its media brands depend on its continued ability to identify and respond to constantly shifting consumer
preferences and industry trends as well as its ability to develop new and appealing products and services in a timely manner.
Changes in customer preferences are visible not only in consumer behaviour, but also both directly and indirectly in
advertising demand, which is shifting from print to digital media.

The media and learning markets in which the Group operates are highly competitive and include many regional, national
and international companies. In media, competition may arise e.g. from large international media and telecom companies
entering new geographic markets or expanding the distribution of their products and services to new distribution channels.
In Learning there is a similar risk stemming from large international media companies (e.g. Google, Apple, Microsoft), digital
entrants, educational technology companies, open educational resources and user-generated content.

The Group’s operations are subject to various laws and regulations in the countries the Group operates in and changes in
such laws and regulations, or their interpretation, could have a material effect on Sanoma’s ability to conduct its business
effectively. For example, changes in educational regulation in its operating countries could have a material effect on
Sanoma’s commercial propositions, content investments needs or financial performance. Changes in taxation, as well as in
the interpretation of tax laws and practices applicable to Sanoma’s products and services or their distribution, e.g. the VAT,
may have an effect on the Group’s operations or its financial performance. The Finnish Tax Adjustment Board has accepted
a claim based on tax audits at Sanoma Media Finland in 2015-2018 about the treatment of VAT of certain magazines that
were printed in multiple locations in Europe and distributed through a centralised logistics centre in Norway. The same
logistics practices continue to be in use, while no tax audits have been conducted for years after 2018. More information is
available on p. 8 and 36.

Data is an increasingly essential part of Sanoma’s business, putting privacy and consumer trust at the core of the Group’s
daily operations. Regulatory changes regarding the use of consumer data for commercial purposes could, therefore, have
an adverse effect on Sanoma’s ability to utilise data in its business. The proposed ePrivacy Regulation related to telesales
and content personalisation may have an impact on B2C media sales and B2B advertising business. Changes in the digital
advertising ecosystem, such as the deprecation of third-party cookies, may result in changes in business models used in
digital advertising sales.

Sanoma’s financial risks include interest rate, currency, liquidity and credit risks. Other risks include risks related to equity
and impairment of assets. As part of the quarterly reporting, Sanoma has reviewed the potential impact of the coronavirus
pandemic on the expected credit losses and adjusted provisions related to Media Finland accordingly. At the end of June
2021, the Group has a solid financial position and a good ability to create a positive free cash flow.

Sanoma’s consolidated balance sheet included EUR 1,432 million (2020: 1,012) of goodwill, immaterial rights and other
intangible assets at the end of June 2021. After the acquisitions of Iddink and Santillana, most of this is related to the learning
business. In accordance with IFRS, instead of goodwill being amortised regularly, it is tested for impairment on an annual
basis, or whenever there is any indication of impairment. Changes in business fundamentals could lead to further
impairment, thus impacting Sanoma’s equity-related ratios. According to management assessment at the end of June 2021,
the coronavirus pandemic is not considered a triggering event for any further impairment testing. In Q2 2021, the festival
Half-Year Report 2021                                                                                                       17

and event business of Media Finland was subject to a more detailed impairment trigger analysis, which showed no need for
impairment testing.

More information on Sanoma’s most significant risks and uncertainty factors and the main principles of risk management is
available in the Report of the Board of Directors, Financial Statements and Corporate Governance Statement for 2020 on
www.sanoma.com.

Financial reporting in 2021
Sanoma will publish the following financial report during 2021:

Interim Report 1 January–30 September 2021                        Wednesday, 27 October, approx. at 8:30

Helsinki, 27 July 2021

Board of Directors
Sanoma Corporation
Half-Year Report 2021                                                                                                                                  18

Reconciliation of operational EBIT excl. PPA

EUR million                                                        Q2 2021           Q2 2020           H1 2021            H1 2020            FY 2020
EBIT                                                                    51.5              42.8              27.7               25.8            270.1

Items affecting comparability (IACs) and
PPA adjustments and amortisations
Learning
Impairments                                                                                                                                     -0.6
Restructuring expenses                                                   -0.9              -0.3              -2.4               -1.1           -12.7
PPA adjustments and amortisations                                        -9.3              -4.1            -16.4                -8.1           -16.2
Media Finland
Capital gains/losses                                                                                                                           164.8
Restructuring expenses                                                   -1.5              -5.1              -3.6               -8.3           -15.7
PPA adjustments and amortisations                                        -1.7              -1.6              -3.4               -2.7            -6.1
Other companies
Impairments                                                                                                  -0.6
Capital gains/losses                                                     1.3                                  1.3                                0.2
Restructuring expenses                                                   -1.5              -0.2              -2.2               -0.2            -0.2
Items affecting comparability (IACs) and
                                                                       -13.5             -11.2             -27.3               -20.4           113.6
PPA adjustments and amortisations total

Operational EBIT excl. PPA                                              65.0              54.0              55.0               46.2            156.5

Depreciation of buildings and structures                                 -6.4              -5.8            -12.7               -11.2           -23.8
Depreciation of rental books                                             -4.5              -4.0              -7.7               -7.9           -13.2
Amortisation of film and TV broadcasting rights                        -14.2               -9.2            -28.6               -22.8           -52.4
Amortisation of prepublication rights                                    -5.3              -4.4            -11.5               -10.0           -20.7
Other depreciations, amortisations and
impairments                                                              -8.3              -9.8            -19.5               -19.7           -43.8

Items affecting comparability in depreciation,
amortisation and impairments                                                                                  0.6                                0.6

Operational EBITDA                                                    103.7               87.2             134.4              117.9            309.9

Items affecting comparability (IACs) in
financial
income and expenses
Financial items                                                                                                                  0.6             0.6

Items affecting comparability (IACs) and
PPA adjustments and
amortisations in discontinued operations
Capital gains/losses ¹)                                                                                                                         -1.8
Impairments                                                                                 1.7                                 -1.4            -2.6
Restructuring expenses                                                   -0.6                                -0.6               -0.5            -0.6
PPA adjustments and amortisations                                                          -0.4                                 -1.4            -1.4
Total                                                                    -0.6               1.3              -0.6               -3.4            -6.4
¹) In 2020, capital gains/losses include capital loss of EUR 1.6 million related to costs to sell for the divestment of Media Netherlands.
Half-Year Report 2021 19
Reconciliation of operational EPS
EUR million Q2 2021 Q2 2020 H1 2021 H1 2020 FY 2020
Result for the period attributable to the
36.6 32.3 12.4 28.8 246.7
equity holders of the Parent Company
Items affecting comparability 3.2 3.8 8.1 11.0 -131.6
Tax effect of items affecting comparability -0.7 -0.5 -1.4 -2.0 -6.3
Non-controlling interests’ share of items
0.0 0.0 0.0
affecting comparability
Operational result for the period
attributable to the equity holders of the 39.0 35.7 19.0 37.8 108.8
Parent Company
Weighted average number of shares on the
163,247,049 163,036,686 163,178,478 163,046,561 163,041,596
market
Operational EPS 0.24 0.22 0.12 0.23 0.67
Reconciliation of net debt
EUR million 30 Jun 2021 30 Jun 2020 FY 2020
Non-current financial liabilities 515.6 171.8 317.7
Current financial liabilities 146.3 199.9 265.0
Non-current lease liabilities 150.7 171.8 163.2
Current lease liabilities 29.4 27.4 29.5
Cash and cash equivalents -72.3 -26.8 -114.6
Net debt 769.8 543.9 660.7
Net debt 30 June 2020 and 31 December 2020 includes financial assets and liabilities of certain Learning operations that are presented as part of
assets and liabilities held for sale in the balance sheet. More details are presented on p. 35.
Reconciliation of adjusted EBITDA
EUR million H1 2021 H1 2020 FY 2020
12-month rolling operational EBITDA 325.7 323.7 329.3
Impact of acquired and divested operations 31.1 -30.3 18.1
Impact of programming rights -62.0 -51.4 -52.7
Impact of prepublication rights -33.7 -24.2 -31.9
Impact of rental books -10.7 -8.1 -10.7
Adjusted EBITDA 250.4 209.8 252.1
Reconciliation of comparable net sales growth
EUR million Q2 2021 Q2 2020 H1 2021 H1 2020
Net sales 302.8 246.0 512.9 433.6
Impact of acquired and divested operations -36.8 -4.4 -59.9 -10.8
Comparable net sales 265.9 241.5 453.0 422.7Half-Year Report 2021 20 Income statement by quarter EUR million Q1 2021 Q2 2021 Q1 2020 Q2 2020 Q3 2020 Q4 2020 FY 2020 NET SALES 210.1 302.8 187.6 246.0 400.8 227.3 1,061.7 Other operating income 5.4 5.9 6.5 15.0 173.9 12.0 207.5 Materials and services -64.5 -79.5 -55.2 -65.7 -160.9 -74.7 -356.5 Employee benefit expenses -87.6 -90.0 -71.6 -73.6 -66.7 -83.0 -294.9 Other operating expenses -37.3 -38.2 -40.7 -40.2 -37.8 -53.3 -171.9 Share of results in joint ventures 0.2 0.1 0.1 0.1 0.2 0.1 0.5 Depreciation, amortisation and impairment losses -50.1 -49.6 -43.6 -38.8 -42.7 -51.1 -176.3 EBIT -23.8 51.5 -17.0 42.8 266.9 -22.7 270.1 Share of results in associated companies -0.1 0.0 -0.1 -0.1 0.0 -0.1 -0.4 Financial income 1.1 0.0 4.1 -0.3 1.5 1.7 6.9 Financial expenses -4.8 -2.9 -4.8 -3.3 -3.8 -3.8 -15.7 RESULT BEFORE TAXES -27.6 48.7 -17.7 39.1 264.6 -25.0 261.0 Income taxes 3.2 -11.6 5.3 -9.5 -20.4 1.4 -23.2 RESULT FOR THE PERIOD FROM CONTINUING OPERATIONS -24.4 37.0 -12.4 29.5 244.2 -23.5 237.8 DISCONTINUED OPERATIONS Result for the period from discontinued operations -0.1 -0.1 8.7 4.0 0.1 -3.4 9.3 RESULT FOR THE PERIOD -24.5 36.9 -3.8 33.5 244.3 -26.9 247.1 Result from continuing operations attributable to: Equity holders of the Parent Company -24.2 36.7 -12.1 28.4 243.7 -22.5 237.4 Non-controlling interests -0.3 0.3 -0.3 1.2 0.6 -1.1 0.4 Result from discontinued operations attributable to: Equity holders of the Parent Company -0.1 -0.1 8.6 4.0 0.1 -3.4 9.3 Non-controlling interests - - 0.1 0.0 - - 0.1 Result attributable to: Equity holders of the Parent Company -24.3 36.6 -3.6 32.3 243.7 -25.9 246.7 Non-controlling interests -0.3 0.3 -0.2 1.2 0.6 -1.1 0.5 Earnings per share for result attributable to the equity holders of the Parent Company: Earnings per share, EUR, continuing operations -0.15 0.22 -0.07 0.17 1.49 -0.14 1.46 Diluted earnings per share, EUR, continuing operations -0.15 0.22 -0.07 0.17 1.49 -0.14 1.45 Earnings per share, EUR, discontinued operations 0.00 0.00 0.05 0.02 0.00 -0.02 0.06 Diluted earnings per share, EUR, discontinued operations 0.00 0.00 0.05 0.02 0.00 -0.02 0.06 Earnings per share, EUR -0.15 0.22 -0.02 0.20 1.50 -0.16 1.51 Diluted earnings per share, EUR -0.15 0.22 -0.02 0.20 1.49 -0.16 1.51 In 2021, discontinued operations include certain Learning operations that are under strategic review. In 2020, discontinued operations included also Sanoma Media Netherlands.
Half-Year Report 2021                                                                                     21

Net sales by SBU

EUR million                         Q1 2021   Q2 2021   Q1 2020   Q2 2020   Q3 2020   Q4 2020   FY 2020
Learning                               68.2     149.0      57.9     115.2     259.9      66.6     499.7
Media Finland                         142.2     154.1     129.9     130.9     141.0     160.8     562.6
Other companies and eliminations       -0.2      -0.4      -0.2      -0.1      -0.1      -0.1      -0.5
Total                                 210.1     302.8     187.6     246.0     400.8     227.3   1,061.7

EBIT by SBU

EUR million                         Q1 2021   Q2 2021   Q1 2020   Q2 2020   Q3 2020   Q4 2020   FY 2020
Learning                              -28.7      38.7     -20.0      34.8      83.7     -32.2      66.4
Media Finland                           7.5      16.1       5.3       9.4     184.5      10.4     209.6
Other companies and eliminations       -2.6      -3.2      -2.3      -1.4      -1.3      -0.9      -5.8
Total                                 -23.8      51.5     -17.0      42.8     266.9     -22.7     270.1

Operational EBIT excl. PPA by SBU

EUR million                         Q1 2021   Q2 2021   Q1 2020   Q2 2020   Q3 2020   Q4 2020   FY 2020
Learning                              -20.0      48.9     -15.1      39.2      89.6     -17.8      95.9
Media Finland                          11.3      19.3       9.5      16.0      23.7      17.3      66.6
Other companies and eliminations       -1.3      -3.1      -2.2      -1.2      -1.5      -1.0      -5.9
Total                                 -10.0      65.0      -7.8      54.0     111.8      -1.5     156.5
Half-Year Report 2021                                                                                                          22

Interim report (unaudited)
Accounting policies
Sanoma Group prepares its Interim Report in accordance with IAS 34 'Interim Financial Reporting' while adhering to related
IFRS standards and interpretations applicable within the EU on 30 June 2021. The accounting policies of the Interim Report,
the definitions of key indicators as well as the explanations of use and definitions of Alternative Performance Measures
(APMs) are available at Sanoma.com. All figures have been rounded and consequently the sum of individual figures can
deviate from the presented sum figure. Key figures have been calculated using exact figures.

Sanoma uses a provision matrix to measure expected credit losses of trade receivables. Loss rates are defined separately
for different geographic regions, type of business and types of customers (B2B and B2C). Loss rates are based on past
information on actual credit loss experience, adjusted by current information and future expectations on economic conditions
where deemed necessary.

For the Learning SBU, management currently considers the impact of the corona virus pandemic to be very limited and not
material, mainly due to the fact that the majority of the customers are B2B customers funded by state, regional or municipal
governments.

With respect to Sanoma Media Finland’s B2B customer receivables there has not been any significant change in payment
delays. During the pandemic the financial crisis of 2008-2009 has been used as a reference point for estimating the impact
of the corona virus pandemic, and the subsequent financial downturn caused by it, on the future B2B credit losses of Sanoma
Media Finland. The credit losses have been adjusted to reflect the increased risk accordingly.
Half-Year Report 2021                                                                                                                                   23

Consolidated income statement

EUR million                                                     Q2 2021           Q2 2020           H1 2021           H1 2020           FY 2020
NET SALES                                                           302.8             246.0             512.9             433.6          1,061.7
Other operating income                                                 5.9             15.0              11.4              21.5             207.5
Materials and services                                               -79.5             -65.7           -143.9            -120.9            -356.5
Employee benefit expenses                                            -90.0             -73.6           -177.6            -145.2            -294.9
Other operating expenses                                             -38.2             -40.2            -75.5             -80.9            -171.9
Share of results in joint ventures                                     0.1               0.1               0.3               0.2                  0.5
Depreciation, amortisation and impairment
                                                                     -49.6             -38.8            -99.8             -82.5            -176.3
losses
EBIT                                                                  51.5             42.8              27.7              25.8             270.1
Share of results in associated companies                               0.0              -0.1               0.0              -0.2              -0.4
Financial income                                                       0.0              -0.3               1.1               3.8                  6.9
Financial expenses                                                    -2.9              -3.3              -7.7              -8.1            -15.7
RESULT BEFORE TAXES                                                   48.7             39.1              21.0              21.3             261.0
Income taxes                                                         -11.6              -9.5              -8.4              -4.2            -23.2
RESULT FOR THE PERIOD FROM
                                                                      37.0             29.5              12.6              17.1             237.8
CONTINUING OPERATIONS
DISCONTINUED OPERATIONS
Result for the period from discontinued
                                                                      -0.1               4.0              -0.2             12.6                   9.3
operations
RESULT FOR THE PERIOD                                                 36.9             33.5              12.4              29.7             247.1
Result from continuing operations
attributable to:
Equity holders of the Parent Company                                  36.7             28.4              12.6              16.2             237.4
Non-controlling interests                                              0.3               1.2               0.0               0.9                  0.4
Result from discontinued operations
attributable to:
Equity holders of the Parent Company                                  -0.1               4.0              -0.2             12.6                   9.3
Non-controlling interests                                                 -              0.0                  -              0.1                  0.1
Result attributable to:
Equity holders of the Parent Company                                  36.6             32.3              12.4              28.8             246.7
Non-controlling interests                                              0.3               1.2               0.0               0.9                  0.5
Earnings per share for result attributable
to the equity holders of the Parent
Company:
Earnings per share, EUR, continuing
                                                                      0.22             0.17              0.08              0.10              1.46
operations
Diluted earnings per share, EUR, continuing
                                                                      0.22             0.17              0.08              0.10              1.45
operations
Earnings per share, EUR, discontinued
                                                                      0.00             0.02              0.00              0.08              0.06
operations
Diluted earnings per share, EUR, discontinued
                                                                      0.00             0.02              0.00              0.08              0.06
operations
Earnings per share, EUR                                               0.22             0.20              0.08              0.18              1.51
Diluted earnings per share, EUR                                       0.22             0.20              0.08              0.18              1.51
In 2021, discontinued operations include certain Learning operations that are under strategic review. In 2020, discontinued operations included
also Sanoma Media Netherlands.
You can also read