Sustainable Energy in America 2020 - Business Council for ...

Page created by Martin Wagner
 
CONTINUE READING
Sustainable Energy in America 2020 - Business Council for ...
2020
Sustainable Energy
in America
FACTBOOK

                     No portion of this document may be reproduced, scanned into an electronic system, distributed,
                     publicly displayed or used as the basis of derivative works without attributing Bloomberg Finance L.P.
                     and the Business Council for Sustainable Energy. For more information on terms of use, please
                     contact sales.bnef@bloomberg.net. Copyright and Disclaimer notice on the last page applies
                     throughout. Developed in partnership with the Business Council for Sustainable Energy.
Sustainable Energy in America 2020 - Business Council for ...
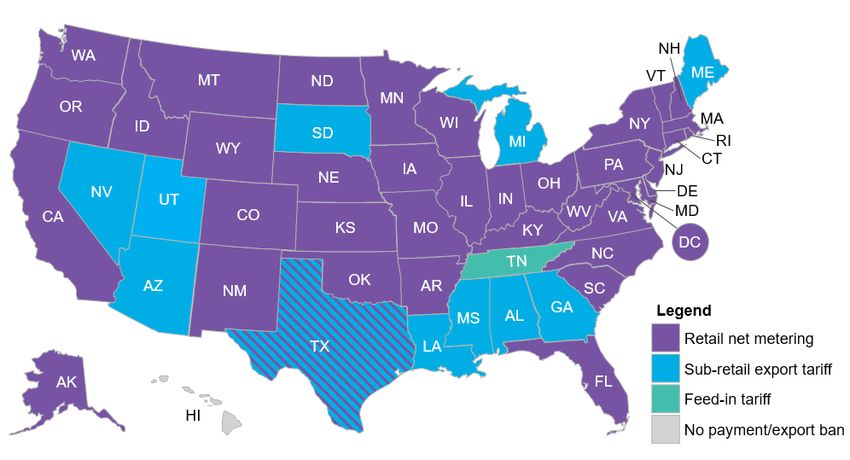
U.S. energy overview: Electricity
generation mix by U.S. power market

    Northwest                           MISO                                 PJM                                   New England                       New York
               WA                                                TWh                                  TWh                                  TWh                                TWh
                           TWh
                                                                  750                                  750                                  750                                750
                            750
                                               MT                                                                                                                          ME
                                                                   500      ND                          500                                  500                                500
                             500
                                                                                             MN         250                                  250                                250
            OR               250                                   250

                             0   ID                                0                                    0     WI                             0              NY                  0
                                      2010       2014       2018            SD
                                                                            2010      2014       2018           2010       2014       2018          2010      2014       2018
2010       2014       2018                          WY                                                                       MI
    California                          Southwest                            SPP                                 Ercot                               Southeast
                                                                                                                                                     PA
                                                                                                   IA
                           TWh                                   TWh          NE                      TWh                            OHTWh                                    TWh
                    NV      750       UT                          750                                  750                 IN                750                               750
                                                                                                                   IL
        CA                   500                         CO        500                                  500                                  WV
                                                                                                                                             500       VA                       500
                                                                                   KS                 MO
                                                                                                       250                        KY         250                                250
                             250                                   250
                             0                                     0                                    0                                    0     NC                           0
2010       2014       2018            2010       2014       2018           2010       2014       2018           2010       2014      2018           2010      2014       2018
                                   AZ                                                OK                 AR
                                                   NMOil                                                                           750
                                                                                                                                   500
                                                                                                                                   2
                                                                                                                                   050
                                                                                                                                      SC
                                                Coal                Nuclear         Natural gas                                  TWh
                                                                                                         Renewables (including hydro)
                                              2010                 2012               2014                 2016                GA
                                                                                                             MS        AL 2018
●     The energy generation mix varies throughout the U.S. TX with different power-generating
                                                                                    LA        technologies contributing various amounts in different
      power markets. The top-line volume of generation also varies, with higher demand in some regions. Energy can also be sold between
      regions, incentivizing areas with lower prices to generate more.
                                                                                                                      FL
●     Major trends over the last 10 years have included the rise of gas-fired generation in the PJM market which encompasses Midwestern and
      mid-Atlantic states and the growth of renewables, particularly wind and solar, in Ercot (Texas) and California.

Source: EIA, BloombergNEF Notes: MISO is the Midwest region; PJM is the Mid-Atlantic region; SPP is the Southwest Power Pool which covers the central southern U.S.; Ercot covers most of
Texas.

1       ©BloombergNEF L.P. 2020. Developed in partnership with the Business Council for Sustainable Energy.
Sustainable Energy in America 2020 - Business Council for ...
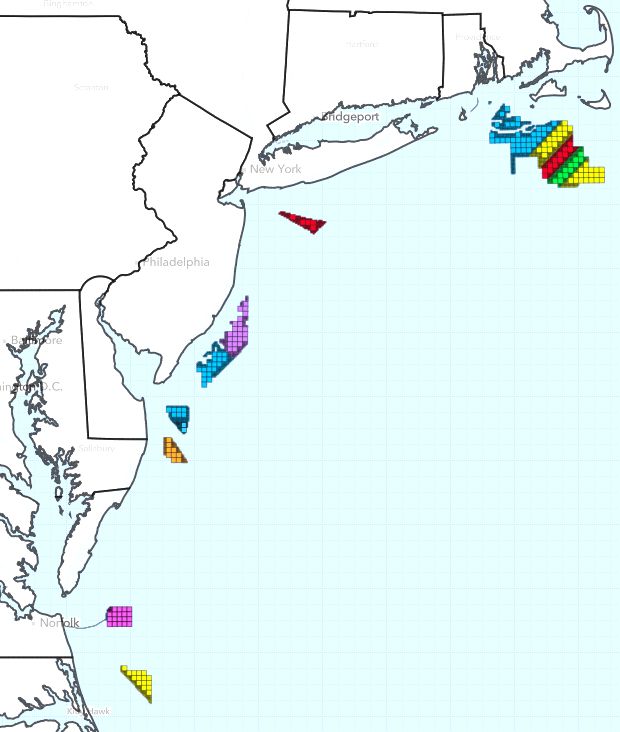
Policy: Infrastructure and resilience
U.S. billion-dollar weather and climate disasters (events)
                      18
                      16
                      14
                      12
                      10
                        8
                        6
                        4
                        2
                        0
                            2003            2005           2007            2009           2011            2013           2015            2017           2019
● Congress appropriated more than $20 billion in disaster funding in 2019, of which $3.3 billion was earmarked for the Army Corps of Engineers
    for flood and storm-damage restoration. The federal Department of Housing and Urban Development also made available about $7.6 billion to
    states and communities to reduce their vulnerability to future climate events. The 2019 fundings follow passage in October 2018 of the Disaster
    Recovery Reform Act, which set a new formula for pre-disaster mitigation funding.
● The FY 2020 NDAA enacted in 2019 increased the Energy Resilience and Conservation Investment Program (ERCIP) funding by $40 million
    for a total of $193 million. ERCIP is a subset of the defense-wide MILCON program that funds projects to increase resilience, save energy or
    water, produce energy or reduce the cost of energy for the Department of Defense. The NDAA codified the position of Assistant Secretary for
    Energy, Installations, and Environment for each military department, prioritizing the position and efforts in these areas.
● The McCain National Defense Authorization Act, signed on August 13, 2018, authorizes the Department of Defense to make grants to states
    and localities to address threats to the resilience of military bases. It defines resilience as the readiness of a military installation to react to
    extreme weather events.
Source: National Oceanic and Atmospheric Administration, National Defense Authorization Act, BloombergNEF. Note: Portrays annual counts of drought, flooding, freeze, severe storm, tropical
cyclone, wildfire and winter storm events in the U.S. with losses of more than $1 billion each.

2       ©BloombergNEF L.P. 2020. Developed in partnership with the Business Council for Sustainable Energy.
Sustainable Energy in America 2020 - Business Council for ...
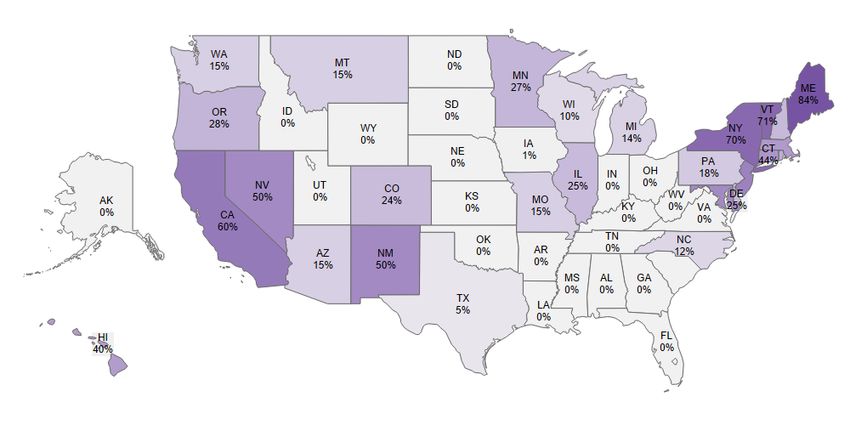
Policy: Sub-national actions to address
climate change
Population, GDP and emissions of states and cities with greenhouse gas targets, compared to U.S.
totals (2018)
                                         Population                                GDP                       GHG Emissions

                                          327 million                         $21.5 trillion                  6.5 gigatons
                          182 million                                                                                     51% $11.2 trillion
                                                                                                                     2.7 gigatons
                                                        65%                               68%

                                                              Share with targets
                                                                            62%      Share without targets
● U.S. jurisdictions encompassing more than 60% of the U.S. population have now committed to CO2 emissions reduction targets, with an eye
    toward having the U.S. meet the obligations pledged by the Obama administration under the Paris climate accord. Those state, local and
    municipal governments also account for approximately two-thirds of the national population and GDP and one-half of nationwide GHG
    emissions, according to Fulfilling America’s Pledge, a coalition of governments, businesses and other organizations funded by Bloomberg
    Philanthropies.
● Since the 2018 elections, eight states have joined the U.S. Climate Alliance: Pennsylvania, Wisconsin, Illinois, Michigan, Montana, New
    Mexico, Maine, and Nevada. That brings the total to 24 states participating in the group, which aims to cut CO2 emissions in line with Paris.
● Policy changes have come in a number of states where Democrats control both the state legislature and occupy the governor’s mansion. One
    exception came in Maryland where in early 2019, the Democratic-controlled Maryland state legislature raised the state’s renewables mandate.
    Governor Larry Hogan, a Republican, did not sign the bill, but did allow it to become law.
Source: America’s Pledge, BloombergNEF

3      ©BloombergNEF L.P. 2020. Developed in partnership with the Business Council for Sustainable Energy.
Sustainable Energy in America 2020 - Business Council for ...
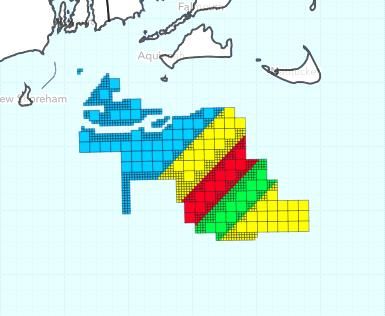
Policy: State clean energy mandates

2030 renewable electricity sales targets

                                                                                                                                            NH
                                                                                                                                           25%
                                                                                                                                            MA
                                                                                                                                           42%
                                                                                                                                            RI
                                                                                                                                           31%
                                                                                                                                            NJ
                                                                                                                                           55%
                                                                                                                                           MD
                                                                                                                  SC                       50%
                                                                                                                  0%

●     In 2019, nine states made significant revisions to their legislated clean energy goals. Major updates included New York State increasing its
      renewable portfolio standard to 70% by 2030 and Nevada boosting its to 50% by 2030. Washington State also set a 100% zero-carbon by
      2045 target.
●     Away from state policy, there has been a strong uptick in utility commitments over the last two years. In the Midwest, home to strong winds
      and in some areas conservative politics, major utilities Xcel and Mid American have set some of the most ambitious utility goals.

Source: BloombergNEF, Berkeley National Lab. Note: Targets are as of July 2019.

4       ©BloombergNEF L.P. 2020. Developed in partnership with the Business Council for Sustainable Energy.
Sustainable Energy in America 2020 - Business Council for ...
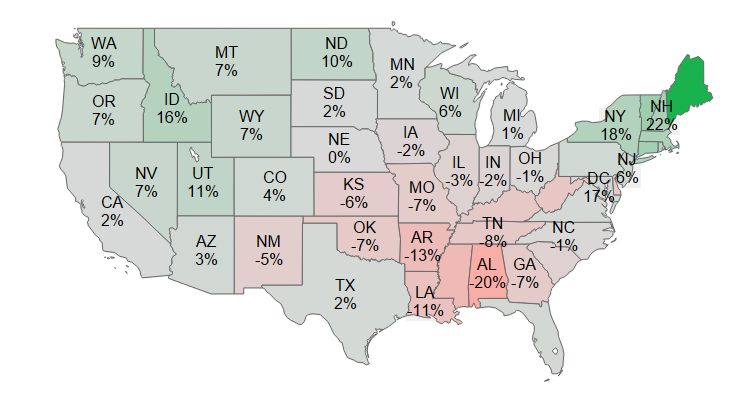
Policy: Vehicle fuel economy standards

EV share of light-duty vehicle sales, in California                                             States that have adopted California’s vehicle
and nationwide                                                                                  emissions standards
    8%
    7%
    6%
    5%
    4%
                                                        California
    3%
                                                        U.S.
    2%                                                                                      CA emissions
                                                                                                state
    1%
                                                                                            States moving
    0%                                                                                       to adopt CA
           2012 2013 2014 2015 2016 2017 2018 1H                                               standards
                                             2019

● The transportation sector is the largest source of greenhouse gas emissions in the U.S. Electric vehicle sales are growing but still represent a
    small share of the on-road fleet.
● The Trump administration proposed to freeze Corporate Average Fuel Economy (CAFE) standards for model years 2021-2025 at 2020 levels,
    which by its own estimates would increase both motor fuel consumption and greenhouse gas emissions. However, recent news reports
    suggest the administration’s final version of the rule may slow, but not freeze, these standards. California, 14 other states and the District of
    Columbia adhere to a more aggressive emissions-reduction schedule and have vowed to ignore the federal standards.
● California also has instituted a zero emissions vehicle (ZEV) program, which sets quotas on the sale of non-emitting cars. Most, but not all, of
    the states embracing California’s fuel economy standards have adopted its EV program.

Source: BloombergNEF Note: The 14 jurisdictions that follow the California GHG standard are Colorado, Connecticut, Delaware, District of Columbia, Maine, Maryland, Massachusetts, New
Jersey, New York, Oregon, Pennsylvania, Rhode Island, Vermont and Washington.

5        ©BloombergNEF L.P. 2020. Developed in partnership with the Business Council for Sustainable Energy.
Sustainable Energy in America 2020 - Business Council for ...
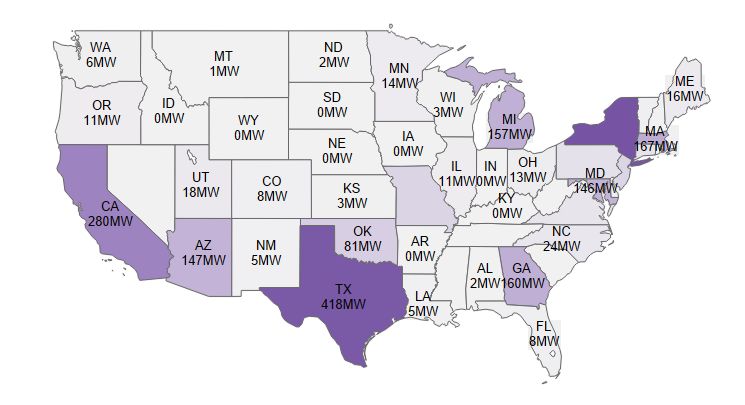
Deployment: Corporate procurement of
clean energy through green tariffs

                                                                                                 AL
                                                  Green tariff exists
                                                  Green tariff under
                                                  consideration
                                                  One-off deal between corporation and utility
● Through 2019, 18 regulated utilities in 18 U.S. states offer green tariff programs. These utilities will buy clean energy on behalf of a corporate
    buyer, manage the intermittency with their existing generation portfolios, and deliver it in firmed-up blocks to customers. After a record 2.6GW
    of clean energy purchased by corporations through green tariff programs in 2018, volume dropped to 2.4GW in 2019.
● Corporate buyers and utilities have been at odds across the U.S. over access to clean energy. Notable examples include the legal battles
    between Dominion Energy and its customers in Virginia, and Facebook’s quarrel with PNM Resources over transmission line payments in New
    Mexico. These incidents have fueled apprehension among buyers to use green tariffs.
● Google has purchased 783MW of clean energy through green tariff programs in 2019, leading all corporations. Facebook is second with
    700MW, leveraging programs in Utah, Georgia and Montana. Companies like Facebook, Google, General Motors and Walmart have leveraged
    green tariffs to date, but the programs remain a work in progress. While each program is different, many are prohibitive to all but the biggest
    energy buyers, and some have clauses that don’t allow for customers to save on electricity by switching to the programs.
Source: BloombergNEF, World Resources Institute

6      ©BloombergNEF L.P. 2020. Developed in partnership with the Business Council for Sustainable Energy.
Sustainable Energy in America 2020 - Business Council for ...
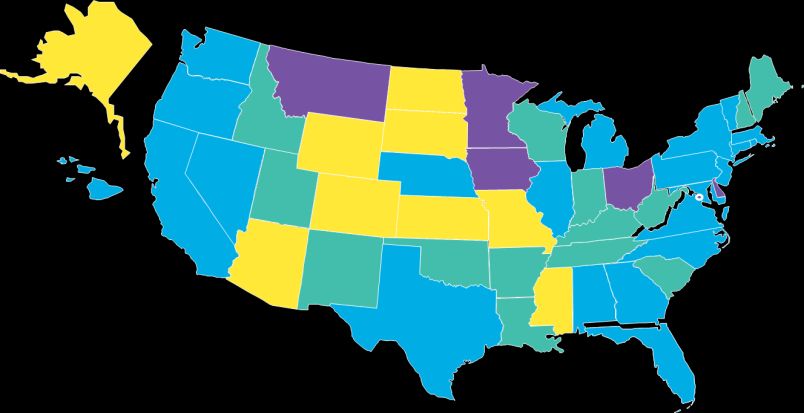
Deployment: National microgrid
penetration
Microgrid penetration by state                                                                                                  Microgrid capacity by
                                                                                                                                technology
                                                                                                                                   MW                                      Unknown
                                                                                                        VT NH
                                                                                                       8MW 1MW                    3,000
                                                                                                                                                                           Wind

                                                                                                           NY
                                                                                                                                  2,500
                                                                                                                                                                           Fuel Cell
                                                                                                         435MW
                                                                                                                                  2,000
                                                                                                                                                                           Hydro
                      NV
                     1MW                                               MO
                                                                                                                     CT           1,500
                                                                      66MW                                                                                                 Non-CHP
                                                                                                                    32MW                                                   Biogas
                                                                                     TN                          PA   RI          1,000
                                                                                    0MW                                                                                    Storage
                                                                                                                4MW 0MW
                                                                              MS                                 WV   NJ            500
                                                                                                                                                                           Solar
                                                                             0MW                                2MW 63MW
                                                                                                                 VA   DE                0
                                                                                                                                                                           Diesel

                                                                                                                                                                Planned
                                                                                                                                                  Operational
                                                                                                               29MW 9MW
                               HI                                                                                                                                          Generators
                                                                                       AL                        SC
                             107MW                                                                                                                                         Non-CHP
                                                                                      2MW                       0MW
                                                                                                                                                                           Natural Gas
                                                                                                                                                                           CHP

● There are currently 2.7GW of operational and 1.4GW of planned microgrids in the U.S. spread across 242 and 138 sites, respectively.
● Of these, 976MW of operational and 230MW of planned microgrid capacity come from combined heat and power (CHP) systems, representing
    around 30% of all operational and planned capacity. There are currently 25 CHP sites paired with solar generating capacity, 12 with diesel
    generators and 12 with batteries. Other technologies have six or fewer sites paired with CHP.
● The city/municipal sector has the largest number of CHP systems with a combined 78 operational and planned sites. The military and
    commercial sectors have the second and third largest with 63 and 61 sites. The military and commercial sectors have 44 and 41 sites currently
    in operation. With only 29 current sites, the city/municipal sector has the largest “planned” pipeline.
Source: ICF Microgrid Database, BloombergNEF Note: Microgrid is defined as a group of interconnected loads and distributed energy resources (DERs) that can disconnect and re-connect to
the utility grid as a single entity, allowing facilities to remain operational during utility outages.

7       ©BloombergNEF L.P. 2020. Developed in partnership with the Business Council for Sustainable Energy.
Sustainable Energy in America 2020 - Business Council for ...
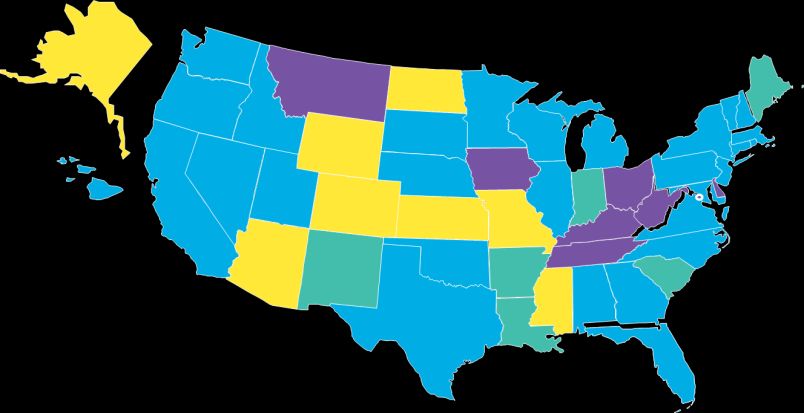
Deployment: Industrial gas demand by
region
      U.S. Natural Gas Industrial Consumption (Tcf)
     9
                                                                                                                                                                             East
     8
     7
                                                                                                                                                                             Midwest
     6
     5
                                                                                                                                                                             South
     4                                                                                                                                                                       Central
     3
                                                                                                                                                                             Mountain
     2
     1                                                                                                                                                                       Pacific
     0
        2001 2002 2003 2004 2005 2006 2007 2008 2009 2010 2011 2012 2013 2014 2015 2016 2017 2018 2019

● In the past decade, overall U.S. gas industrial consumption has jumped 32%, spurred by lower prices. The majority of industrial consumption
    continues to come from facilities in the South Central region, where natural gas is readily available.
● Industrial sector gas consumption totaled 8.1Tcf in 2019, of which 3.7Tcf was consumed in the South Central, 1.8Tcf in the Midwest, 0.5Tcf in
    the Mountain region, 0.9Tcf in the Pacific and 1.3Tcf in the East.
● Industrial gas consumption actually slipped 1.8% in 2019 from the year prior. Consumption decreased in most regions, but by varying amounts:
    the East was down 10%; the Mountain region by 3%; the Pacific by 0.9%; and the Midwest by 0.4%. South Central demand actually increased,
    by 0.7%.
● There has been a long-term gradual slide in gas consumption from the Pacific region. Demand peaked there in 2014 at 0.92Tcf and has
    declined nearly every year since.

Source: BloombergNEF, EIA; Note: Values for 2019 are projected, accounting for seasonality, based on latest monthly values from EIA (data available through October 2019). 2017 industrial
consumption numbers were used as proxies for missing monthly values for a number of states.

8       ©BloombergNEF L.P. 2020. Developed in partnership with the Business Council for Sustainable Energy.
Sustainable Energy in America 2020 - Business Council for ...
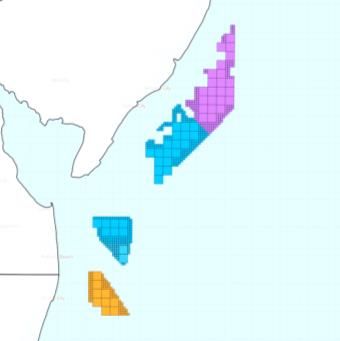
Deployment: Heating demand for
natural gas
Percent change in households using natural gas for heating,                                             Primary heating source by
2008-2018                                                                                               household
                                                                                                          Millions
                                                                                                         120
                                                                                         VT
                                                                                            ME
                                                                                        28%              100
                                                                                            99%
                                                                                                                                         47.7
                                                                                               MA            80       38.5
                                                                                              20%
                                                                             PA
                                                                                               CT
                                                                             4%                              60
                                                                          WV                   6%
                                                                       KY                      RI
                                                                          -9%                                40
                                                                      -5%                      7%
                                                                                           MD DE                      62.7               63.9
                                                                                           1% 17%            20
                                                             MS             SC
                                                                           -4%             VA
                                                            -14%                           2%
                                                                                                              0
                                                                          FL                                          2008              2018
                                                                          0%
                                                                                                              Other   Wood     Oil   Electric      Gas

● Natural gas is the largest heating source in the residential sector, with 63.9 million homes heated by utility natural gas or propane. That is
    equivalent to 52% of U.S. households. The second largest heating source, electricity, accounts for 39% of households.
● In absolute terms nationwide, the total number of households using natural gas for heating has risen by 2% since 2008.
● However, changes have varied substantially by region. On a percentage basis, usage grew swiftly in the New England states as the share of
    consumers burning more costly home heating oil dropped by double digits in many states. However, gas usage declined in other regions of the
    country, where electric heating gained popularity.
Source: BloombergNEF, US Census Bureau

9      ©BloombergNEF L.P. 2020. Developed in partnership with the Business Council for Sustainable Energy.
Offshore wind: Delayed but with high
potential
Location and owners of U.S. offshore wind                                                             ●   The U.S. offshore wind sector spent 2019 poised for rapid
                                                                                                          growth but ended the year somewhat in limbo as the country’s
leases issued by BOEM                                                                                     first potential large-scale project awaited a federal permit.
                                                                   KEY                                ●   The Bureau of Ocean Energy Management (BOEM) is charged
                                                                 STATE, OWNER(S)/Primary Developers       with issuing leases for commercial-scale projects three or more
                                                                 Contracted Project Names
NY, Equinor                                                                                               miles from shore. To date, BOEM has issued 14 leases for sites
Empire Wind
                                                                                                          off Massachusetts, Delaware, Maryland, New Jersey, New York,
                                                                   MA, CT, CIP & Avangrid                 North Carolina and Virginia. The agency is expected to identify
                                                                   Vineyard Wind, Park City Wind
                                                                                                          more lease areas off the coast of New York state in 2020.
                                         RI/MA/CT, Ørsted
                                                                                                      ●   Northeastern states have between them approved measures
                                         Revolution Wind, South Fork                                      targeting 25.4GW offshore by 2035.
                                   MA, Ørsted & Eversource
                                                                                                      ●   Vineyard Wind, which stands to become the first large-scale
                                   Sunrise Wind                                                           project in U.S. waters experienced permitting delays in late
                                                                                                          2019. The 804MW project, a joint venture between Avangrid and
               VA, Dominion Power                                                                         Copenhagen Infrastructure Partners, was originally scheduled
               Costal Virginia Offshore Wind (research)
                                                                                                          for commissioning in 2021. Now, BOEM plans to make a
               VA, Dominion Power                                                                         decision on its final construction permits in early Spring 2020. If
               Costal Virginia Offshore Wind
                                                                                                          delayed much further, the project could lose qualification for the
                     NC, Avangrid (Iberdrola)             RI/MA/CT Equinor                                federal Investment Tax Credit (ITC), which allowed it to submit a
                                                          MA, EDP & Shell                                 winning bid in Massachusetts’ first offshore auction.
                                                          Mayflow er Wind
                                                                                                      ●   In December 2019, Congress extended the ITC for wind by one
                                                      NJ, EDF + Shell                                     year at 60% of the credit's original value. This could provide
                                                                                                          some relief for Vineyard Wind and allow an extra cushion for
                                                      NJ, Ørsted
                                                      Ocean Wind                                          other developers targeting commissioning before 2025.
                                                      DE, Ørsted
                                                      Skipjack

                                                      MD, US Wind (Renexia)
                                                      MarWind

Source: BloombergNEF, Bloomberg, CARTO, Mapbox, OpenStreetMap, BOEM. Notes: This map was created using MAPS  on the Bloomberg Terminal. The shape file of U.S. offshore
wind zones can be found on BOEMs website (link).

10        ©BloombergNEF L.P. 2020. Developed in partnership with the Business Council for Sustainable Energy.
Economics: U.S. wind PPA prices
compared to wholesale power prices
 $/MWh (nominal)
  100

      80

      60
                                                                                                                                                              Power price range
      40                                                                                                                                                      Solar PPA range
                                                                                                                                                              Wind PPA range
      20

       0
              Solar   Wind      Solar     Wind      Solar     Wind       Solar     Wind      Solar     Wind      Solar     Wind      Solar      Wind
                 ERCOT            Southwest            California         Southeast               PJM                 MISO              New York

● Prices for wind power purchase agreements (PPAs) have fallen dramatically as levelized costs declined. According to interviews with project
     developers, projects secured offtake agreements in the mid-teens in the middle U.S. in 2018 (the last year for which complete data is
     available). For comparison, data reported to the Federal Energy Regulatory Commission indicate that offtake prices for contracts signed in
     2011 averaged $47/MWh.
● The top regions for utility PPAs are high wind-speed regions with low development costs like SPP, MISO and ERCOT. Conversely, developing
     projects in New England can be costly and time consuming, and average project capacity factors are typically among the lowest in the country.
● A significant number of wind projects commissioned in 2016 – representing 1.6GW of capacity – secured corporate PPAs. The popularity of
     corporate PPAs has only grown in recent years and a record volume of such contracts was once again signed in 2019.
Source: BloombergNEF, SEC filings, interviews, analyst estimates Notes: MISO is the Midwest region; PJM is the Mid-Atlantic region; SPP is the Southwest Power Pool which covers the
central southern U.S.; NEPOOL is the New England region; ERCOT covers most of Texas. Wholesale power prices are based on market-traded futures for calendar year 2018 for select nodes
within the region.

11         ©BloombergNEF L.P. 2020. Developed in partnership with the Business Council for Sustainable Energy.
Economics: U.S. environmental
markets
Class I REC prices in select U.S. markets                                                                U.S. carbon allowance auction prices
   $/MWh                                                                                                  $/t
   75                                                                                                     20
                                                                                                          18
                                                                                                                   California
                                                                                                          16
   50                                                                                                     14
                                                                                                          12
                                                                                                          10
   25                                                                                                      8
                                                                                                           6        RGGI
                                                                                                           4
                                                                                                           2
     0
      2010 2011 2012 2013 2014 2015 2016 2017 2018 2019                                                    0
                                                                                                                 1Q 18 2Q 18 3Q 18 4Q 18 1Q 19 2Q 19 3Q 19 4Q 19
        MA Class I REC               CT Class I REC
        PJM Tier 1 Tri-Qualified REC TX Class I REC                                                                         Secondary market price                           Auction price

● In states with Renewable Portfolio Standards (RPS), eligible renewable generators receive Renewable Energy Credits (RECs) for each
     megawatt-hour of electricity they supply to the grid. REC prices typically rise when policy-makers raise overall goals for clean energy
     generation, increasing demand for credits. The U.S. also has two carbon cap-and-trade markets. In participating states, emission allowances
     are won by bidding entities in auctions held each quarter. Those allowances can then be traded in the secondary markets between auctions.
● From 2018 into 2019, major RPS markets have been bolstered as clean energy targets have risen. At the end of 2019, Connecticut Governor
     Ned Lamont mandated a 100% carbon-free grid by 2040 for his state. This raised demand for CT and MA Class I RECs and their prices rose.
● Carbon markets have seen little movement as they remain oversupplied. The auction and trade prices tend to follow the floor prices
     determined by auction organizers. In California, the carbon price is making the economics of the state’s coal-fired power plants less tenable.
Source: BloombergNEF, Bloomberg Terminal, CARB, RGGI NOTE: RGGI is the Regional Greenhouse Gas Initiative. RGGI auction is in short tons and CCA auction is in metric tons

12       ©BloombergNEF L.P. 2020. Developed in partnership with the Business Council for Sustainable Energy.
Policy: Net metering state policies as of
December 2019

● As of December 2019, net metering at the full retail rate was available to most customers within 38 states and Washington, D.C.
● Compensation for generation fed back into the grid remained under discussion in 2019. Utilities proposed increases to the fixed charges in
     some states, and community solar saw increased interest.
● Louisiana adopted a successor to net metering at an avoided-cost rate for all projects coming online from 2020 onward. The avoided cost is
     applicable to virtual net metered projects that sign up for community solar as well.
● South Carolina’s reform process eliminated the cap on the number of net metered customers the state’s utilities could allow. In Minnesota,
     Xcel’s requested changes to the Value of Solar methodology will compensate community solar at a higher value in 2020.

Source: BloombergNEF, DSIRE. Note: the map displays the mechanism offered to the majority of residential customers where the incentives vary within a state.

13      ©BloombergNEF L.P. 2020. Developed in partnership with the Business Council for Sustainable Energy.
Deployment: U.S. non-hydropower
commissioned energy storage capacity
Commissioned capacity                                                                           Installations by state (top 10 states in 2019)
     Annual (MW)                                                 Cumulative (MW)                    MW
                                                                                                          California                                                   388
     500                                                                        2000
                                                                        414                                   Illinois                     139
     400                                                                        1600                           Texas                       136
                                                                296                                           Hawaii                  87
     300                                                                        1200
                                                                                                          New York                68
                                          204 213 190
     200                                                                        800                  West Virginia                67
                    96                                                                               Pennsylvania                 62
     100     84             75                                                  400
                                   52                                                                        Arizona             58
       0                                                                        0                               Ohio             55
        2011       2013         2015        2017      2019e                      New Jersey         48
● Annual energy storage installations have increased significantly since 2014. Build ramped in 2015 from projects seeking to participate in the
  PJM frequency regulation market and these assets represent most of the capacity in Illinois, West Virginia, Ohio and Pennsylvania. Between
  2018-2019, the amount of commissioned capacity grew by 20%.
● California became the largest market in the U.S., surpassing PJM in 2019. Build surged in the state starting in 2016 and early 2017 in
     response to emergency gas supply shortages expected from the Aliso Canyon gas storage facility leak-mitigation efforts. The state continues
     to lead installations as projects come on line to meet the state’s 1.8GW target by 2024.
● In 2019, markets continued to expand beyond PJM and California. New York, New Jersey and Texas each added more than 20MW of capacity
     from larger-scale (10MW+) projects, while Massachusetts added a variety of 3-5MW projects primarily reducing transmission charges from
     peak demand shaving.
● Falling lithium-ion battery pack prices have helped to lower costs for new stationary storage applications. Between 2018-2019, pack prices
     dropped by 13% and over the last decade, by 87%.
● Ice storage systems have also proven to be cost-effective for commercial and industrial applications under certain rates in some markets. Over
     80 ice storage projects, totaling 99MWh, have been implemented in North Carolina.
Source: BloombergNEF, NC State University Notes: *2019 includes expected but unconfirmed capacity as of January 15, 2020. Unconfirmed capacity is marked in white. Does not include
underground compressed air energy storage or flooded lead-acid batteries. Minimum project size included is 500kW or 500kWh. Cumulative capacity subtracts decommissioned capacity.

14      ©BloombergNEF L.P. 2020. Developed in partnership with the Business Council for Sustainable Energy.
Deployment: U.S. announced and
commissioned energy storage projects
                             OR: energy                 CO: Xcel approved               MN: passed law
                                storage                    for 275MW/                    which requires
                                 target                 1,100MWh storage                    utilities to
                             equivalent to                paired to solar               consider storage
                                                                                                                         PJM: 280MW+
                               1% peak                                                    in long-term                                                                      MA: 1,000MWh
                 42                                                                                                      operational for
                 AK               load                                                      planning                                                                          aspirational
                                                     22                                                               frequency regulation
                                                     WA                                                                                                                     energy storage
                                                                                                                                                        26 5         26      target + clean
                           NV:                                              161
                                                                                                                                                        VT NH        ME
                        proposes                 43
                                                                            MT                ND                                                                            peak standard
                       1GW target                OR                                                        17                                                                  approved
                                                              26
                                                                                             0.2           MN         50                                    568
                        by 2030                               ID                                                                                                        665 MA
                                                                             1.0             SD                       WI         5                          NY
         447                                                                 WY                                                  MI                                   4 RI
                                                                                                                                                   150              27 CT
          HI                                          695                                       2             1.3
                                                                                                                                       135         PA
                   CA: 1.325GW                        NV           10                          NE             IA                33                                 58 NJ
                                                                                                                       182             OH                          3 DE        NY: utilities
                                                                   UT           339                                             IN           67
 HI: HECO          storage target           6,389                                                                       IL                             16         13 MD
                                             CA                                 CO                 0.1                                       WV                              issued 350MW
                    by 2020,with                                                                               14                       3              VA
  launched                                                                                         KS                                                               DC      storage RFP. NY
                    an additional                                                                              MO                      KY
   900MW                                                                                                                                               27
                                                               724                                                                                                          PSC toughens
                   500MW led by                                                                     212                       0.6 TN                   NC
 renewable                                                     AZ            152                    OK
                                                                                                                48                                9                        regulation for old
 energy and            utilities                                                                                AR                               SC
                                                                             NM                                                                                              peaker plants
                                                                                                                        1.0     322          1
   storage                                    AZ: APS halts                                                                                 GA
                                                                                  698                                   MS      AL
procurement                                     new project                                                     0.3
                                                                                  TX                            LA
                                                                                                                                                                            MD: established
                  12,678 MW                    development                                                                                                                   energy storage
                      US                                                                                                                         515
                                                   as it            TX: Texas                                                                                                pilot program,
                                                                                                                                                 FL
                                               investigates approves legislation             FL: FPL announces                                                              utilities to solicit
                                                  fire at      to allow co-op and         409MW/900MWh project                                                              projects, totaling
             < 5MW
             5-55MW                            2MW/2MWh municipal utilities to                  co-sited to solar                                                                   up to
             > 55MW                           storage facility    own storage             expected on-line in 2021                                                           10MW/15MWh
             No storage
         AL AZ CA Note:
Source: BloombergNEF  CT Includes
                          DE GAprojects
                                  ID larger
                                        IN KS
                                            than LA  MD MI MS
                                                 500kW/500kWh       MTannounced
                                                              that have NV NJ specific
                                                                                NY ND      OK and
                                                                                       locations PA been
                                                                                                     SC confirmed
                                                                                                          TN UTbyVA   WVcompanies
                                                                                                                  relevant WY     through public data. Indiana
NIPSCO capacity not included in state capacity because individual project capacity is not yet disclosed. Capacity excludes thermal storage.

15      ©BloombergNEF L.P. 2020. Developed in partnership with the Business Council for Sustainable Energy.
Policy: U.S. states with EERS and
decoupling for electricity and natural gas
Electricity                                                                                  Natural gas

  Number of states                                                                              Number of states
  40                                                                                            40
     35                                                                                          35
     30                                                                                          30
                                                                     Decoupling                                                                                    Decoupling
     25                                                              only                        25                                                                only
     20                                                              EERS only                   20                                                                EERS only
     15                                                                                          15
                                                                     EERS &                                                                                        EERS &
     10                                                              decoupling                  10                                                                decoupling
      5                                                                                            5
      0                                                                                            0
          1991 1995 1999 2003 2007 2011 2015 2019                                                      1991 1995 1999 2003 2007 2011 2015 2019

● Energy efficiency resource standards (EERS) are state-level policies that require utilities to invest in measures that improve end-user efficiency
     to meet energy-savings goals set by the government. Decoupling is a regulatory framework in which utilities’ revenues are based on the
     reliable provision of energy, not volume sold. Decoupling addresses the disincentive for utilities to invest in efficiency. Utilities are most likely to
     invest in energy efficiency in states with both EERS and decoupling. Currently, 39 states have electricity policies and 35 have natural gas
     policies.
● More states than ever participate in EERS or decoupling incentives. Three new states have adopted EERS: Washington, Arizona and
     Wisconsin. New Mexico added electric decoupling incentives in 2019, and New Jersey added a gas decoupling incentive.

Source: ACEEE, BloombergNEF Notes: Decoupling includes all lost revenue adjustment mechanisms, but no longer includes pending policies per a methodology change in ACEEE reporting.

16        ©BloombergNEF L.P. 2020. Developed in partnership with the Business Council for Sustainable Energy.
Policy: ACEEE state-by-state scorecard
for energy efficiency policies, 2018
                                                                                                                        ● Massachusetts maintained first
                                                                                                                          place for the ninth year in a row.
                                                                                                                          According to the state’s 10-year
                                                                                                                          progress report, state energy
                                                                                                                          efficiency policies have
                                                                                                                          contributed to a 3.4% reduction
                                                                                                                          in GHGs from 1990 levels.
                                                                                                                        ● Maryland added 4.5 points to its
                                                                                                                          score, leaping from 10th to 7th
                                                                                                                          place. Utilities in the state
                                                                                                                          ramped up efficiency programs,
                                                                                                                          spurred by strong energy
                                                                                                                          reduction goals established by
                                                                                                                          its energy commission to reach
                                                                                                                          2% annual savings. Efforts have
                                                                                                                          saved more than 8 million MWh,
                                                                                                                          with expected savings of
                                                                                                                          approximately $9 billion over the
                                                                                                                          life of installed measures.
                                                                                                                        ● Kentucky lost 4.5 points,
                                                                                                                          dropping nine positions to 38th
                                                                                                                          place, the largest rankings fall in
                                                                                                                          2019. Kentucky’s point loss is
                                                                                                                          due to the state public service
                                                                                                                          commission’s decision last year
                                                                                                                          to discontinue almost all of
                                                                                                                          Kentucky Power’s demand-side
                                                                                                                          management programs.
Source: ACEEE, EIA, BloombergNEF Note: Numbers in parentheses at the top denote the change in score from 2016 levels.

17     ©BloombergNEF L.P. 2020. Developed in partnership with the Business Council for Sustainable Energy.
Policy: State adoption of building
energy codes
Residential buildings, as a percentage of U.S. population                                                                 ● The majority of states have adopted some
                                                                                                                             version of the International Energy
                                                                                                                             Conservation Code (IECC) for both residential
                                                                                                NSEC                         and commercial buildings.
                                                                                                 8%
                                                                                       2009 or                            ● The more populous states have adopted the
                                                                                        earlier                              2015 and 2018 IECC. Even for states that
                                                                                         16%
                                                                                                                             are labeled as having “no state energy code,”
                                                                                      2012                                   many jurisdictions within these states have
                                                                                       7%                                    adopted a recent version of the IECC.
                                                                                                            2015 /
                                                                                                             2018
                                                                                                                          ● Over time, codes are updated and become
                                                                                                             69%
                                                                                                                             more stringent. States that have adopted the
                                                                                                                             most recent (2018) standard have stronger
                                                                                                                             minimum requirements in place.
Commercial buildings, as a percentage of U.S. population
                                                                                                                          ● Adoption of the two most recent versions of
                                                                                                                             the IECC (i.e., 2015 and 2018) has increased
                                                                                                 NSEC                        from 46% of the U.S. population in January
                                                                                                  8%
                                                                                         2009 or                             2018 to 69% and 74% in January 2020 for
                                                                                          earlier                            commercial and residential buildings,
                                                                                      2012 8%                                respectively.
                                                                                       10%
                                                                                                                          ● 16% of the U.S. population still lives in an
                                                                                                                             area where the residential energy code would
                                                                                                           2015 /
                                                                                                            2018             be considered outdated (i.e., 2009 or earlier).
                                                                                                            74%

Source: U.S. Department of Energy, U.S. Census Bureau, BloombergNEF. Note: Current building energy codes use 30% less energy compared to typical codes that were in place less than 10
years ago.

18      ©BloombergNEF L.P. 2020. Developed in partnership with the Business Council for Sustainable Energy.
Policy: U.S. building floor space
covered under state or local energy use
benchmarking/disclosure policies
 Floor space covered by benchmarking or                                                                 Reno (NV)                           ● To boost transparency of building
                                                                                   Percent covered
 disclosure requirements (billions sq ft)                                                               San Jose (CA)
                                                                                                                                                energy usage, states and cities
                                                                                                        Fort Collins (CO)
12                                                                                                  14% Los Angeles (CA)                        have created building energy use
                                                                                                        Evanston (IL)
                                                                                                                                                policies such as energy efficiency
                                                                                                        Orlando (FL)                            benchmarks and mandates. The
                                                                                  Los Angeles       12%                                         square footage of commercial
10                                                                                                      Pittsburgh (PA)
                                                                                                        Kansas City (MO)                        building space covered by such
                                                                                                    10% Boulder (CO)
                                                                                                                                                policies jumped from 9% in 2017
 8                                                                                                      Portland (OR)                           to 13% in 2019, covering around
                                                                                                        Atlanta (GA)                            11 billion square feet.
                                                                                                    8%  Berkeley (CA)
                                                                                                                                            ● California’s existing law required
                                                                                                        Cambridge (MA)
 6                                                        Chicago                                                                               utilities to begin disclosing whole-
                                                                                                        Montgomery Co (MD)
                                                                                                    6%  Chicago (IL)                            building aggregated energy use
                                                                                                        Denver (CO)                             data to owners of commercial
 4                                                                                                      Boston (MA)                             buildings and multifamily homes at
                                                                                                    4%  Minneapolis (MN)                        the start of 2017. On the county
                                                     New York City                                      Philadelphia (PA)                       level, San Jose passed new
 2                                                                                                      San Francisco (CA)                      benchmarking laws that came into
                                                                                                    2%  Seattle (WA)                            effect for multifamily, non-
                                                                                                        New York City (NY)                      residential and public/government
                                      Washington DC
                                                                                                        Washington State                        buildings in May 2019.
 0                                                                                                  0%
                                                                                                        Austin (TX)
      Jul 07

      Jul 08

      Jul 09

      Jul 10

      Jul 11

      Jul 12

      Jul 13

      Jul 14

      Jul 15

      Jul 16

      Jul 17

      Jul 18

      Jul 19
     Jan 07

     Jan 08

     Jan 09

     Jan 10

     Jan 11

     Jan 12

     Jan 13

     Jan 14

     Jan 15

     Jan 16

     Jan 17

     Jan 18

     Jan 19

                                                                                                        Washington (DC)                     ● Similar laws for Reno, Nevada
                                                                                                        California                              also came into effect mid-2019.
                                                                                                        Percent covered

Source: Institute for Market Transformation (IMT), U.S. DOE’s Buildings Energy Data Book, BloombergNEF Notes: Accounts for overlap between cities and states (e.g., no double-counting
between Seattle and Washington state). Assumes that the Buildings Energy Data Book’s definition of floor space covered at least roughly corresponds to IMT’s definition. Shaded areas show
amount of floor space covered, diamonds represent percentage of U.S. commercial sector floor space covered.

19      ©BloombergNEF L.P. 2020. Developed in partnership with the Business Council for Sustainable Energy.
Copyright and disclaimer

The Bloomberg NEF ("BloombergNEF"), service/information is derived from selected public sources. Bloomberg Finance L.P. and its affiliates, in
providing the service/information, believe that the information it uses comes from reliable sources, but do not guarantee the accuracy or
completeness of this information, which is subject to change without notice, and nothing in this document shall be construed as such a guarantee.
The statements in this service/document reflect the current judgment of the authors of the relevant articles or features, and do not necessarily
reflect the opinion of Bloomberg Finance L.P., Bloomberg L.P. or any of their affiliates (“Bloomberg”). Bloomberg disclaims any liability arising
from use of this document, its contents and/or this service. Nothing herein shall constitute or be construed as an offering of financial instruments
or as investment advice or recommendations by Bloomberg of an investment or other strategy (e.g., whether or not to “buy”, “sell”, or “hold” an
investment). The information available through this service is not based on consideration of a subscriber’s individual circumstances and should
not be considered as information sufficient upon which to base an investment decision. You should determine on your own whether you agree
with the content. This service should not be construed as tax or accounting advice or as a service designed to facilitate any subscriber’s
compliance with its tax, accounting or other legal obligations. Employees involved in this service may hold positions in the companies mentioned
in the services/information.

The data included in these materials are for illustrative purposes only. The BLOOMBERG TERMINAL service and Bloomberg data products (the
“Services”) are owned and distributed by Bloomberg Finance L.P. (“BFLP”) except that Bloomberg L.P. and its subsidiaries (“BLP”) distribute
these products in Argentina, Australia and certain jurisdictions in the Pacific islands, Bermuda, China, India, Japan, Korea and New Zealand. BLP
provides BFLP with global marketing and operational support. Certain features, functions, products and services are available only to
sophisticated investors and only where permitted. BFLP, BLP and their affiliates do not guarantee the accuracy of prices or other information in
the Services. Nothing in the Services shall constitute or be construed as an offering of financial instruments by BFLP, BLP or their affiliates, or as
investment advice or recommendations by BFLP, BLP or their affiliates of an investment strategy or whether or not to “buy”, “sell” or “hold” an
investment. Information available via the Services should not be considered as information sufficient upon which to base an investment decision.
The following are trademarks and service marks of BFLP, a Delaware limited partnership, or its subsidiaries: BLOOMBERG, BLOOMBERG
ANYWHERE, BLOOMBERG MARKETS, BLOOMBERG NEWS, BLOOMBERG PROFESSIONAL, BLOOMBERG TERMINAL and
BLOOMBERG.COM. Absence of any trademark or service mark from this list does not waive Bloomberg's intellectual property rights in that that
name, mark or logo. All rights reserved. © 2020 Bloomberg.

20    ©BloombergNEF L.P. 2020. Developed in partnership with the Business Council for Sustainable Energy.
You can also read