STRATEGIC ENERGY MANAGEMENT PLAN REPORT - 2018/2019 Abbotsford, Canada Education Park, Aerospace, & Chilliwack North Campuses. University of the ...
←
→
Page content transcription
If your browser does not render page correctly, please read the page content below
STRATEGIC ENERGY
MANAGEMENT PLAN REPORT
2018/2019

Abbotsford, Canada Education Park, Aerospace, &
Chilliwack North Campuses.

University of the Fraser Valley
33844 King Road,
Abbotsford, BC, V2S 7M8

October 2019

 SUSTAINABLE ENERGY MANAGEMENT PLAN REPORT        14
Contents
Acknowledgement ................................................................................................................................................................. 2
Letter of Commitment to Energy Efficiency .......................................................................................................................... 3
Executive Summary ................................................................................................................................................................ 4
Introduction ............................................................................................................................................................................ 5
Overview................................................................................................................................................................................. 6
Annual Goals and Objectives ................................................................................................................................................. 8
Climate Change Commitment ................................................................................................................................................ 8
       Carbon Emissions............................................................................................................................................................ 8

2018/2019 Projects .............................................................................................................................................................. 10
Utility Consumption and Costs ............................................................................................................................................ 11
       Energy Use and Degree Days ....................................................................................................................................... 11

       Energy Costs.................................................................................................................................................................. 12

       Building Energy Performance Index............................................................................................................................. 12

       Energy and Weather Correlation ................................................................................................................................. 13

       Energy Intensity Normalized for Weather................................................................................................................... 14

Energy Wise Network, Change Management, & Events ..................................................................................................... 16
       Energy Efficient Housing .............................................................................................................................................. 16

       Sweater Week .............................................................................................................................................................. 16

       Energy & Sustainability Contest................................................................................................................................... 17

FortisBC Partnership............................................................................................................................................................. 17
Electric Vehicles & Charging Infrastructure ......................................................................................................................... 18
Project Plans for 2019/2020................................................................................................................................................. 18
Progress Update ................................................................................................................................................................... 18

  SUSTAINABLE ENERGY MANAGEMENT PLAN REPORT                                                                                                                                            1
Acknowledgement
The University of the Fraser Valley (UFV) acknowledges that it’s campuses are located on unceded, traditional Stó:lō
territory. The Stó:lō people have been present in their traditional territory - which includes modern New Westminster
near the mouth of the Fraser River in the west and extends up the Fraser River past Hope into the Fraser Canyon in the
east - since time immemorial.

This territory has been rich in resources and the Stó:lō people have moved throughout the territory to fish, hunt, trap,
and gather. In return for this abundance, the Stó:lō people were and still are the keepers of the lands and waters that
sustain them. Today, the Stó:lō people still use many of these resources for economic and traditional purposes.

UFV is dedicated to learning from local indigenous peoples, and within the context of environmental sustainability, there
is much more to be learned.

Originating from Sxwóxwiyám (history of a distant past) and Sqwelqel (news, recent history): “S'ólh Téméxw te
íkw'élò. Xólhmet te mekw' stám ít kwelát. This is our land. We have to look after everything that belongs to us” (Stó:lō
Research and Resource Management Centre, 2016).

 SUSTAINABLE ENERGY MANAGEMENT PLAN REPORT                                                                                 2
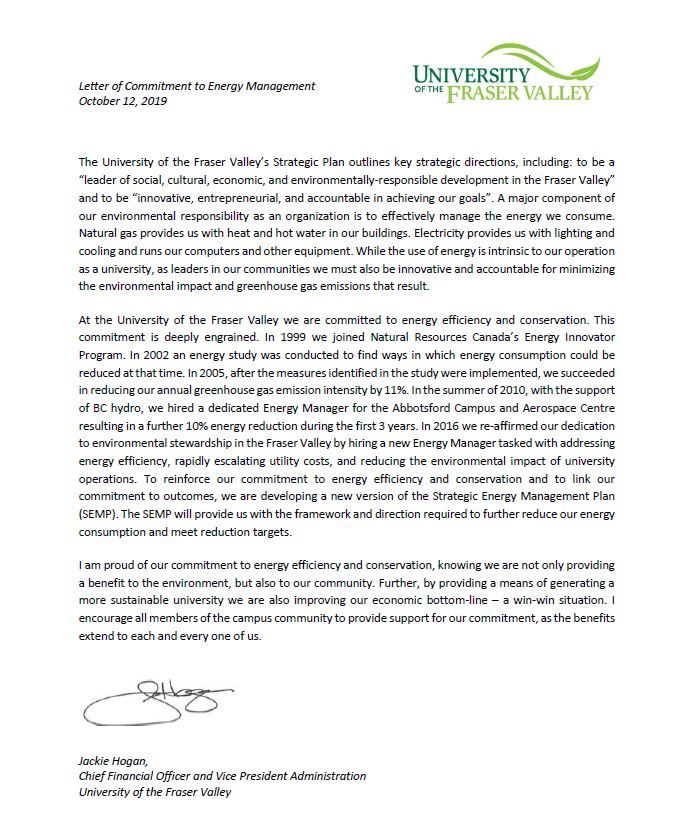
Letter of Commitment to Energy Efficiency

SUSTAINABLE ENERGY MANAGEMENT PLAN REPORT   3
Executive Summary
UFV’s energy management program tracks energy consumption. This involves monitoring the energy used throughout
24 core buildings across 2 regional campuses and 2 other locations (Chilliwack North and Aerospace).

The Campus Planning and Facilities Management Department has provided this report to demonstrate the results of
effective energy management and to reinforce UFV’s commitment to energy conservation and sustainability throughout
2018/2019. The provided framework outlines how the Energy Manager is tracking progress and planning future actions
that are aimed at increasing energy efficiency. This report also draws attention to trends in energy consumption
(electricity, natural gas, and associated carbon emissions) and emissions from university vehicles and purchased paper.

Within the timeline of 2018/2019, UFV spent $1.35 million on electricity and natural gas, which provided 10,134
megawatt hours (mWh) of electricity to power lights and equipment, as well as ventilation and cooling, and 38,752
gigajoules (gj) of natural gas for heating both water and the campuses at large. All of this energy was used to provide
and ensure the comfort of students and staff. These figures, however, change annually as a result of the revolving
building portfolio of UFV. Throughout 2018/2019, for example, UFV managed a gross floor space of 95,071m2, an
increase of 2.4% from the previous year, due to a sequence of sales, acquisitions, and lease agreements.

Additionally, the manners in which students and staff operate have significant impacts on energy use and efficiencies at
UFV. This report also provides context for and analysis of energy consumption with regards to the impacts of space
utilization.

Challenges with natural gas supply defined 2018/2019. In October 2018, the Enbridge pipeline exploded near Prince
George, resulting in a force majeure (unforeseeable circumstances that prevent the fulfillment of a contract) enacted by
FortisBC and Shell Canada, UFV’s natural gas providers. This forced UFV to drastically reduce the amount of natural gas
used at the Abbotsford campus, and caused significant financial strain due to extreme fluctuations in pricing. These two
side effects were magnified during a historically cold 6 week period in February and the beginning of March, 2019.
Natural gas consumption was reduced by 13.8% compared to the previous year.

Energy management is hinged on the ability to control or at least influence certain contributing factors with regards to
energy efficiency. Weather and its fluctuations cannot be controlled by UFV, which poses an external, unpredictable
variable to maneuver. An analysis of energy efficiency and the impacts of outdoor air temperatures is also being
provided in this report.

Despite the various challenges faced by the energy management team, the profile and impact of this department has
increased due to the success of a series of projects, programs, initiatives, and events. These improvements include
lighting upgrades that have increased efficiency and provided high quality lighting; mechanical upgrades that have
increased reliability, efficiency, and effectiveness regarding temperature maintenance; and awareness of, and
participation in, behavioural change campaigns have cultivated a culture of energy awareness and sustainability.

A multitude of events in 2018/2019 highlighted the connection between UFV’s operations and the big picture of climate
change, which further emphasized UFV’s intentions to mitigate its environmental impact, both locally and globally.

 SUSTAINABLE ENERGY MANAGEMENT PLAN REPORT                                                                                 4
Introduction
This Strategic Energy Management Plan (SEMP) Report supports the commitment of the University of the Fraser Valley
(UFV) to energy efficiency and conservation by providing a framework for reducing energy consumption and its
associated environmental impact. This SEMP includes a specific energy reduction target and an action plan related to
how the target will be achieved.
Energy management allows UFV to strive towards the key strategic directions outlined in the organization’s Strategic
Plan; namely, to be a “leader of social, cultural, economic, and environmentally-responsible development in the Fraser
Valley” and to be “innovative, entrepreneurial, and accountable in achieving our goals.”
By implementing the actions detailed in this SEMP, UFV is demonstrating leadership through innovation and
accountability for the resources it uses as an organization. Furthermore, UFV’s hiring of a dedicated Energy Manager in
the spring of 2016 emphasizes their commitment to the following:
    •   To reduce operating costs through energy conservation and efficiency;
    •   To minimize the environmental impact of the organization;
    •   To reduce greenhouse gas emissions, which is of global importance;
    •   To reduce exposure to energy cost escalations;
    •   To reduce reliance on the province’s energy infrastructure;
    •   To demonstrate effective management of resources;
    •   To promote our successes to the general public and other universities;
    •   To strive towards educating those who will shape the future of our community, province, and country on the
        importance of managing the resources we use

 SUSTAINABLE ENERGY MANAGEMENT PLAN REPORT                                                                            5
Overview
UFV has been an important partner in the Lower Mainland community, and has been contributing to the educational
and economic development of the Fraser Valley over the last 40+ years and has undergone many changes itself during
this time. The university was founded as Fraser Valley College (FVC) in 1974, became the University College of the Fraser
Valley (UCFV) in 1991, and gained university status in 2008. Currently, UFV has campuses in Abbotsford, Chilliwack, and
Mission, with regional centres in Hope and Chandigarh, India and now hosts over approximately 15,000 students
annually. The scope of this report will demonstrate this pattern of continual growth by focussing on the following:

    •    24 core buildings
    •    95,071m2 of facility space*
    •    2 certified LEED Gold buildings (18,358m2)
    •    14,853 on-site students, Chandigarh excluded (2018/2019)
    •    1,251 faculty and staff (2018/2019)
    * Net floor space, for the purpose of this report, is based on 92,157m2, a figure that accounts for buildings/spaces that were managed for only
    portions of the year by UFV.

Table 1: Building descriptions
                                                      2
Campus       Building         Originally Built Area (m ) Description / Use
Aerospace H4                             1974      2,620   Aerospace Training Centre
           FH                            1975        251   Friesen House (President's Residence)
           ABB - A                       1983      9,000   Classrooms, laboratories, administration
           ABB - B                       1983      8,543   Classrooms, administration, cafeteria, logistics
           ABB - C                       1983      4,892   Classrooms, administration
           ABB - D                       1997      5,740   Classrooms, print services, logistics department
           ABB - E                       2002      3,797   Gymnasium
Abbotsford
           ABB - F                       1994        516   University House; Conference Services, Centre for Indo-Canadian studies
           ABB - G                       1995      5,687   Library, administration
           ABB - H                       2006      8,104   Baker House (student residences), campus bookstore
           ABB - K                                 2,209   Renovations, ITS occupied
             ABB - S                     2014      4,358   Students Union Building, administration, banquet hall
             ABB - T                     2006        353   Athletics administration
             CHWK N - D                  1993      5,380   Leased to tenants
Chilliwack
             CHWK N - E                  1993        534   Leased to tenants
Campuses
             CHWK N - G                  1993        516   Leased to tenants
             CEP - A                     1971     14,000   Classrooms, administration, logistics
             CEP - H (ACE)               2012      1,944   Agriculture Centre of Excellence, greenhouses, livestock pens
             CEP - Q                                 338   Athletics
 Canada
             CEP - R                               1,658   Athletics, health sciences
Education
             CEP - S (1041)                        2,397   Heavy Duty Mechanical
Park (CEP)
             CEP - TTC                   2007      9,904   Trades and Technology Centre, shops, classrooms, administration, cafeteria
             CEP - V                     1971        892   Classrooms, administration
             CEP - W                     1971      1,438   Print services, warehousing

 SUSTAINABLE ENERGY MANAGEMENT PLAN REPORT                                                                                                      6
Table 2: Energy use and estimated costs
2018/2019 Energy Consumption Costs*
Location Electricity Natural Gas Energy Total
Campus m2 kWh $ GJ ekWh $ ekWh $
ABB & AERO 54,763 6,184,200 $ 637,696 20,109 5,585,907 $ 148,202 11,770,107 $ 785,898
CEP 32,571 3,454,529 $ 353,566 15,943 4,428,670 $ 138,556 7,883,199 $ 492,123
CHWK N & 5 Corners 4,823 496,218 $ 53,679 2,700 749,861 $ 20,435 1,246,079 $ 74,115
Total 92,157 10,134,947 $ 1,044,942 38,752 10,764,438 $ 307,193 20,899,385 $ 1,352,135
*Cost estimate accuracy is limited by fluctuating rates and administrative fees unrelated to energy consumption.
UFV’s building portfolio continues to shuffle and follow a growth trend over a 10-year period (2009 – 2019). In
2018/2019 UFV sold the Chilliwack North Campus, and leased out CEP Building N. UFV also purchased the former
Finnegan’s Pub and Phoenix Ballroom and promptly began renovations on the now-named Abbotsford Campus Building
K. These transactions combined for a net decrease of 4,194m2 (4.5%) floor space operated by UFV by March 31st, 2019.
In terms of energy, removing buildings or facility space yields a decrease in consumption as those spaces no longer
require heating, cooling, and electricity. The degree to which energy use is affected is influenced by a number of factors
including weather, operating schedules, system efficiencies, and how occupants interact with the building/space.
Consider that older, inefficient buildings such as Chilliwack North have higher energy intensities than those of
classrooms and offices found within the newer, modern Abbotsford Campus Building K. Throughout this report, different
approaches to analyzing energy efficiency will be presented, highlighting key variables and providing context for the
challenges in monitoring overall energy consumption patterns in a changing portfolio.
Figure 1: Gross floor area changes and trends over a 10 year period.
SUSTAINABLE ENERGY MANAGEMENT PLAN REPORT 7Annual Goals and Objectives
1. Develop and maintain an annual SEMP, with an initial report on the 2016/2017 fiscal year.
2. Reduce energy (ekWh) per degree day (DD)* per area (m2): ekWh/DD/m2 by 10% by 2021/2022 from the
2015/2016 levels.
* A degree day (DD) is a measure of heating and cooling. There are two varieties of DD; when separated they are identified as: Heating Degree Days
(HDD) or Cooling Degree Days (CDD). Degree days for a given day represent the number of Celsius degrees that the mean temperature is above or
below, when compared to a given base temperature. For example, Heating Degree Days represent any number of degrees that fall below 18 °C. If
the temperature is equal to or greater than 18 °C, then the number will be zero. A cooling degree day is the inverse. Source: Environment
Canada www.climate.weather.gc.ca. Climate ID 1100031.
Table 3: Energy efficiency target timeline
Year-to- Cumulative
Reduction Year Change
ekWh/DD/m2 Target Target Actual Change From Base
2015/2016* - - 0.0889 - -
2016/2017 -2% 0.0871 0.0867 -2.5% -2.5%
2017/2018 -2% 0.0854 0.0841 -2.6% -5.1%
2018/2019 -2% 0.0837 0.0788 -7.3% -12.4%
2019/2020 -2% 0.0820
2020/2021** -2% 0.0804
* Base Year Period
** Target Year Period
Climate Change Commitment
Climate is the term used to refer to the average weather patterns in a particular area over a long period of time. Climate
change, by extension, is understood to be the relatively rapid increase in global temperature, with localized rises in
extreme weather and shifts in climate. These rapid temperature increases have been observed and measured most
significantly throughout the 21st century. The greenhouse gas emissions that result from human activities are driving
climate change and significantly contribute to the continuous rise of global temperatures. These emissions are currently
at their highest levels in recorded history. Climate change is now affecting every country on every continent. It is
disrupting national economies and affecting lives; costing people, communities, and countries dearly today and even
more tomorrow. Communities are experiencing significant impacts as a direct result of climate change, including
changing weather patterns, rising sea levels, and increasing amounts of extreme weather. For example, precipitation,
wind, and extreme temperatures have led to catastrophic wildfires, flooding, hurricanes, droughts, and coastal erosion
events.
UFV recognizes the impacts of climate change and that institutional effects stretch far beyond the classroom, and into
the local and international communities wherein students and graduates reside, work, and/or conduct business. UFV
prepares students for when they enter society with new skillsets, ideas, and expectations; and so in an effort to better
serve our students and the global community, UFV refreshed its approach to the development, promotion, and support
of sustainability initiatives in 2016/2017, including both immediate and long term efforts to mitigate negative
operational impacts on climate change.
Carbon Emissions
UFV reports emissions to LiveSmart BC using the SMARTTool reporting system, and purchases credits to offset these
emissions. As part of this, a Carbon Neutral Action Report (CNAR) is prepared by UFV each year outlining the efforts
SUSTAINABLE ENERGY MANAGEMENT PLAN REPORT 8both undertaken and planned to reduce carbon emissions. Through the purchase of offsets, UFV is carbon neutral by definition. The Carbon Neutral Action Report can be viewed at: www.ufv.ca/energy/. BC’s public sector organizations are to reduce carbon emissions by 33% by 2020, compared to 2007 levels. UFV has adopted this provincial target as a guideline for organizational emissions reductions. The carbon footprint for the University of the Fraser Valley (including the Chandigarh, India campus) registered at 2,380 tCO 2 e (tonnes of carbon emissions equivalent) in 2018 (not including 2017 adjustments); that value was lower than the previous year’s value of 2,700 tCO 2 e. Scope 1 emissions: stationary (buildings natural gas use) and fleet were the sources for 90.5% of emissions, scope 2 emissions (electricity and estimated Chandigarh, India campus) accounted for 7%, and emissions from paper consumption totalled 2.5%. Through a variety of efforts – from increasing energy efficiency to reducing paper usage – gross carbon emissions have declined by 33% from 2009 levels. It should be noted that floor space has increased 22% during the period between 2009 and 2018. Carbon emissions intensity, which considers floor space (tCO 2 e/m2), at UFV has been reduced 74% during the 2009 – 2018 period. In relation to the university’s activities as measured by full time equivalent (FTE) on-site student enrolment (7,951), the 2018 carbon footprint decreased by 20% compared to the previous year. In recent years annual gross carbon emissions were on the decline, until a spike in 2017. Gross emissions in 2018 returned to form and continued the downward trend with a 13% decrease from the previous year. Weather, efficiency improvements, and the aforementioned force majeure were the driving factors behind these results. A warm start to the 2018/2019 winter, followed by a sharp cold spell in the early spring months increased attention to building automation, schedules and setpoints, and the mandated reductions in natural gas use had significant impacts on carbon emissions. When accounting for weather and changes to UFV’s building portfolio (represented as: tCO 2 E/HDD/m2), UFV SUSTAINABLE ENERGY MANAGEMENT PLAN REPORT 9
increased emissions efficiency by 6.2%. Even though the weather cannot be controlled, the management of buildings,
fleet, and paper consumption can be. Overall, tCO 2 E/HDD/m2 has been reduced by 55% in the 2009 – 2018 period.
Figure 2: 2018 Carbon emissions by source Figure 3: Building emissions per year, and normalized
emissions for space and weather fluctuations
2018/2019 Projects
There is an increased reliance on technology (computers, scanners/printers, laptops, tablets, projectors, etc.) in
classrooms and offices, which in turn increases the demand for electricity, and can require additional cooling in some
spaces. With this increased utilization of energy-requiring technology, and considering the challenging service
disruption period, there was an increased onus on the Facilities department to optimize major energy-consuming
systems, such as boilers, chillers, and the HVAC system that brings conditioned air to learning and working spaces.
In an effort to reach the annual ekWh/DD/m2 reduction targets, there were numerous mechanical and systematic
upgrades in 2018/2019 that were aimed at increasing the energy efficiency of the university and the comfort of UFV
students, staff, and faculty. They were as follows:
Table 4: 2018/2019 Energy Efficiency Projects
Electricity Natural Gas Increased Energy Cost
Campus Bldg. Project Savings Savings Comfort Study Management
AERO H4 Hangar LED Upgrade
ABB B Carbon Capture Pilot
ABB C Boiler Upgrade
ABB D Chiller Upgrade
ABB D Classroom LED Upgrade
ABB FH President's House LED Upgrade
ABB G Boiler Purchase
ABB H Water, Energy Upgrades & Study
ABB H LED Upgrades
ABB S Solar Air Collector Study
ABB Multiple Interruptable Rate Change
CEP H Greenhouse Thermal Curtain Study
CEP T Interior Lighting LED Upgrade
CEP Multiple Parking Lot Lighting LED Upgrade
ABB & CEP Multiple EndoTherm Installations (Innovation Fund Project)
All FortisBC Energy Specialist Funding
All Fleece Blanket Program
All DDC Programing Adjustments
SUSTAINABLE ENERGY MANAGEMENT PLAN REPORT 10Utility Consumption and Costs
Table 4 depicts the historical changes in electricity and natural gas usage, overall floor space, and the estimated costs
associated with each energy source. As UFV grows, we continue to be challenged to reduce overall energy consumption.
Mechanical maintenance workers and operations staff, the Associate Director of Building Systems, the Energy Manager,
and the Campus Planning and the Facilities Management office all have significant influence on how energy on campus is
consumed. One important aspect of energy management that cannot be influenced by operations is the cost rate. As
customers of BC Hydro for electricity, and FortisBC and Shell Energy North America for natural gas, our influence does
not extend into their rate structure process. Therefore, the success or failure of any energy management program must
not be solely based upon costs.
Table 5: Historical energy consumption and costs
UFV Historical Energy Consumption and Estimated Costs
Electricity Natural Gas Energy Total
Year m2 kWh $ GJ ekWh $ Total ekWh $
2011/2012 87,782 10,481,103 $ 723,451 55,892 15,525,474 $ 384,675 25,964,602 $ 1,095,266
2012/2013 90,376 10,809,236 $ 791,552 51,578 14,327,352 $ 381,249 25,136,588 $ 1,167,498
2013/2014 90,376 10,448,205 $ 827,097 44,508 12,363,212 $ 425,251 22,811,417 $ 1,241,877
2014/2015 94,734 10,266,500 $ 911,313 35,677 9,910,230 $ 342,119 20,176,730 $ 1,253,432
2015/2016 94,734 11,297,690 $ 1,080,527 40,425 11,229,255 $ 327,502 22,526,945 $ 1,408,029
2016/2017 92,835 11,040,667 $ 1,091,951 44,391 12,330,940 $ 356,027 23,371,607 $ 1,447,979
2017/2018 92,835 10,668,116 $ 1,078,422 45,197 12,554,844 $ 336,858 23,222,960 $ 1,415,280
2018/2019 92,156 10,134,947 $ 1,044,942 38,752 10,764,438 $ 307,193 20,899,385 $ 1,352,135
Energy Use and Degree Days
Figure 4: Energy use and degree day correlation
Energy use is significantly correlated to outdoor air temperature/weather conditions. Regionally, we have significantly
more days that require heating (Heating Degree Days) than cooling (Cooling Degree Days) to keep occupants
comfortable while teaching, learning, and working. Figure 5 outlines the consumption of electricity and natural gas, the
total energy use, and the number of Degree Days within the associated time period. The Degree Days line generally
SUSTAINABLE ENERGY MANAGEMENT PLAN REPORT 11follows the pattern of energy consumption, which on a macro level aides in determining whether there are any significant problems within the buildings or whether we are operating appropriately. A large gap between the Degree Days line and energy total suggests that the portfolio is increasingly efficient. In addition to Degree Days, there are many other determining factors affecting the efficiency of operations within buildings; as such, they will be outlined further in this report. Energy Costs The energy cost breakdown by campus is shown in Figure 6 below. The Abbotsford campus accounts for the majority of the energy cost for UFV. CEP, however, has two of the highest energy intense buildings: Building T (the Trades and Technology Centre) and Building H (the Agriculture Centre of Excellence). Electricity costs have risen 34% within the 8 year period between 2011/2012 and 2018/2019. In 2014, BC Hydro announced a 28% hike in electricity rates over 5 years, beginning that year with a 9% rise, followed by annual 6%, 4%, 3.5%, and a 3% rise in 2019/2020, the final year of the plan. Even though having rate increases published in advance allows for better preparation and planning, the challenge presented by significantly escalating costs remains. Natural gas rates have been fluctuating between $7.45 and $9.59 per gigajoule since 2011/2012. The 2018/2019 rates increased by 8.8% compared to the previous year. The majority of UFV buildings are now included in the BCNET contract which typically provides benefit to UFV with regards to purchasing natural gas. BCNET is a network of post-secondary institutes that leverages purchasing power by buying Shell gas in bulk after market speculation. Figure 5: Energy costs per campus Figure 6: Energy costs and blended rates have risen drastically Building Energy Performance Index UFV is continuously acquiring and selling buildings. Each of these buildings have their own unique Building Energy Performance Index (BEPI), a measure of energy intensity (ekWh/m2). Depending on the type of building and the users of that building (See Figure 2), some can have a comparatively much higher BEPIs. Therefore, the sale and acquisition of buildings can have a significant impact on BEPIs at the campus level. BEPIs are useful for measuring the energy intensity between two similar facilities that operate under similar conditions (occupant type, operating hours, etc.). This measure, however, has significant limitations. BEPIs do not consider weather, schedules, occupants, or end uses. In light of these limitations, BEPIs provide a starting point for looking at energy efficiency and building performance. The following charts and graphs will provide increasingly specific details related to BEPIs. The cumulative BEPIs of each campus are outlined below in the Campus Energy Performance Index graph. SUSTAINABLE ENERGY MANAGEMENT PLAN REPORT 12
Table 6: Annual campus Building Energy Performance Index (BEPI), (ekWh/m2)
          BEPI        ABB &        CEP      CHWK - N      Overall     Difference        Overall       Difference
     2011/2012           311.9       198.2        482.6       295.8           0.0                 0                0
     2012/2013             277.0       288.4        255.3        278.1         -17.7         -17.7          -6.3%
     2013/2014             276.9       240.5        174.4        252.4         -25.7         -43.4         -10.2%
     2014/2015             214.8       224.9        171.6        213.0         -39.4         -82.8         -18.5%
     2015/2016             238.1       266.7        157.5        237.8          24.8         -58.0          10.4%
     2016/2017             242.7       256.8        298.0        251.8          14.0         -44.0           5.5%
     2017/2018             233.7       273.8        269.0        250.2          -1.6         -45.6          -0.6%
     2018/2019             214.9       242.0        258.4        226.8         -23.4         -69.0         -10.3%

                Figure 7: Annual campus Building Energy Performance Index (BEPI)

Energy and Weather Correlation
Weather, as discussed, plays a significant role in energy consumption. Heating and cooling systems are influenced by
weather because, for example colder winters demand higher heating loads, and therefore higher energy consumption.
Similarly, hotter summers have higher cooling loads, and subsequent increased energy consumption.

Degree Days will assist in determining the effect that weather had on energy consumption in a given year, and as a
result conclusions on the performance of buildings or individual systems can be made.

For example, 2018/2019 was characterized by a prolonged hot summer, a warm winter with the exception of a 6-week
cold spell in February and March. The utility bills show that gas consumption (primarily for space and water heating)
increased significantly compared to previous years; the graph and chart below show that the energy consumed (ekWh)
as it correlates to weather conditions (DD) actually decreased a further 3.0%, which points to an increase in overall
energy efficiency organization-wide.

 SUSTAINABLE ENERGY MANAGEMENT PLAN REPORT                                                                             13
Table 7: Annual campus energy and weather correlation (ekWh/DD)
Overall Difference
CHWK - N Cumulative From
ekWh/DD ABB & AERO CEP & 5 Corners Overall Difference Difference Previous Year
2011/2012 5,078 1,822 1,639 8,539 0 0 0
2012/2013 4,847 3,047 990 8,885 346 346.0 3.9%
2013/2014 4,604 2,415 643 7,662 - 1,223 -876.7 -16.0%
2014/2015 4,680 2,720 762 8,161 499 -377.6 6.1%
2015/2016 4,793 2,979 646 8,418 257 -120.3 3.1%
2016/2017 4,501 2,820 727 8,048 - 370 -490.7 -4.6%
2017/2018 4,251 2,950 643 7,844 - 204 -694.7 -2.6%
2018/2019 4,088 2,738 433 7,258 - 586 -1280.2 -8.1%
Figure 8: Annual campus energy and weather correlation (ekWh/DD)
Energy Intensity Normalized for Weather
Previous sections have touched on the metrics used to monitor energy as it relates to space changes (BEPI) as well as
weather (ekWh/DD). The graph and chart below account for both variables as we attempt to reliably monitor how
efficiently our buildings are being operated. This is done by using the following equation: ekWh/DD/m2.
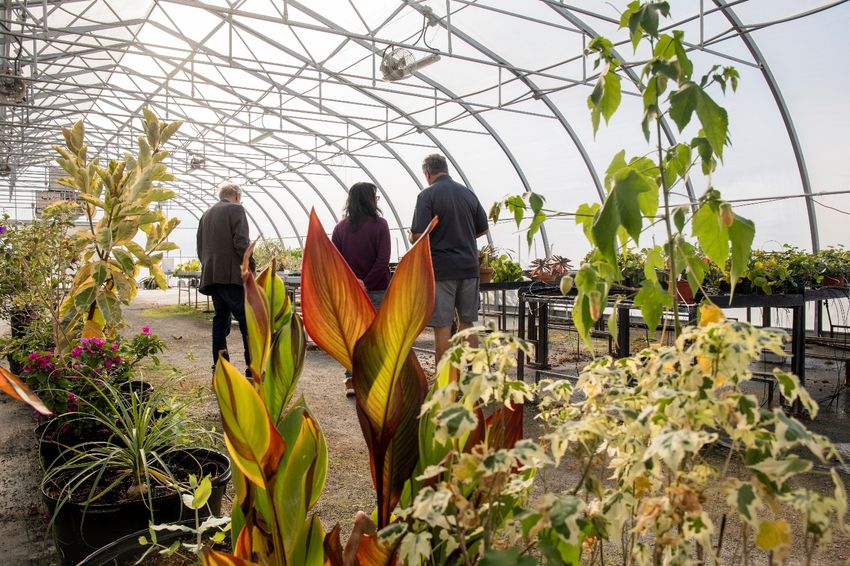
SUSTAINABLE ENERGY MANAGEMENT PLAN REPORT 14It has been demonstrated that energy consumption decreased, floor space decreased, and Degree Days were average.
The 7.3% reduction in ekWh/DD/m2 outlines the efforts of the key stakeholders in increasing energy efficiency
throughout our buildings. This reduction is another positive step towards achieving the key goal outlined by the Energy
Manager: reducing ekWh/DD/m2 by 10% by 2021/22 based on 2015/2016 levels. Another positive step forward for
energy efficiency and sustainability at UFV.
The 10% increase in the energy-efficiency target has been exceeded in just 3 years.
Table 8: Annual energy intensity normalized for weather (ekWh/DD/m2)
Overall Difference
Cumulative From
ekWh/DD/m2 ABB & AERO CEP CHWK - N Overall Difference Difference Previous Year
2011/2012 0.1026 0.0652 0.1587 0.0973 0 0 0
2012/2013 0.0979 0.1019 0.0902 0.0983 0.0010 0.0010 1.1%
2013/2014 0.0930 0.0808 0.0586 0.0848 -0.0135 -0.0125 -16.0%
2014/2015 0.0869 0.0910 0.0694 0.0861 0.0014 -0.0111 1.6%
2015/2016 0.0890 0.0997 0.0588 0.0889 0.0027 -0.0084 3.1%
2016/2017 0.0836 0.0884 0.1026 0.0867 -0.0022 -0.0106 -2.5%
2017/2018 0.0789 0.0925 0.0908 0.0845 -0.0022 -0.0128 -2.6%
2018/2019 0.0746 0.0841 0.0897 0.0788 -0.0057 -0.0185 -7.3%
Figure 9: Annual energy intensity normalized for weather (ekWh/DD/m2)
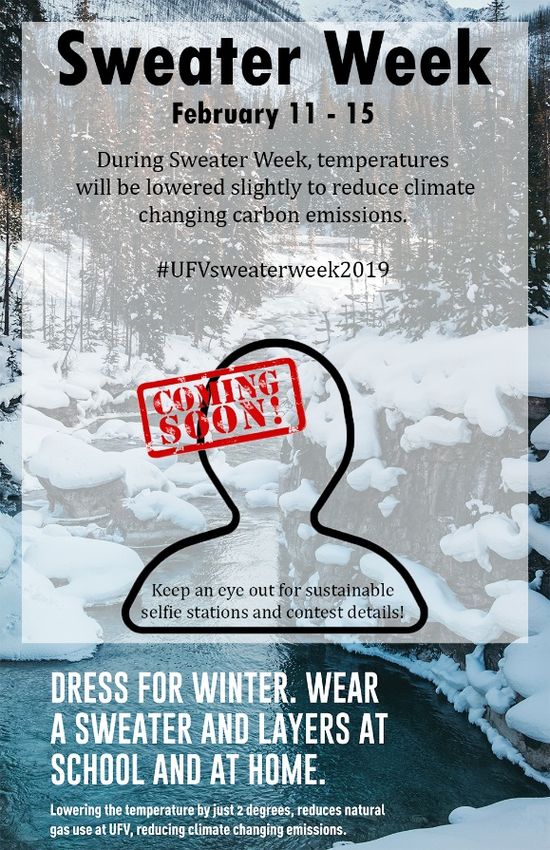
SUSTAINABLE ENERGY MANAGEMENT PLAN REPORT 15Energy Wise Network, Change Management, & Events SustainableUFV, the campus champions of environmentally responsible initiatives, joined the Energy Wise Network in 2016. The Energy Wise Network is a collaborative network made up of Advanced Education, Government, Schools (K- 12), Hospitality, Municipalities, Property Management, and Retail sectors. This network supplanted the Workplace Conservation Awareness program and was initiated by BC Hydro and FortisBC. The network provides campaign tool kits, professional coaching hours, networking opportunities, training webinars, and two summits per year which provide the framework for many of the energy efficiency-focused initiatives throughout 2018/2019. Energy Efficient Housing Another group of occupants, another refreshed approach to increased awareness regarding sustainability on campus – who better to involve than those that live on campus? The Energy Efficient Housing campaign was designed to start to connect students to the campus and encourage them to participate in the increasing sustainability culture that is being developed. While coordinating with the Housing Operations staff and management, there was immediate enthusiasm and commitment to participate in this campaign. They provided valuable insight not only into how to communicate with the residents, but also in regards to the particular behaviors that have been observed. The Energy Wise Network was instrumental in developing a framework with which to approach the residence staff, which provided them with an idea of what success looks like through a sustainability lens, and options for how to get there. The staff enabled and set in motion the action portion of the project that will take place in 2019/20 and beyond. Sweater Week The annual Sweater Week event is conducted in winter in order to promote warm workplace attire. In 2019 this event ran from the 11 to the 15 of February, and built on the successes from the 2016 and 2017 events. On an operational level, it was decided that this year the temperatures would be lowered by 2°C (to a minimum of 19.5°C instead of the previous year’s minimum of 21.5°C). These reductions would be realized across all buildings – academic spaces and offices, excluding laboratories – at both of the main campuses in Abbotsford and Chilliwack. This decrease would be in full effect for the entire week, rather than administering a progressive reduction of temperatures, as was done in 2016. This new action reduced GHG emissions more significantly than by using the previous strategy, as well as created more talking points, which afforded more opportunities for participation. The main source of engagement was a social media contest, in which students, staff, and faculty were encouraged to either post Sweater Week selfies on various platforms (Facebook, Twitter, and/or Instagram) or email selfies to the Sustainability Coordinator. Furthermore, volunteers formed the “Sustainable Selfie Squad,” which involved setting up a daily station – an info and photo booth – in the cafeteria during the coffee and lunch time rushes to further drive engagement and get people talking about greenhouse gas emissions and sustainable practices as a whole. Sweater Week was cancelled this year due to campus closures and a lack of resources for managing the building automation systems considering other competing priorities related to the historic cold, snow removal, and campus closures. SUSTAINABLE ENERGY MANAGEMENT PLAN REPORT 16
Energy & Sustainability Contest
The primary focuses of the contest were to encourage energy-efficient behaviour change at UFV and to provide
incentives to improve sustainable living at home too! The contest outlined nine attainable actions that most people
could participate in with a slight modification or two to their lifestyle. A little nudge to participate came from the
potential to win prizes.

During the two-week contest, participants could submit pictures via email or post photos of their energy efficient and
sustainable actions to social media and tagging @sustainableUFV to ensure their post was visible.

The grand prize was handed out to the participant that engaged in highest number of actions. Two runner-up prizes
were also provided. The remaining prizes were distributed through a random draw.

FortisBC Partnership
Energy Specialist Funding
2018/2019 marked the first year that the Energy Manager received Energy Specialist Funding support from FortisBC. The
natural gas provider encourages efficient use of natural gas and has numerous programs that offer support to achieve
gigajoule and dollar savings. UFV participated in a number of FortisBC incentive programs in 2018/19.

Get Your Fleece On! 3.0
FortisBC supported UFV’s Get Your Fleece On! by delivering 100 fleece blankets to the University of the Fraser Valley in
February, 2019 and sponsoring the embroidery of the SustainableUFV emblem onto each blanket. The logo is a constant
visual reminder of why we have blankets to distribute and communicates to users that we are striving to reduce our
environmental impacts and be responsible in our energy use.

For many years FortisBC has been an exceptional partner in supporting UFV’s change management projects and
supporting conservation in the workplace.

ABB E Solar Wall Study
As the Campus Planning and Facilities Management Department shifts its focus from pure energy savings to carbon
intensity reductions, studying new technologies and passive solutions has become increasingly valuable. In the spring of
2019 UFV contracted Stage 3 Renewables to study the feasibility of installing a solar wall on the south side of Abbotsford
Building E (Envision Athletic Centre). FortisBC provided 50% of the funding for this project feasibility study.

CEP H Thermal Curtains Study
In an effort to reduce the intense consumption of natural gas at the greenhouse facilities located at the CEP Campus,
Building H, a study was conducted to assess the potential for installing thermal curtains to reduce heat loss through the
poly and glass envelopes of the greenhouses. FortisBC provided 50% of the funding for this feasibility study.

Carbon Capture Pilot
The FortisBC Carbon Capture Pilot project still remains as a possibility in future months and years. The unit has been
delivered to Abbotsford Building B, but has not been fully connected as it is caught in regulatory challenges. FortisBC and
Clean02 are confident that this innovative system will be operating at UFV in the near future, scrubbing carbon from the
exhaust vents and creating a commercially viable soap product. FortisBC has funded 100% of the equipment,
installation, and monitoring associated with this project.

 SUSTAINABLE ENERGY MANAGEMENT PLAN REPORT                                                                               17
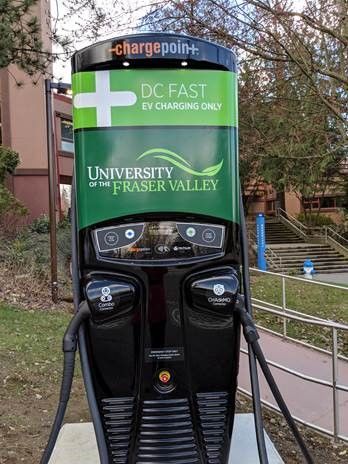
Electric Vehicles & Charging Infrastructure
UFV has five Level 2 stations capable of charging up to 10 vehicles simultaneously.
These stations provide electricity to all students, staff, and faculty free of charge.
Additionally, UFV also has a Level 3 fast charging station that is capable of charging one
vehicle at a time, at a nominal fee per minute. Two new Level 2 (one ABB, one CEP)
and one Level 3 (ABB) stations were installed in 2018/2019. There have been
significant annual increases in individual charging sessions, energy provided for cost-
free charging (except Level 3), and emissions reductions from traditional combustion
engine vehicles. Data, provided by ChargePoint, the company that manages the
technical components of UFV’s EV charging stations, from 2018/2019 supports the
community-wide trend that further investments in charging infrastructure are
required.

               Table 9: EV charging station historical use

                              # of Stations     Sessions     Energy (kWh)     Community GHG Savings (t)
                 2013/2014           4             51           227.5                  0.096
                 2014/2015           4            459           3,150                  1.33
                 2015/2016           4            971           9,830                  4.13
                 2016/2017           3           1,357          13,928                 5.85
                 2017/2018           3           1,396          13,076                 5.49
                 2018/2019           6           3,608          33,241                 13.96

Project Plans for 2019/2020
•   Abbotsford A Building: EIFS Remediation Project           •   Abbotsford E Building: Air Handling Unit Upgrade
•   Abbotsford A Building: EIFS Energy Study                  •   Abbotsford K Building: Parking Lot LED Upgrade
•   Abbotsford A Building: Lot 6 L2 EV Charging Bank          •   Abbotsford K Building: Mechanical Insulation Upgrade
•   Abbotsford B Building: Carbon Capture Pilot               •   CEP Building H: Fortis BC Carbon Capture Pilot
•   Abbotsford C Building: Boiler Replacement                 •   All Campuses: DDC Optimization
•   Abbotsford D Building: EIFS Energy Study                  •   All Campuses: Carbon Emissions Reduction Plan
•   Abbotsford G Building: Boiler Installation                •   All Campuses: De-Carbonization Studies
•   Abbotsford H Building: De-carbonization Study             •   FortisBC Energy Specialist funding
•   Abbotsford E Building: Solar Wall Installation

Progress Update
As UFV expands in size and influence, the culture of sustainability likewise grows within the organization. The
environmentally-responsible approach to facilities operations is increasingly extending to new projects, renovations, and
facilities maintenance. Furthermore, the prevalence of and participation within campaigns for behavioural changes is
improving energy efficiency not only at UFV, but also within the communities in which students and employees reside.
Considering the above, in addition to the supporting metrics outlined within this report, 2018/2019 provided continuity
to support previous years’ successes in sustainable energy management. Energy efficiency continues to be improved and
to exceed targets. Energy efficiency, the reduction of greenhouse gas emissions, and an increased dedication to
environmentally-responsible operations support the outlined strategic direction that is aimed at changing lives and
building community.

 SUSTAINABLE ENERGY MANAGEMENT PLAN REPORT                                                                           18
You can also read