CAPITALAND LIMITED 1Q 2021 Business Updates 12 May 2021 - Invest With CapitaLand
←
→
Page content transcription
If your browser does not render page correctly, please read the page content below

CAPITALAND LIMITED 1Q 2021 Business Updates 12 May 2021
Disclaimer
This presentation may contain forward-looking statements. Actual future performance, outcomes and results may differ materially from those expressed in
forward-looking statements as a result of a number of risks, uncertainties and assumptions. Representative examples of these factors include (without limitation)
general industry and economic conditions, interest rate trends, cost of capital and capital availability, availability of real estate properties, competition from
other developments or companies, shifts in customer demands, shifts in expected levels of occupancy rate, property rental income, charge out collections,
changes in operating expenses (including employee wages, benefits and training, property operating expenses), governmental and public policy changes
and the continued availability of financing in the amounts and the terms necessary to support future business.

You are cautioned not to place undue reliance on these forward-looking statements, which are based on the current view of management regarding future
events. No representation or warranty express or implied is made as to, and no reliance should be placed on, the fairness, accuracy, completeness or
correctness of the information or opinions contained in this presentation. Neither CapitaLand Limited (“CapitaLand”) nor any of its affiliates, advisers or
representatives shall have any liability whatsoever (in negligence or otherwise) for any loss howsoever arising, whether directly or indirectly, from any use of,
reliance on or distribution of this presentation or its contents or otherwise arising in connection with this presentation.

The past performance of CapitaLand or any of the listed funds managed by CapitaLand Group (“CL Listed Funds”) is not indicative of future performance.
The listing of the shares in CapitaLand (“Shares”) or the units in the CL Listed Funds (“Units”) on the Singapore Exchange Securities Trading Limited (“SGX-ST”)
does not guarantee a liquid market for the Shares or Units.

This presentation is for information only and does not constitute an invitation or offer to acquire, purchase or subscribe for the Shares, Units or shares of
CapitaLand Investment Management Limited ("CLIM"). No offering of Shares, Units or shares of CLIM is being made in connection with the matters discussed
herein in Singapore or otherwise.

The directors of the Company (including any who may have delegated detailed supervision of the preparation of this presentation) have taken all reasonable
care to ensure that the facts stated and all opinions expressed in this presentation in each case which relate to the Company, CLIM and CapitaLand
Integrated Commercial Trust (“CICT”) (excluding information relating to the Offeror or any opinion expressed by the Offeror) are fair and accurate and that,
where appropriate, no material facts which relate to the Company, CLIM and CICT have been omitted from this presentation, and the directors of the
Company jointly and severally accept responsibility accordingly. Where any information which relates to the Company, CLIM and CICT has been extracted
or reproduced from published or otherwise publicly available sources or obtained from the Offeror, the sole responsibility of the directors of the Company has
been to ensure that, through reasonable enquiries, such information is accurately extracted from such sources or, as the case may be, reflected or
reproduced in this presentation. The directors of the Company do not accept any responsibility for any information relating to the Offeror or any opinion
expressed by the Offeror.

                                                                                                                                                                     2
Table of Contents
•    Key Highlights
•    Operational Performance
•    YTD Real Estate Transactions
•    Financial Highlights
•    Supplemental Information
1.   Key Operational Statistics

2.   Proposed Restructuring of CapitaLand

                                            LuOne, Shanghai, China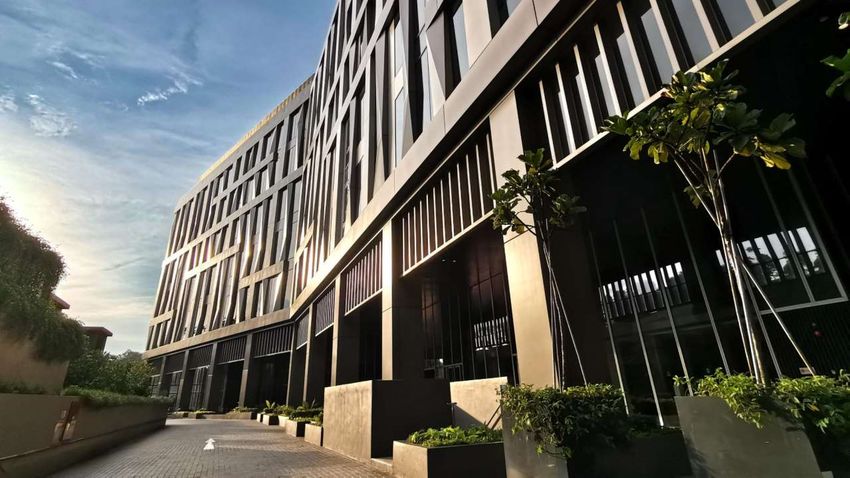
Key Highlights
                                             IMPROVING                                                                  REAL ESTATE
                              1              OPERATIONAL                                                          2     TRANSACTIONS GAIN
                                             PERFORMANCE                                                                MOMENTUM
                                             •    Operational recovery across                                           •   Total YTD investments across the
                                                  asset classes in 2H 2020                                                  Group: S$2.7bn1
                                                  continued into 1Q 2021
                                                                                                                        •   ~95% invested into new economy
                                             •    1Q 2021 fund management fee                                               assets
                                                  income picks up YoY on
                                                  improved capital recycling                                            •   Total YTD divestments across the
                                                                                                                            Group: S$1.0bn2

                                                                                        RESTRUCTURING TO SHARPEN
                                                                        3               GROWTH

                                                                                        •     Proposed separating Development business from
                                                                                              Investment   Management       business,   which
                                                                                              comprises Fund Management and Lodging to
                                                                                              sharpen focus, accelerate growth, and unlock
                                                                                              shareholder value
Notes:
1. Investment values based on agreed property value (100% basis) or purchase/investment consideration
2. Divestment/transfer values based on agreed property value (100% basis) or sales consideration
                                                                                                                                                               4
Operational
Performance

              Singapore Science Park
1Q 2021 Business Updates – Operational Performance

      Continued Recovery for Overall Portfolio
       Albeit at varied pace across geographies
                           AUM1: S$137.7 Billion                                                        India:
                                                                                                        • Severe second wave of COVID-19 in                        China:
                                                                     Residential, Commercial
                                                                     Strata & Urban
                                                                                                          India resulted in stricter mobility                      • COVID-19 pandemic effectively
                                                    Business Park,
   Other Emerging         Other Developed
                                                    Industrial &     Development                          restrictions.                                              contained, boosted by rapid
      Markets4                Markets2
                                                    Logistics6                                          • The Group’s business parks have                            vaccine rollout across the country.
                    10% 16%                                   16% 8%                                      remained operational, although the                       • Commercial activities largely
                                                                                 Retail                   physical use continues to be in the                        rebounded to pre-pandemic levels.
                                                                           27%
                                                                                                          range of 5-10% of the tenant                             • Progress is reflected in the recovery
                                      Singapore
              42%             32%                         28%                                             community on site.                                         of CapitaLand’s full suite of
                                                                                                        • Overall portfolio occupancy level                          businesses in China.
     China3                                    Lodging5              21%
                                                                                                          remained stable (>90%). Healthy office
                                                                      Office
                                                                                                          rent collections at 98%7 in 1Q 2021,
                                                                                                          similar to pre-COVID level.                                              Vietnam:
                                                                                                                                                                                   • International Monetary
                                                                                                                                                                                     Fund projected 6.5%
International:                                                                 Singapore:                                                                                            GDP8 growth,
• USA multifamily assets as well as                                            • Entered Phase 3 re-opening in Dec 2020; GDP growth of                                               indicating optimism in
   commercial assets in Japan enjoyed                                             4-6% projected for 20219.                                                                          Vietnam’s recovery
   strong occupancies through 1Q 2021.                                         • A spike in COVID-19 community cases at the end of April                                             from COVID-19
• Overall portfolio remains resilient.                                            caused tighter measures to be re-enforced in May.                                                • Residential housing
                                                                               • The Group expects operational performance in Singapore                                              market expected to
                                                                                  to remain stable although recently tightened measures                                              recover further in 2021
                                                                                  may impact shopper traffic.                                                                      • The Group’s focus is to
                                                                               • Residential development may also be tempered by                                                     secure new residential
                                                                                  increasing construction costs.                                                                     projects.

Notes: All figures are as of 31 Mar 2021 unless otherwise stated     4.    Excludes China
1. Refers to the total value of real estate managed by               5.    Includes multifamily and hotels
    CapitaLand Group entities stated at 100% of property             6.    Includes data centres
    carrying value                                                   7.    Collection status as of 16 Apr 2021
2. Excludes Singapore and Hong Kong                                  8.    According to World Economic Outlook Report Apr 2021
3. Includes Hong Kong                                                9.    According to Ministry of Trade and Industry Singapore press release dated 15 Feb 2021                                               6
1Q 2021 Business Updates – Operational Performance

  Residential Performance
  1Q 2021 performance shows significant rebound YoY
                                                                                                                              Key Takeaways
                               1,333                                          441                               •     Number of units sold in 1Q 2021
                                                                                                    1Q 2021
  Number of                                              Number of                                                    increased almost 4-fold in Singapore
                                                                                                    1Q 2020           and 3 times in China compared to the
  Units Sold                                            Units Handed                                                  same period a year ago. Returned units
                                                             Over                                                     situation also eased in Vietnam
                                                                                                                •     Sales value for Singapore and China
                      408                                                                                             increased correspondingly
                                                                     132                      137               •     Singapore projects Sengkang Grand
            81                                                                                       94               Residences and One Pearl Bank sold
                                                                                                                      96.8% and 92.9% of launched units
    21
                                         -48    -8                                                                    respectively
                                                                                                                •     China is expected to launch >3,000 units
                                                                                                                      over the last 3 quarters in 2021
   Singapore           China        Vietnam                            China                  Vietnam
                                                                                                                •     While YoY handover numbers improved
                                RMB                                                                                   across China and Vietnam for 1Q 2021,
                               4,024.0                                                                                they were lower on a QoQ basis
 Sales Value                                            Handover                     RMB
                                                                                    2,309.0
    (‘M )                                               Value (‘M)                                              •     ~6,200 units sold with a value of
                                                                                                                      ~RMB12.1bn expected to be handed
                   RMB                                                                                                over from 2Q 2021 onwards in China
                   869.0                                                                                        •     ~612 units sold with a value of ~S$218M
         S$138.2                                                                                                      expected to be handed over from 2Q
                                                                     RMB
                                                                     340.0                                            2021 onwards in Vietnam
S$31.0                            -S$16.0      -S$1.6                                     S$27.0 S$28.1
                                                                                                              Notes:
                                                                                                              • Charts are not drawn to scale
                                                                                                              • For details, please refer to Pages 30 for Singapore Residential. 32-33
                                                                                                                 for Vietnam Residential and 35-37 for China Residential
 Singapore          China           Vietnam                           China              Vietnam              • Singapore residential sales are based on options issued               7
1Q 2021 Business Updates – Operational Performance

    Retail Performance
    Recovery trajectory heads towards pre-COVID levels
                                          YoY recovery levels on an upwards trend across the quarters
                                                                      1Q 2021 vs 1Q 2020                                                                              1Q 2021 vs 1Q 2020
   Shopper Traffic1 (YoY)                                                                           Tenants’ Sales1,2 (YoY)
                                                                               69.4%
                                                                                                                                                                                56.4%
        Singapore         China          Malaysia                                                             Singapore           China          Malaysia

                                                                                                                                                                                4.6%
                                                                                         0                                                                                              0
 -10.8%
   1Q 2020        2Q 2020           3Q 2020           4Q 2020            1Q 2021                    -4.2%
                                                                                                      1Q 2020                -19.0%
                                                                                                                         2Q 2020              3Q-15.0%
                                                                                                                                                 2020       4Q 2020        1Q 2021
                                                     -32.0%                     -26.6%                  -11.8%                -19.1%            -17.0%        -13.8%           -12.4%
                      -42.4%            -38.0%
    -20.9%                                                                                                                                       -31.0%       -17.6%
                                        -42.4%                             -34.0%
                                                        -40.1%                                                                -42.0%                          -22.0%
     -51.0%            -45.0%           -41.0%          -42.7%
                      -45.4%                                                                             -57.0%

                                                 •   China retail registered increase in shopper traffic and tenants’ sales YoY in 1Q 2021, largely owing to
Committed                                            increased consumer optimism with the rapid COVID-19 vaccine roll-out as well as a series of initiatives such
occupancy rate (%)3
                                                     as the distribution of shopping coupons by the Chinese government to stimulate domestic consumption

                        97.2                     •   Singapore retail shopper traffic and tenants’ sales showed marked improvement in 1Q 2021, following
                                                     Singapore phase 3 reopening on 28 Dec 2020
                                                 •   Although facing downward pressure from Malaysia’s continued nationwide movement control order
              90.7
                                                     (MCO), both shopper traffic and tenants’ sales are holding steady
                                 87.6
                                                 •   Notwithstanding the gradual improvement in shoppers traffic and tenant sales, rental reversions have
                                                     remained largely muted across our retail markets
                                                     Notes:
                                                     1. Quarters stated in the chart vs their respective quarters in the previous years
         China       Singapore     Malaysia          2. Change in tenants’ sales per sqm (for China) and sq ft (for Singapore and Malaysia)
                                                     3. As of 31 Mar 2021                                                                                                                   8
1Q 2021 Business Updates – Operational Performance

 Workspace Performance
 Overall resilient ⚫ Proactive leasing and asset management to meet new workspace demands

 •   Committed occupancy1 for offices,                                    Updates on on-                                    Construction progress on track for projects under development
     business parks, industrial and logistics                                                                                                                     CapitaSpring on track to complete in
                                                                          going workspace
                                                                                                                                                           •
     have remained resilient                                                                                                                                      2H 2021

                                                                          projects
 •   51.3% of Singapore portfolio office                                                                                                                   •      50% committed occupancy with
                                                                                                                                                                  another 15% under advance
     community have returned to their
                                                                                                                                CapitaSpring                      negotiation as of 15 Apr 2021
     workplace as of the week ended 16 Apr
     2021                                                                                                                                                      Build-to-suit business park development
                                                                                   Ongoing asset enhancements to complete in 2021                              for Grab, Singapore
 •   Average rental reversions mostly positive                                      Six Battery Road, Singapore                                                • Estimated to complete in 3Q 2021
     across the geographies in 1Q 2021, even                                        • Revised target completion in end 2021
     in India despite a recent resurgence in                                        • Leasing in tandem with phased works                                                  The Workshop @ Bukit Merah
     COVID-19 infections                                                            • Maintained BCA Green Mark Platinum                                                   • Ascendas Reit’s third flexible
                                                                                    21 Collyer Quay, Singapore                                                               workspace location launched
 •   Maintained stable weighted average
                                                                                    • 7-Year lease to WeWork targeted to commence in                                         in Apr 2021 at Pacific Tech
     lease expiry across our key workspace
                                                                                      4Q 2021                                                                                Centre, Singapore
     markets through proactive engagements
     with our tenants                                                               • Achieved BCA Green Mark Platinum

Offices                                                Business Parks, Industrial & Logistics
Committed occupancy rate (%)1                          Committed occupancy rate (%)1
                                                                                                98.6
                                     98.7
                           95.5                 95.4                                   94.9
                   91.1
           84.2                                                                                        92.5
                                                                                                               91.3
                                                                       89.1
                                                                               87.2
                                                                                                                              Notes:
                                                                                                                              1.   As of 31 Mar 2021
                                                                                                                              2.   Refers to Singapore Grade A office buildings only, including 79 Robinson Road
                                                                                                                              3.   Refers to the 32 logistics properties and 5 suburban office properties owned by Ascendas Reit
                                                                                                                              4.   Refers to the 38 logistics properties and 11 data centres owned by Ascendas Reit
                   2                                                  China               Singapore           Australia 3     5.   Refers to the 28 business park properties and 2 office properties owned by Ascendas Reit
 China    Singapore    Japan      South Korea     Germany             Europe 4            USA 5               India                                                                                                                9
1Q 2021 Business Updates – Operational Performance

Lodging Performance
Recovery momentum gradually builds up across markets ⚫ Operating platform
maintains positive cashflow
                                                                                          • ~1,800 units turned operational YTD 2021, bringing the
                    •   RevPAU stable QoQ                                                   total operational units to 70,846
   Singapore        •   Supported by government contracts, staycations and bookings
                        by those affected by border closure                               • >2,800 new units secured via management contracts YTD
                                                                                            2021
                    •   RevPAU +5% QoQ
   SE Asia &                                                                              • On track to meet 2023 target of 160K units under
                    •   Sequential improvement in Australia, Philippines, Indonesia and
  Australasia                                                                               management with currently >123K units under
                        Thailand
                                                                                            management

                    •   RevPAU -11% QoQ
                    •   Lower occupancy due to seasonal lull for corporate travel and            Overall 1Q 2021 RevPAU decreased by 28% YoY
     China                                                                                         but remained relatively stable QoQ (-5%)
                        advisory against travel during Lunar New Year
                    •   Recovery momentum has continued since March 2021                       Revenue per Available Unit (RevPAU) S$
                                                                                              115                                              110
                    •   RevPAU -16% QoQ mainly due to lower occupancy                               97
   North Asia       •   Movement restrictions continued to impact demand in Japan                                                   88                      93
                                                                                                                             73                                  77     76
                        and South Korea                                                                    68
                                                                                                                        55                                                   55
                                                                                                                                         46
                    •   RevPAU -9% QoQ                                                                          37                                   37
                    •   Lockdown measures in various countries due to resurgence
                        during the winter
     Europe
                    •   Long stays, corporate, student and cultural group bookings           Singapore    SE Asia &     China     North Asia   Europe     Gulf Region   Total
                        mitigated impact                                                                  Australia               (ex China)               & India
                                                                                                         (ex S'pore)
                    •   Uptick in demand in UK as restrictions ease from April 2021
                                                                                                                       1Q 2020                 1Q 2021
                                                                                            Note:
  Gulf Region       •   RevPAU +7% QoQ                                                      RevPAU statistics are on same store basis and include serviced residences
   & India          •   Long stays and higher occupancy across several countries            leased and managed by the Group. Foreign currencies are converted to
                                                                                            SGD at average rates for the relevant period
                                                                                                                                                                                  10
1Q 2021 Business Updates – Operational Performance
Fund Management Performance
YoY fee related earnings (FRE) rises on the back of REITs Fund AUM (FUM) expansion
• >30% YoY increase in 1Q 2021 fee income, driven by higher transactional activities due to improved
market sentiments
• S$1.6bn or 2% growth in FUM from FY 2020 mainly due to acquisitions made by listed and private vehicles
Fee Income1 by Quarter FUM by Geography and Equity
FUM by Year (S$’Bn)
(S$’M) Sources (S$’Bn)
306.2 PE Funds
293.2 32.8 2% QoQ
0.9 REITs & BTs
88.8 27.1
104.7
71.1 Q4 19.3
100.0
Q3 2.6
86.8 21.8 31.9 77.6 79.2
69.9 Q2
Q1
52.1 16.7
76.5 99.8
49.6 5.3
FY 2019 2 FY 2020 YTD Mar 21 China Singapore Others 3 2020 YTD Mar 21 2024 Target
Notes:
1. Includes fee-based revenue earned from consolidated REITs before elimination at Group level
2. Includes contribution from ASB for the period from 1 Jul to 31 Dec 2019 11
3. Others include Malaysia, Vietnam, other Asia, Europe and USA1Q 2021 Business Updates – Operational Performance
1Q 2021 Total Fee Income Rose By 9% YoY
Mainly driven by increase in REIT and private fund management fees corresponding to
FUM growth during the quarter
1Q 2020 1Q 2021
Others2
Others2
13%
18% REIT
Management3 REIT
30% Management3
Serviced 35%
Residence
Serviced Management
Residence 16%
Management Total Fee Income1: Total Fee Income1:
16% S$186.7 Million S$203.6 Million
Private Fund
Management3
10% Property
Property Management
Project Private Fund
Management 23%
Management Project Management3
24% 2% Management 12%
1%
Notes:
1. Includes fee-based revenue earned from consolidated REITs before elimination at Group level
2. Mainly include general management fees, leasing commission, HR services, MIS, accounting and marketing fees
3. Includes acquisition/divestment fees
12YTD Real Estate
Transactions
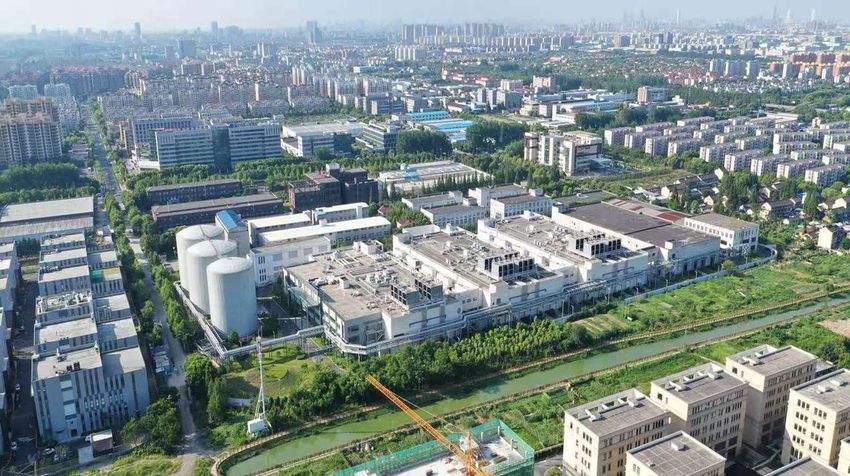
Data Centre Campus, Minhang, Shanghai1Q 2021 Business Updates – YTD Real Estate Transactions
Focused and Disciplined Expansion of New
Economy Exposure
~S$2.6bn of combined investments across the Group in new economy assets1 YTD ⚫
Tripled portfolio allocation to data centres (DC) with two large-scale acquisitions
CapitaLand’s Maiden DC Investment in China
• Announced RMB3.66bn (~S$757.7M) acquisition of a hyperscale DC
campus in Minhang, Shanghai in April 2021
• Asia-Pacific’s largest and world’s second largest DC market
• The fully-fitted campus consists of four buildings with a GFA of up to
75,000 sqm and IT power capacity of up to 55 megawatts
• Potential for rental upside when asset stabilisation and potential
expansion enhancements for Building 4 are completed
What it means for CapitaLand
Acquisition of A Portfolio of 11 DCs
in Europe by Ascendas Reit 1. New economy assets1 RE AUM2 increased
by ~S$2.4bn since 4Q 2020
• Announced acquisition of a portfolio of 11 quality Gyroscoopweg, Amsterdam
DCs located across Europe for S$904.6M in March (Netherlands)
2021 2. Almost S$1.7bn of new DC investments
made, via Ascendas Reit and CapitaLand
• Well-located in Tier 1 cities such as London in UK,
Amsterdam in Netherlands, Paris in France and
Geneva in Switzerland
Notes:
• London, Amsterdam and Paris are ranked 1st, 3rd 1. Includes business park, logistics, industrial and DC assets
Croydon, London (UK)
and 4th largest colocation markets in Europe 2. Refers to the total value of real estate managed by CapitaLand Group entities stated at
100% of property carrying value 141Q 2021 Business Updates – YTD Real Estate Transactions
YTD Investments Closes in On S$3 billion
YTD Investments1,2
Value
Transacted Investments Entity (Buyer)
S$ million
1.65 million sq ft of an IT Park at Hebbal in Bangalore,
268.2 a-iTrust
India3
aVance 6, HITEC City in Hyderabad, India 92.0 a-iTrust
Galaxis, Singapore
Industrial facility at Mahindra World City in Chennai, India 3 38.3 a-iTrust
72.4 acres of land at Farrukhnagar in National Capital Ascendas India
16.4
Region, India Logistics Fund
Paloma West Midtown (formerly Signature West Midtown)
129.7 ART
in Atlanta, USA
A Portfolio of 11 Data Centres in Europe 904.6 Ascendas Reit A two-storey Croydon in London, UK,
one of the 11 Data Centres acquired
Announced Data centre campus in Shanghai, China 757.7 CapitaLand
post 1Q 2021
75% stake in Galaxis 540.0 Ascendas Reit
Total Gross Investment Value4 2,746.9
Notes:
1. Announced transactions from 1 January to 11 May 2021
2. The table includes assets acquired by CapitaLand and CapitaLand REITs/Business Trusts/Funds
3. Signed conditional Share Purchase agreements for acquisition of properties. Completion of acquisition is subject to fulfilment of certain Conditions
Precedent. Figures indicated are estimated purchase considerations based on certain pre-agreed formula aVance 6, HITEC City, Hyderabad, India
4. Investment values based on agreed property value (100% basis) or purchase/investment consideration
151Q 2021 Business Updates – YTD Real Estate Transactions
YTD Capital Recycling On Track
YTD Divestments/Transfers1,2
Value
Transacted Divestments Entity (Seller)
S$ million
Citadines City Centre Grenoble, France 13.0 ART
Somerset Xu Hui Shanghai, China 215.6 ART Somerset Xu Hui Shanghai, CapitaMall Minzhongleyuan,
China Wuhan, China
11 Changi North Way, Singapore 16.0 Ascendas Reit
4.57 acres of land in OneHub Chennai, India 1.1 CapitaLand
ICON Cheonggye in Seoul, South Korea 166.43 CapitaLand
CapitaMall Minzhongleyuan in Wuhan, China 93.4 CLCT
ICON Cheonggye, Seoul,
Announced Galaxis, Singapore
post 1Q 2021 75% stake in Galaxis 540.0 CapitaLand South Korea
• Divested at an agreed
Total Gross Divestment Value4 1,045.5 • Announced divestment of
property value
75% stake in Galaxis to
Ascendas Reit on 4 May, KRW136.3bn (~S$166.4M),
based on agreed property implying 27% above
value of S$720M (100% projected development
basis) which is above expenditure
valuation • Net gains: ~S$33M5
Notes:
• Net gains: ~S$75M • CapitaLand6 remains as
1. Announced transactions from 1 January to 11 May 2021
2. The table includes assets divested/transferred by CapitaLand and CapitaLand REITs/Business Trusts/Funds • Ascendas Reit will convene the fund and asset
3. Property value based on an as-is development-in-progress basis an EGM to approve the manager
4. Divestment/transfer values based on agreed property value (100% basis) or sales consideration transaction • Completed in Jan 2021
5. Based on effective stake of 98.8%
6. Licensed asset manager, Ascendas Asset Management Company, is a subsidiary of CapitaLand
16Financial
Highlights
Capital Tower, SingaporeFinancial Highlights
Balance Sheet Remains Resilient
Proactive capital management to ensure sustainable growth
Another Sustainability-linked loan secured
Resilient balance sheet
within the Group
› Well-equipped with S$14.8 billion in total Group cash Debt Headroom › Ascendas India Trust (a-iTrust) secured maiden
and available undrawn facilities of CapitaLand’s 0.70x S$100 million sustainability-linked five-year loan
treasury vehicles S$1.8 bn debt from UOB
headroom
› Net Debt-to-Equity at 0.65x corresponds to nearly ❖ A two-tier incentive mechanism where
S$1.8 billion of implied debt headroom for potential a-iTrust is entitled to an interest rate
liquidity needs and underwrite growth opportunities reduction when predetermined sustainability
0.65x
› Well-managed debt maturity profile of 3.5 years Net performance targets are met
D/E
› 2021 refinancing mostly in place ❖ The proceeds to be used for general
› Interest coverage ratio1 at 1.1x corporate and working capital requirements,
› Overall implied interest rate is lower at 2.8% as of 1Q including refinancing existing borrowings, the
2021 redevelopment of properties, acquisitions,
capital expenditure or asset enhancement
works
64% 0.34x S$4.18 S$4.38 S$2.4bn Total raised YTD Mar 2021
Fixed Rate Debt Net Debt/Total Asset2 NTA per share NAV per share
Total sustainable financing
Notes: S$744M3
1. On run rate basis. ICR is 5.2x (excluding non-cash revaluations and impairments) raised YTD Mar 2021
2. Total assets exclude cash
3. Including Off B/S sustainable financing raised by Associates and JVs
18Financial Highlights
Prudent Management of Look-through Debt
As of 31 Mar 2021
On Balance Sheet Off Balance Sheet
Net Debt (1) /Equity
0.65 0.62 (4) 0.67
0.53 0.58
0.44
(5) (6) (7)
CL Group On B/S On B/S (excl. REITs) (2) REITs (3) JVs/Associates Funds Off B/S REITs
Net Debt (1) /Total Assets (8)
0.34 0.36 0.37
0.29 (4) 0.31
0.23
(3) (5)
CL Group On B/S On B/S (excl. REITs) (2) REITs JVs/Associates Funds Off B/S REITs (7)
Well-managed balance sheet
Notes:
1. Debt includes Lease Liabilities and Finance Lease under SFRS (I)16. (On B/S : S$1,042 M , Off B/S : S$615 M)
2. Proforma without SFRS (I)10 (excludes REITs Net Debt, includes CL’s share of REITs Equity)
3. The Group consolidated Ascott Residence Trust (ART), CapitaLand Integrated Commercial Trust (CICT), CapitaLand Malaysia Mall Trust (CMMT) and CapitaLand China Trust (CLCT) under SFRS (I)10
4. 65% of the debt in JVs/Associates is from ION Orchard, Jewel Changi Airport, Raffles City Changning (Shanghai, China) ), Datansha (Guangzhou, China) and Hongkou Plaza (Shanghai, China)
5. JVs/Associates exclude investments in Lai Fung Holdings Limited
6. JVs/Associates’ equity includes shareholders’ loans
7. Off B/S REITs refer to i) Ascendas Reit and ii) Ascendas India Trust
8. Total assets exclude cash 19Financial Highlights
Well-managed Maturity Profile1 2of 3.5 Years
Plans in place for refinancing / repayment of debt due in 2021
S$B Total Group cash
16.0 balances and available
undrawn facilities of
14.0
CapitaLand's treasury
12.0 vehicles:
10.0
8.0 6.9
~S$14.8 billion
6.4 6.7
6.0
3.8
4.0 2.9 3.2
1.6 1.4
2.0 2.1 0.7
0.0 0.8
2021 2022 2023 2024 2025 2026 2027 2028 2029+
On balance sheet debt 2 due in 2021 S$’ billion Total
To be refinanced 2.0 Non-REIT level debt
3
To be repaid 0.9 REIT level debt
Total 2.9
As a % of total on balance sheet debt 9%
Well equipped with ~S$14.8 billion in cash and available undrawn facilities
Notes:
1. Based on the put dates of the convertible bonds
2. Debt excludes S$1,042 million of Lease Liabilities and Finance Lease under SFRS(I)16
3. Ascott Residence Trust (ART), CapitaLand Integrated Commercial Trust (CICT), CapitaLand Malaysia Mall Trust (CMMT) and CapitaLand China Trust (CLCT)
20Financial Highlights
Disciplined Interest Cost Management
%
5.0
4.0
3.7
3.5
3.4
3.3 3.2
3.2 3.2
3.0
3.0
2.8
Implied Interest Rate
2.0
1.0
2 3
FY 2013 FY 2014 FY 2015 FY 2016 FY 2017 FY 2018 FY 2019 FY 2020 YTD Mar 2021
(Restated)
Implied interest rates 1 kept low at 2.8%
Notes:
1. Implied interest rate for all currencies = Finance costs before capitalisation/Average debt
2. Implied interest rate for all currencies before restatement was 4.2%
3. Straight annualisation 21Proposed
Restructuring of
CapitaLand
Limited (Recap)
Ascent, Singapore Science ParkProposed Restructuring of CapitaLand Limited (Recap: As Announced on 22 March 2021)
Strategic Move to Sharpen Focus and Illuminate
Value in Key Growth Pillars 3 strategic growth pillars
Fund Management
Lodging
Development
The Group’s investment
management platforms and
lodging business are proposed to
be consolidated into “CapitaLand
CapitaLand Investment Management (CLIM)
Investment Management” (CLIM),
Fund Management Lodging
which is to be listed by introduction
on the Singapore Exchange (SGX); • Asset and capital efficient
and Public • Scalability through FRE and Fund AUM FUM growth
• Full stack investment and operating capabilities
CapitaLand Development
Development
Private
• Asset and capital intensive
The real estate development
• Development of longer gestation projects and incubation
business of the Group is
proposed to be placed of new businesses requiring patient capital
under private ownership, to • Full stack development and project management
be fully held by CLA Real
capabilities
Estate Holdings (CLA)Proposed Restructuring of CapitaLand Limited (Recap: As Announced on 22 March 2021)
CapitaLand Group’s Valuable Ecosystem Will Be
Preserved
✓ Multi-sector development capability
✓ Long-term asset pipeline
✓ Incubator for new businesses
✓ Capital and investment partner
• Strategic arrangements for asset recycling and
co-investment opportunities
Development Investment
• Shared services Management
✓ Asset management services
• Able to access to development
via funds
• Able to widen network of capital
and development partners
24Proposed Restructuring of CapitaLand Limited (Recap: As Announced on 22 March 2021)
Shareholder Resolutions To Be Approved
• All inter-conditional
• CLA will abstain from voting at both the EGM and Scheme Meeting
Shareholder resolutions Approvals thresholds Indicative timeline
EGM 22 March
• Announcement of transaction
Approve capital reduction to:
• Distribute CLIM shares to Eligible
Shareholders In or around 3Q 2021
• Distribute 6.0% CICT Units to Eligible ✓ At least 75% of shares • Despatch of Scheme document,
Shareholders voted opinion of Independent Financial
Adviser, CLIM introductory document,
CLA will not participate in the distribution of EGM and Scheme Meeting notice
CICT Units, and its share will be distributed to
Eligible Shareholders
SCHEME MEETING In or around 3Q 2021
• EGM and Scheme Meeting
✓ At least 75% of shares
voted
Approve Scheme In or around 4Q 2021
• Transfer of CapitaLand shares to CLA ✓ >50% in headcount • Completion – listing of CLIM and
(present and voting at delisting of CapitaLand
the EGM)
Note: The timeline above is indicative only and subject to change
25Conclusion
• CapitaLand’s first quarter trading performance demonstrated the Group’s ongoing operating resilience,
as we emerged from the COVID-19 pandemic into a gradual recovery.
• The Group’s balance sheet remains strong, with S$14.8bn of cash and available undrawn facilities and a
healthy net debt-to-equity ratio of 0.65 times. This will continue to support our recovery and growth.
• As part of CapitaLand’s 3.0 strategy, the Group proposed a strategic restructuring to sharpen its strategic
focus and unlock sustainable value for shareholders on 22 March 2021.
• Following the initial announcement, we are preparing to release a Scheme document and an
Introductory document and convene Shareholders’ meetings to seek shareholders’ support in the second
half of 2021.
• In the meantime, the proposed transaction is not expected to affect the day-to-day business activities
and ongoing operations of CapitaLand and our listed REITs/BTs.
• We will continue our business as usual, and will retain our focus on our capital recycling discipline, pivoting
towards new economy asset classes, growing fee income streams via Fund Management and Lodging, as
well as proactively future proofing our operations to ensure their relevance post-COVID.
• Importantly, we remain committed to the goals set out in CapitaLand’s 2030 Sustainability Master Plan to
embed sustainability into every stage of our real estate life cycle. This will be our strategic blueprint to
pursue profitable business growth in a responsible manner.
Note:
1. It is currently contemplated that CapitaLand’s Shareholders will be receiving a scheme document and introductory document in or around 3Q 2021, with full information on the proposed
restructuring and the details of the Extraordinary General Meeting and Scheme Meeting that we will call to seek Shareholders’ approval
26Supplemental
Information:
1. Key Operational Statistics
2. Proposed Restructuring of
CapitaLand
Ascendas Xinsu Square, Suzhou, China1. Supplemental Information – Key Operational Statistics
Overall Diversified Portfolio Remained Resilient
4% Growth in RE AUM QoQ ⚫ Diversified businesses have kept concentration risks low
RE AUM1: S$137.7 Billion Total Assets: S$84.1 Billion
Other Emerging
Other Emerging Other Developed Other Developed
Markets5
Markets5 Markets2 Markets2
10% 16% 6% 13%
By
Geography
36%
42% 32% China4
45%
China4 Singapore Singapore3
Residential, Corporate
Business Park, Commercial Strata & Residential,
& Others Commercial Strata
Industrial & Logistics7 Urban Development Business Park,
Industrial & Logistics7 & Urban Development
5%
By 16% 8%
9% 14%
Asset Class Retail Lodging6
27% 15%
Lodging6 28% 32%
Retail
21% Office 25%
Office
Notes: All figures are as of 31 Mar 2021 unless otherwise stated
1. Refers to the total value of real estate managed by CapitaLand Group entities stated at 100% of property 4. Includes Hong Kong
carrying value 5. Excludes China
2. Excludes Singapore and Hong Kong 6. Includes multifamily and hotels
3. Includes corporate & others 7. Includes data centres 281. Supplemental Information – Key Operational Statistics
Singapore, Malaysia and Indonesia
(SMI) Residential Sales1,2
As of 31 Mar 2021
81 units worth S$138.2 million sold in Singapore in 1Q 2021
Sales status as of 31 Mar 2021
Total Units Units % of launched
Markets
units launched sold units sold
Singapore 1,454 830 786 94.7%
Malaysia 837 837 767 91.6%
Indonesia 96 96 43 44.8%
SMI Total 2,387 1,763 1,596 90.5%
Notes:
1. Figures might not correspond with income recognition
2. Sales figures are based on options issued / bookings made excluding abortive units 291. Supplemental Information – Key Operational Statistics
SMI1 Investment Properties Performance
Retail Business Park, Industrial & Logistics
As of 31 Mar 2021 Singapore Malaysia As of 31 Mar 2021 Singapore
No. of operating malls2 19 7 No. of operating properties 102
Committed occupancy rate3 97.2% 87.6% Committed occupancy rate 87.2%
Shopper traffic growth (1Q 2021 vs 1Q 2020)4 -26.6% -34.0% Weighted average lease expiry9 (years) 3.5
Tenants’ sales growth (1Q 2021 vs 1Q 2020)4 +4.6% -12.4% Average rental reversion10 (1Q 2021) 2.3%
Office5
As of 31 Mar 2021 Singapore
No. of operating Grade A offices5 6
Notes:
Committed occupancy rate6 91.1%
1. Singapore, Malaysia and Indonesia
2. Portfolio includes properties that are operational as of 31 Mar 2021 and includes
NPI yield on valuation7 3.8%
properties managed by CapitaLand Group
3. Committed occupancy rates as of 31 Mar 2021 for retail components only
NPI 8 (S$ mil) 83.8
4. Comparison on same-mall basis which compares the performance of the same set of
property components open/acquired prior to 1 Jan 2020
NPI change (1Q 2021 vs 1Q 2020)(100% basis) 13.7%
5. Includes five operating offices owned by CICT and 79 Robinson Road
6. Committed occupancy rate as of 31 Mar 2021 and includes 79 Robinson Road
7. NPI yield on valuation is based on annualised 1Q 2021 NPI and valuation as of 31 Dec
2020
8. Figure is on 100% basis, with the NPI of each property taken in its entirety regardless of
CapitaLand’s effective interest
9. Calculated based on balance of lease term of every lease weighted by annual rental
income
10. Calculated based on average signing gross rent of the renewed leases divided by
preceding average signing gross rent of current leases. For the period Jan to Mar 2021,
weighted by area renewed and for multi-tenant buildings only
301. Supplemental Information – Key Operational Statistics
Vietnam Residential Sales1,2
As of 31 Mar 2021
• No new launches scheduled in 1Q 2021. Limited selections left for balance unsold launched units
• Due to delays in securing permits for units sold previously, 13 units were returned by buyers, resulting in negative
sales accounted in 1Q 2021
• The returned units will be progressively released for sale at a higher price
• In 1Q 2021, there were 4 new units sold in project D1mension
Sales status as of 31 Mar 2021
4,547
Total Units Units % of launched
Markets
units launched sold2 units sold
Ho Chi Minh City 972 754 491 65.1%
Hanoi 1,300 1,300 1,298 99.8%
Vietnam Total 2,272 2,054 1,789 87.1%
Notes:
1. This list only shows current projects with available units for sale during the reported period. Figures might not correspond with income recognition
2. Sales figures are based on options issued made, netting off abortive units
311. Supplemental Information – Key Operational Statistics
Vietnam Residential Handover Volume and Value
As of 31 Mar 2021
50
150 1Q 2021: ~0.7x YoY 1Q 2021: ~1.4x YoY
Handover Value (S$ million)
40
125
Residential Units
100 30
75
137 20 38
50 94 28
10
25
0 0
1Q 2020 1Q 2021 1Q 2020 1Q 2021
Future Revenue Recognition
• ~612 units1 sold with a value of ~S$218 million2 expected to be handed over from 2Q 2021 onwards
• ~32% in value expected to be handed over in the next nine months of 2021
Notes:
1. Above data is on 100% basis
2. Value excludes value added tax and impact due to significant financing component for certain payment schemes under accounting principles IFRS 15
321. Supplemental Information – Key Operational Statistics
International Investment Properties Performance
Retail Business Park, Industrial & Logistics
As of 31 Mar 2021 Japan As of 31 Mar 2021 1Q 2021
No. of operating properties1 2 Weighted
No. of Committed
average lease Average rental
Committed occupancy rate2 99.3% operating occupancy
expiry5 reversion6
properties rate
(years)
Shopper traffic growth (1Q 2021 vs 1Q 2020)3 -17.9%
Australia
Tenants’ sales growth (1Q 2021 vs 1Q 2020)3 -11.8%
Logistics 32
Office Suburban 94.9% 4.0 -
5
South Germany offices
As of 31 Mar 2021 Japan
Korea Europe
No. of operating properties1 4 2 2 Logistics 38
98.6% 6.2 -
Committed occupancy rate4 95.5% 96.7% 95.4% Data centres 11
United States
Multifamily
Business
30 92.5% 4.9 6.2%
As of 31 Mar 2021 United States park/Offices
No. of operating properties 16 Notes:
1. Portfolio includes properties that are operational as of 31 Mar 2021
Committed occupancy rate 94.5% 2. Committed occupancy rate as of 31 Mar 2021 for retail components only
3. Comparison on same-mall basis which compares the performance of the same set of
Weighted length of stay (years) 1 property components opened/acquired prior to 1 Jan 2020. Excludes Seiyu & Sundrug due to
no disclosure from tenants
4. Committed occupancy rate as of 31 Mar 2021 for office components only
5. Calculated based on balance of lease term of every lease weighted by annual rental
income
6. Calculated based on average signing gross rent of the renewed leases divided by preceding
average signing gross rent of current leases. For the period Jan to Mar 2021, weighted by
area renewed and for multi-tenant buildings only
331. Supplemental Information – Key Operational Statistics
China Residential Sales
Residential sales value in 1Q 2021 increased 4.6x YoY on higher launches
1Q 2021: ~3.3x YoY 1Q 2021: ~4.6x YoY
1,500
Sales Value (RMB million)
4,000
Residential Units
3,500
1,000 3,000
2,500
1,333 2,000 4,024
500 1,500
1,000
408 500 869
0 0
1Q 2020 1Q 2021 1Q 2020 1Q 2021
Notes:
1. Above data is on a 100% basis, including strata units in integrated development and considers only projects being managed
2. Value includes carpark, commercial and value added tax
341. Supplemental Information – Key Operational Statistics
China Residential Sales1
As of 31 Mar 2021
Over 3,000 units ready to be released in China for the next 9 months
Total Units % of launched
Markets Units sold1
units launched units sold
Beijing 922 740 389 52.6%
Guangzhou 10,220 4,148 3,807 91.8%
Shanghai 169 168 168 100%
Tier 1 Total 11,311 5,056 4,364 86.3%
Chengdu 7,714 7,478 7,467 99.9%
Chongqing 3,524 1,673 982 58.7%
Ningbo 180 180 142 78.9%
Wuhan 2,246 2,246 2,246 100%
Xian 27,517 22,748 22,724 99.9%
Tier 2 Total 41,181 34,325 33,561 97.8%
Kunshan 5,745 5,744 5,733 99.8%
Tier 3 Total 5,745 5,744 5,733 99.8%
Total 58,237 45,125 43,658 96.7%
Note:
1. Sales figures of respective projects are based on options issued made, netting off abortive units 351. Supplemental Information – Key Operational Statistics
China Residential Handover
As of 31 Mar 2021
600
1Q 2021: ~3.3x YoY 1Q 2021: ~6.8x YoY
2,500
Value (RMB million)1,2
Residential Units1
2,000
400
1,500
2,309
441 1,000
200
500
132
340
0 0
1Q 2020 1Q 2021 1Q 2020 1Q 2021
Future Revenue Recognition
• ~6,200 units sold1,3 with a value of ~RMB12.1 billion4 expected to be handed over from 2Q 2021 onwards
• ~46% of value expected to be recognised over the next 9 months5
Notes:
1. Above data is on a 100% basis, including strata units in integrated developments and considers only projects being managed
2. Value includes carpark and commercial
3. Units sold include options issued as of 31 Mar 2021
4. Value refers to value of residential units sold including value added tax
5. Subject to construction progress of the projects
361. Supplemental Information – Key Operational Statistics
China Investment Properties Performance
Retail Business Park, Industrial & Logistics
As of 31 Mar 2021 As of Mar 2021 YTD Mar 2021
No. of operating malls1 43
No. of Weighted
Committed
Targeted no.2 of malls to be opened in 2021 1 operating average lease Average rental
occupancy
properties7 expiry8 reversion
rate
Committed occupancy rate3 90.7% (years)
Shopper traffic growth (1Q 2021 vs 1Q 2020)4,5 69.4%
Business Park 8 88% 19.6%
Tenants’ sales growth (1Q 2021 vs 1Q 2020)4,5 56.4% 2.0
Industrial &
2 93% 8.4%
Logistics
Office Notes:
1. Portfolio includes properties that are operational as of 31 Mar 2021
2. Opening targets relate to the retail components of integrated developments and properties
As of 31 Mar 2021
managed by CapitaLand Group
3. Committed occupancy rates as of 31 Mar 2021 for retail components only
No. of operating properties1 23 4. Comparison on same-mall basis which compares the performance of portfolio with the same
set of property components opened/acquired prior to 1 Jan 2020
No. of properties under development 4 5. Excludes one master-leased mall. Tenants’ sales from supermarkets and department stores are
excluded
6. Based on committed occupancy for stabilised projects as of 31 Mar 2021. Stabilised projects
Committed occupancy rate6 84.2% include offices in Raffles City Shanghai, Raffles City Changning, Capital Square, Hongkou,
Minhang, Innov Center, Pufa Tower, Ascendas Plaza, Ascendas Innovation Plaza, Raffles City
Average rental reversion (1Q 2021) -2.5% Ningbo, Raffles City Hangzhou, Suzhou Center, Raffles City Beijing, Tianjin International Trade
Centre, Raffles City Shenzhen, Raffles City Chengdu, CapitaMall Tianfu, CapitaMall Xindicheng,
One iPark, CapitaMall Westgate, Raffles City Chongqing and Y-Town. Office leasing
momentum is stepping up in new project - Raffles City The Bund in Shanghai
7. Xinsu portfolio comprises of Xinsu - Industrial (Industrial & Logistics) and Xinsu- R&D (Business Park)
8. Calculated based on balance of lease term of every lease weighted by occupied leasable
area
371. Supplemental Information – Key Operational Statistics
India Investment Properties Performance
As of 31 Mar 2021
Portfolio
Number of operating Committed Weighted average lease expiry1
parks occupancy rate (years)
IT Park 9 90.1% 4.2
Logistics Park 3 96.3% 5.4
International Tech Park Bangalore International Tech Park Pune International Tech Park Chennai
38
Note:
1. Calculated based on balance of lease term of every lease weighted by average gross rent1. Supplemental Information – Key Operational Statistics
Lodging Portfolio
• 70,846 operational units and 52,907 pipeline units
• On track to achieve 160,000 units by year 20231
Real estate platform Operating platform
3rd Party
REIT/fund TAL Franchised Leased Total
Managed ROE-accretive model
Singapore 1,560 - 172 2,005 307 4,044 with >80% units under
SE Asia & Australasia (ex SG) 5,260 1,424 12,098 24,571 160 43,513 management
contracts and
China 1,234 200 34 31,490 - 32,958
franchise deals
North Asia (ex CN) 3,196 - 342 884 649 5,071
Europe 3,770 478 690 923 821 6,682
Deepening presence
Others 1,004 717 210 4,318 - 6,249 and building scale in
Serviced Apartments 16,024 2,819 13,546 64,191 1,937 98,517 key gateway cities
Longer-stay Properties2 1,700 433 - 830 33 2,996
TAUZIA - - 186 20,045 - 20,231 Growing recurring fee
Subtotal 17,724 3,252 13,732 85,066 1,970 121,744 income through
Synergy - - - - - 2,009
various avenues of
growth
123,753
Notes: Figures above as of 31 Mar 2021
1Includes properties units under development
2Comprising 2,813 corporate leasing / rental housing units, and 183 student housing units with 525 beds 391. Supplemental Information – Key Operational Statistics
Diversified Portfolio Of Funds
One of Asia’s leading real estate fund managers with 23 private funds and 6 listed trusts
No. Fund Name Fund size
(million)1 Listed REITs/Business Trusts Market Cap3
1 CapitaLand Mall China I ncome Fund US$ 900
(As of 31 Mar 2021) (S$ Billion)
2 CapitaLand Mall China I ncome Fund I I US$ 425
CapitaLand Integrated Commercial Trust 14.0
3 CapitaLand Mall China I ncome Fund I I I S$ 900
4 CapitaLand Mall China Dev elopment Fund I I I US$ 1,000
5 Ascott Serv iced Residence (Global) Fund US$ 600 Ascendas Real Estate Investment Trust 12.7
6 Raffles City China I ncome Ventures Limited US$ 1,180
7 Raffles City Changning JV S$ 1,026 Ascott Residence Trust 3.3
8 CapitaLand Tow nship Dev elopment Fund I US$ 250
9 CapitaLand Tow nship Dev elopment Fund I I US$ 200
10 CapitaLand Mall I ndia Dev elopment Fund S$ 880
CapitaLand China Trust 2.1
11 Raffles City China I nv estment Partners I I I US$ 1,500
12 CapitaLand Vietnam Commercial Value-Added US$ 130 Ascendas India Trust 1.7
13 CREDO I China US$ 556
14 CapitaLand Asia Partners I (CAPI ) and Co-inv estments US$ 510
CapitaLand Malaysia Mall Trust 0.4
15 Ascendas China Commercial Fund 3 S$ 436
16 Ascendas I ndia Grow th Programme I NR 15,000
17 Ascendas I ndia Logistics Programme I NR 20,000 Total 34.2
18 Ascendas Korea Office Priv ate REI T 1 KRW 85,100
19 Ascendas Korea Office Priv ate REI T 3 KRW 107,500
20 Ascendas Korea Office Priv ate REI T 4 KRW 57,500
21 Ascendas Korea Office Priv ate REI T 5 KRW 64,062
22 Athena LP S$ 88
Notes:
2
23 Korea Data Centre Fund I KRW 116,178 1. Fund size as of respective fund closing date
2. Management contract with no CapitaLand stakes
Total Fund Size S$ 14,078 3. As of 31 Mar 2021 market close. Source: Bloomberg 401. Supplemental Information – Key Operational Statistics
FY 2020 Key Figures (Recap)
EBIT PATMI (Operating) PATMI
Revenue EBIT
S$231.5M Operating
S$769.9M PATMI
S$(1,574.3M)
PATMI
S$6,532.6M S$231.5M S$769.9M S$(1,574.3M)
Note:
1. Comprised reduction in operating costs (vs. FY 2019 adjusted for ASB acquisition) and deferral of discretionary capital expenditure
412. Supplemental Information – Proposed Restructuring of CapitaLand Limited (Recap: As Announced on 22 March 2021)
Proposed Transaction
Strategic restructuring to be carried out through Scheme of Arrangement
Current Structure(1) Post-transaction Structure(1)
CLA Real Estate Eligible CLA Real Estate Eligible
Holdings (“CLA”) Shareholders Holdings (“CLA”) Shareholders
51.8%(2) 48.2%(2)
100.0%
51.8%(2)
48.2%(2)
(Listed on SGX) (Privately held)
100.0%
100.0% 100.0% 100.0%
Fund
Development Lodging Development
Management Investment Management
(Listed on SGX)
Investment Management (CLIM)
Note:
(1) Illustrating relevant entities only 42
(2) Based on current shareholdings as of 19 Mar 20212. Supplemental Information – Proposed Restructuring of CapitaLand Limited (Recap: As Announced on 22 March 2021)
Implied Consideration of S$4.102 for Eligible
Shareholders
S$0.158(2),(3),(4)/CICT Unit
8% CICT Eligible Shareholder’s pro-rata entitlement 0.075 CICT Units
Units S$0.170(2),(3),(4)/CICT Unit
Offeror’s entitlement distributed in favour of the Eligible Shareholders of 0.080 CICT Units Implied CLA
consideration:
S$1.121
representing
23% 0.95x
Cash S$0.951(5) Cash Consideration
pro-forma
NAV(8)
S$4.102(1)
CLIM S$2.823(6),(7) NAV/share
69% 1 CLIM share
Note: Eligible Shareholders exclude CLA
(1) Based on current share capital of 5,202,962,608 as at 19 Mar 2021. Assuming conversion of all outstanding convertible bonds, vesting of awards between Joint Announcement Date and Scheme Effective Date and estimated number of
ordinary shares to be issued as payment of director fees, fully diluted shares outstanding will be 5,409,995,696. In such case, Eligible Shareholders will receive the following for every 1 CapitaLand share: (a) 1 CLIM share at NAV per share of
S$2.715, (b) S$0.951 in cash, (c) 0.071 CICT Units (representing CLA’s share of DIS of CICT Units distributed to Eligible Shareholders) valued at S$0.151, based on CICT’s 1M VWAP of S$2.122/share as at 19 Mar 2021, (d) 0.072 CICT Units
distributed to Eligible Shareholders valued at S$0.152, based on CICT’s 1M VWAP of S$2.122/share as at 19 Mar 2021
(2) The number of CICT Units which each CapitaLand Eligible Shareholder shall be entitled to pursuant to the Scheme shall be rounded down to the nearest whole number, and fractional entitlements shall be disregarded
(3) 388,242,247 CICT Units divided by 5,202,962,608 total CapitaLand shares as at 19 Mar 2021. CLA will not participate in the DIS of CICT Units and CLA’s share of DIS of CICT Units will be distributed to Eligible Shareholders as part of the
Scheme
(4) Based on CICT’s 1M VWAP of S$2.122/share as at 19 Mar 2021
(5) The aggregate Cash Consideration that is payable by CLA to any Eligible Shareholder as at the Record Date in respect of the shares held by such Eligible Shareholder will be rounded down to the nearest whole cent
(6)
(7)
Based on CLIM’s pro-forma NAV of S$14.7B as at 31 Dec 2020, adjusted for transaction costs. CLIM is valued at 1x NAV for illustrative purpose to determine Implied Consideration
Based on 5,202,962,608 CapitaLand shares outstanding as at 19 Mar 2021 43
(8) Based on CapitaLand Development’s adjusted pro-forma NAV of S$6.1B, as at 31 Dec 2020, adjusted for transaction costs and FY 2020 dividends declaredSupplemental Information
CapitaLand’s Share Price Performance
1 Jan 2021 to 31 Mar 2021
Price (S$) 26 Mar 2021: Highest
closing price achieved
3.90 as at 31 Mar 2021
3.85
3.80
23 Mar 2021: First trading 3.75
day after announcement of
3.70 proposed restructuring of
CapitaLand Limited
3.60
3.50
3.40
3.28
3.30
22 Mar 2021: Announced
proposed restructuring of
3.20 CapitaLand Limited
3.10 3.10
3.00
31 Dec 2020 16 Jan 2021 1 Feb 2021 17 Feb 2021 5 Mar 2021 21 Mar 2021
Note:
1. Dividend yield is calculated as the sum of dividend per share amounts that have gone ex over the past 12 months divided by the stock price as of 23 Apr 2021
44Thank You
For enquiries, please contact Ms Grace Chen, Head, Investor Relations
Direct: (65) 6713 2883 Email: grace.chen@capitaland.com
CapitaLand Limited (https://www.capitaland.com)
168 Robinson Road #30-01 Capital Tower Singapore 068912
Tel: (65) 6713 2888 Fax: (65) 6713 2999 Email: groupir@capitaland.comYou can also read