CNS Monitoring Uranium Mining and Milling in China and North Korea through Remote Sensing Imagery
←
→
Page content transcription
If your browser does not render page correctly, please read the page content below
CNS
 OCCASIONAL PAPER
                         Monitoring Uranium Mining
                         and Milling in China and
  #40 · OCTOBER 2018     North Korea through Remote
                         Sensing Imagery
Melissa Hanham, Grace Liu, Joseph Rodgers,
Mackenzie Best, Scott Milne, and Octave Lepinard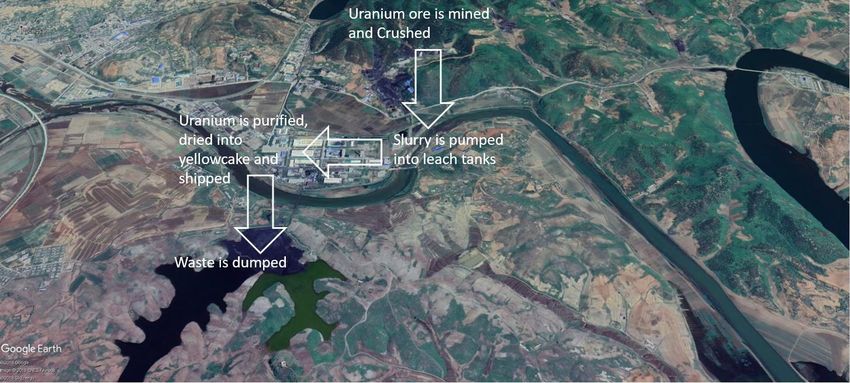
James Martin Center for Nonproliferation Studies
                                             nonproliferation.org

The James Martin Center for Nonproliferation Studies (CNS) strives to combat the spread of weapons of mass
destruction by training the next generation of nonproliferation specialists and disseminating timely information and
analysis. CNS at the Middlebury Institute of International Studies at Monterey is the largest nongovernmental
organization in the United States devoted exclusively to research and training on nonproliferation issues.

                          Middlebury Institute for International Studies at Monterey
                                                 www.miis.edu

The Middlebury Institute for International Studies at Monterey provides international professional education in areas
of critical importance to a rapidly changing global community, including international policy and management,
translation and interpretation, language teaching, sustainable development, and nonproliferation. We prepare
students from all over the world to make a meaningful impact in their chosen fields through degree programs
characterized by immersive and collaborative learning, and opportunities to acquire and apply practical professional
skills. Our students are emerging leaders capable of bridging cultural, organizational, and language divides to produce
sustainable, equitable solutions to a variety of global challenges.

                                 James Martin Center for Nonproliferation Studies
                                   Middlebury Institute of International Studies
                                                460 Pierce Street
                                           Monterey, CA 93940, USA
                                             Tel: +1 (831) 647-4154
                                             Fax: +1 (831) 647-3519

                                                     Disclaimer

The views, judgments, and conclusions in this report are the sole representations of the authors and do not
necessarily represent either the official position or policy or bear the endorsement CNS or the Middlebury Institute
of International Studies at Monterey.

                                                Acknowledgements

The researchers would like to thank the MacArthur Foundation for their support, and Dr. Will Amidon for his
expertise and insight.

© The President and Trustees of Middlebury College, 2018

Cover image: Uranium mine near Kaesong, North Korea. Credit: Google Earth 2018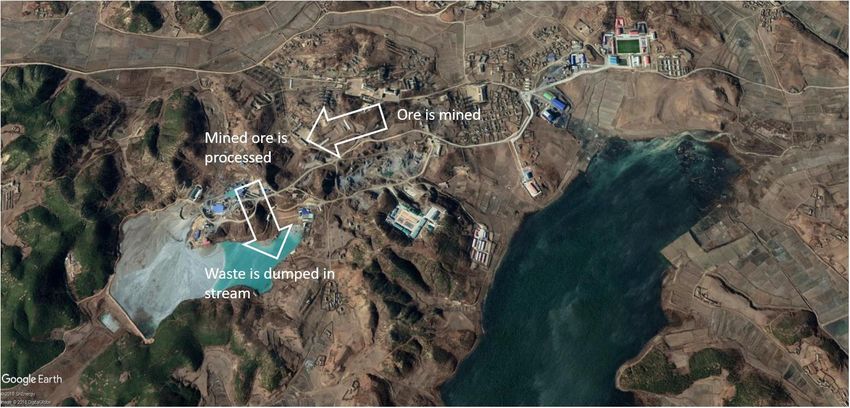
Monitoring Uranium Mining and Milling in China and North
         Korea through Remote Sensing Imagery

              James Martin Center for Nonproliferation Studies

    Melissa Hanham, Grace Liu, Joseph Rodgers, MacKenzie Best, Scott Milne,
                             and Octave Lepinard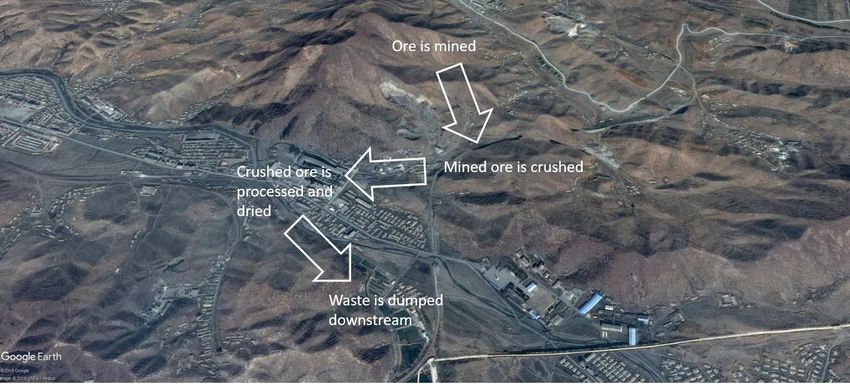
Introduction

Although uranium mining and milling constitute the first step in any nuclear-weapons program,
nuclear nonproliferation analysts have devoted surprisingly little attention to monitoring these
processes. Understanding and monitoring uranium mines and mills can provide deeper insight into
fissile-material production. This report focuses on the insights gleaned from remotely sensed images
of known Chinese uranium mines and mills to understand the current status of uranium mining and
milling in North Korea. Significantly, this report quantitatively estimates uranium production at
North Korea’s declared uranium mine and identifies three potential, previously undetected North
Korean uranium mines and mills.

Most of the available data about North Korea’s uranium mining comes from its declarations in the
1992 Comprehensive Safeguards Agreement (CSA) with the International Atomic Energy Agency
(IAEA). North Korea declared two uranium mines and two mills in 1992, but researchers have long
speculated that North Korea operates other undeclared uranium facilities.

In contrast to North Korea, China regularly reports its uranium-extraction activities to the IAEA,
which are published on a biannual basis by the IAEA and the Organisation for Economic
Cooperation and Development’s (OECD) Nuclear Energy Agency in what are colloquially known as
the “Red Books.” The uranium-production industry in both states have Soviet-assisted origins,
which may allow China’s history of reporting uranium production to serve as a control measure in
determining the feasibility of the North Korean projections.

Satellite Imagery as an Open-Source Verification Measure

Satellite imagery can enhance IAEA safeguards inspectors’ ability to identify active uranium
mines and mills and estimate throughput. Satellite imagery can provide inspectors with more
data for “complementary access” requests and help determine whether the request, under
Additional Protocol Article 4.a.(i), is necessary. The Additional Protocol (AP) requires adhering
states to allow the IAEA access to all facilities at a nuclear site, sometimes on short notice, in
response to the presence of undeclared nuclear material or to “resolve inconsistencies” between
the declared and actual amounts of nuclear materials.1 However, it is difficult to identify, let
alone resolve, an inconsistency without first accurately verifying the uranium-production levels
as reported by the state—information that is necessary to determine whether the state may be
diverting undeclared materials into a clandestine nuclear-weapons program. In addition to
satellite imagery, official national publications, import and export data, and other open-source
reports can also inform inspectors.

1 “IAEA  Safeguards Overview,” International Atomic Energy Agency, n.d.,
https://www.iaea.org/publications/factsheets/iaea-safeguards-overview; R. Leslie, P. Riggs, V. Bragin, Q.S.
Bob Truong, R. Neville, and K. Staenz, “Satellite Imagery for Safeguards Purposes: Utility of Panchromatic
and Multispectral Imagery for Verification of Remote Uranium Mines,” Paper Presented to Annual Meeting
of the Institute of Nuclear Materials Management, Orlando, Florida, 23–27, June 2002, p. 4.

                                                                                                              1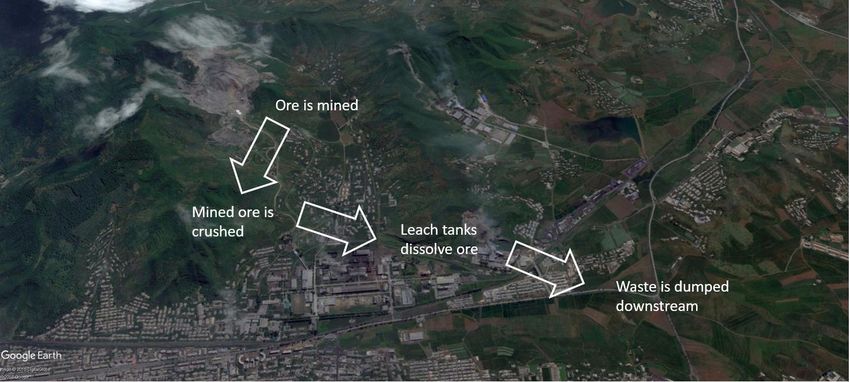
The existing and publicly available literature on China’s uranium exploration can serve as a control
variable to ultimately estimate uranium production and assess mining capabilities in North Korea.
Because China is a state party to the 1968 Treaty on the Non-Proliferation of Nuclear Weapons and
reports detailed information to the IAEA, the location of China’s uranium mines and mills and their
production levels are known.
Significant insights can be extracted from analyzing satellite images of these sites, which can provide
estimates of production levels. Researchers at the European Safeguards Research and Development
Association (ESARDA) created a formula that integrates these optical signatures to estimate throughput.
The precision of the formula or the validity of Chinese declarations can be tested, and researchers can
then apply this formula to estimate throughput of suspected uranium mines and mills in North Korea.
Applying Satellite Imagery in Practice
Different types of remotely sensed data can provide varying insights for uranium mines and mills.
The patterns detected in optical satellite imagery of China’s uranium mines and mills can be used to
more accurately assess potential mines and mills in North Korea. Optical signatures include tailings
piles, waste ponds, buildings, and equipment necessary for uranium processing. The presence of
such signatures can provide more compelling evidence that the site may be involved in uranium
mining or production. Thermal imagery can determine the recency of changes in tailings piles and
ponds by displaying heat signatures of these areas—e.g., “hotter” signatures indicate recent activity.
Additionally, multispectral signatures could potentially identify uranium-bearing ores or differentiate
between mined ore and tailings piles.
Hyperspectral imagery of Chinese sites can be especially useful in comparing suspected uranium
mines and mills in North Korea; analyzing the unique spectral signatures of uranium-bearing ore
from a known uranium mine or mill in China could populate a database to measure against
signatures from suspected uranium-mining sites in North Korea. Unfortunately, hyperspectral
imagery from the Hyperion (EO-1) satellite, the only publicly available, space-based hyperspectral
sensor, is unavailable for Chinese sites. This limits the data available to create spectral signatures for
known Chinese mines and mills.
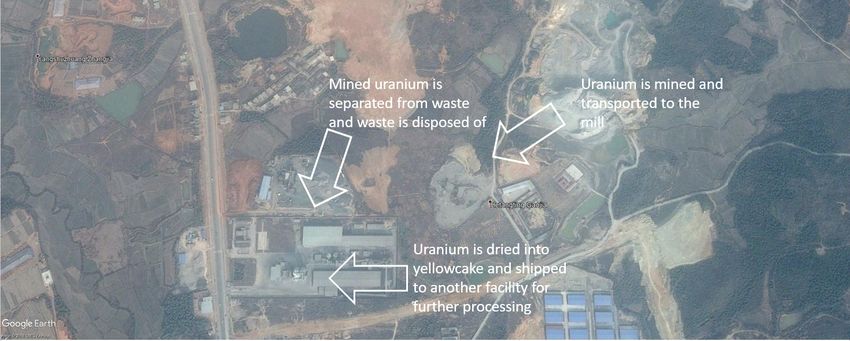
The Uranium Mining and Milling Process
Uranium is generally mined using one of three different methods:
• Open-pit mining
• In situ recovery
• Underground mining
Of the three different approaches, open-pit mining is the most easily identifiable through satellite
imagery. Open-pit mining is employed when the ore body is close to or at the surface, and this method
2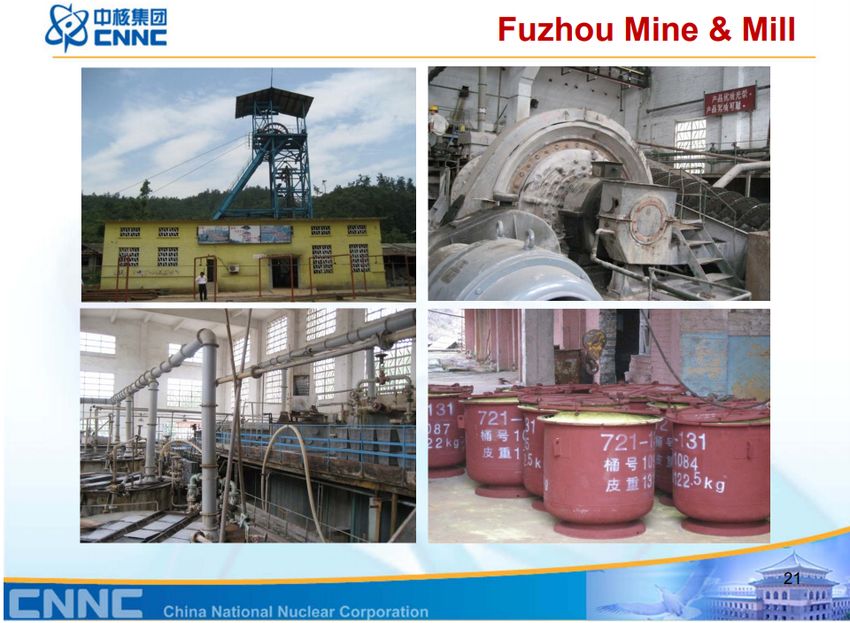
is commonly used for metal mines such as copper and iron, as well as for large, high-grade uranium
deposits. In situ recovery dissolves uranium underground using a groundwater solution, which is then
pumped back to a processing plant. This technology is difficult to spot and identify using optical
satellite imagery because it primarily takes place underground, utilizes fewer pieces of equipment, and
results in minimal surface disruption. Underground uranium mines are either vertical shafts, horizontal
adits, or ramped declines. Spotting entrances to underground mines can be very difficult using only
optical satellite imagery. However, material from underground operations is often brought to the
surface by a large conveyor-belt system, which can be identified using satellite imagery.

While each of the three different approaches contains unique identifiers that can be detected via
satellite imagery, differentiating between a mine that produces uranium or another metal is often
difficult. Copper, uranium, and other base metal mines share much of the same equipment and
technology, and therefore appear similar in satellite imagery.

After uranium has been mined in open pits or underground, the ore is crushed to create more
surface area and to facilitate the liberation of uranium. This process often takes place very close to
the mine. After reaching the desired particle size, water is added to the crushed ore and thickened in
a counter-current decanter (CCD). This step suspends the particles in a slurry. This slurry is then
sent to flotation tanks, where other chemicals are added to separate elements by density and filter
out impurities before the slurry is sent on to the leach tanks. In the leach tanks, acid is added to
dissolve the uranium out of the rock. While most uranium ores are leached with acid, alkaline
leaching is used for certain ore types. Waste is removed and disposed of in tailings ponds, and the
uranium is set out to precipitate and dry. After drying, the uranium, in the form of “yellowcake,” is
packaged and shipped to a processing facility. Mills do not need to be physically close to mines, as
crushed ore can easily be shipped to other sites for processing. However, tailings ponds will always
be found close to mills as they are direct results of ore beneficiation and processing, and there is no
need to pump them far away from the plant.

China
China is a relatively large consumer and producer of uranium resources among the world’s nuclear-
capable countries. As of 2015, China domestically operates twenty-three civilian nuclear reactors that
supply 2.4 percent of its national energy production.2 China’s most recent strategic Five-Year Plans
have called for an increased focus on developing nuclear energy, including more than doubling its 2014
nuclear capacity of 20 GWe to 58 GWe by 2020.3 This ambitious goal has led China to become the
world’s leading constructor of new nuclear reactors, with more than 18 under construction as of 2018.4
China has pursued opportunities internationally to augment its uranium resources, carrying out

2 Nuclear Energy Agency (NEA) and International Atomic Energy Agency (IAEA), “Uranium 2016:
Resources, Production and Demand,” (OECD, 2016), p. 85.
3 Hui Zhang and Yunsheng Bai, “China’s Access to Uranium Resources,” Belfer Center Project on Managing

the Atom (Cambridge: Harvard, 2015),
https://www.belfercenter.org/sites/default/files/legacy/files/chinasaccesstouraniumresources.pdf; NEA and
IAEA, “Uranium 2016,” pp. 85, 202.
4 Mark Hibbs, “The Future of Nuclear Power in China,” Carnegie Endowment for International Peace, May

14, 2018, https://carnegieendowment.org/2018/05/14/future-of-nuclear-power-in-china-pub-76311.

                                                                                                            3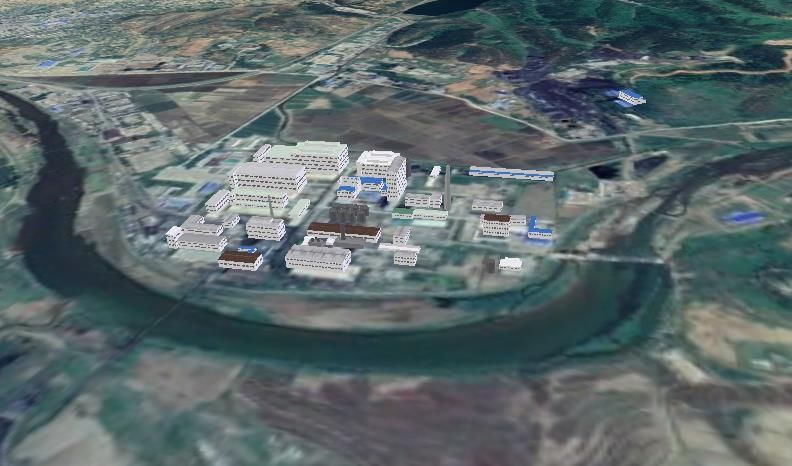
exploration projects in locations such as Australia and Namibia, and buying uranium on the
international market. Additionally, China is said to have been stockpiling uranium since at least 2007.5

Given China’s large and growing demand for uranium, China’s economic planners will likely
continue to expand its domestic uranium-mining operations. China currently operates 13 mines and
six mills, with estimated domestic uranium resources of 366,200 tons of uranium (tU) as of 2016, the
most current numbers available.6 This 2016 estimate is already a 46 percent increase over China’s
estimated resources in 2009 (171,400 tU),7 and this number is likely to climb as China has yet to
evaluate vast swathes of territory with potential uranium deposits, especially in Inner Mongolia.8
China has yet to realize the full potential of its uranium resources and will likely continue to establish
mines and mills.

Brief History

China established its domestic uranium industry in tandem with its nuclear-weapons program in 1955
and built its first uranium mines and mills by 1958.9 China sought to rapidly develop its atomic-energy
capabilities in the 1950s, diverting thousands of workers and students into training and staffing its
nascent nuclear industry, with significant assistance from Soviet experts.10 The following decades saw a
rapid rise in China’s nuclear capabilities: the highly enriched uranium in the country’s first nuclear test
in 1964 was domestically sourced, and China’s annual drilling activity reached a peak of 1,550,000
meters in 1970.11 Military demand fueled China’s three-decade sprint to create and accelerate its
nuclear industry. However, as China’s leaders began to prioritize civilian economic and political reform
in the early 1980s, China’s demand for uranium decreased and its nuclear industry retracted.12

The 1990s were a period of financial difficulty for China’s uranium industry.13 Due to cost concerns,
China began favoring deposits in north/northwest China amenable to less expensive in situ leaching
techniques instead of large-scale “hard rock” mining operations. The 2000s saw a sharp increase in
uranium exploration and mining investment that continues to this day, as China’s government has
articulated an increasing demand for nuclear energy. Drilling increased from a low of 40,000 meters

5 David Stanway and Kathy Chen, “China to Boost Nuclear Fuel Reserves to Feed New Reactors,” Reuters,
March 10, 2016, https://www.reuters.com/article/us-china-uranium-idUSKCN0WD0D7; Zhang and Bai,
“China’s Access to Uranium Resources,” p. x; NEA and IAEA, “Uranium 2016,” p. 203.
6 NEA and IAEA, p. 204. This estimate includes Reasonably Assured Resources, or resources known to exist

in deposits that can be economically extracted.
7 Susan Hall and Margaret Coleman, “Critical Analysis of World Uranium Resources,” U.S. Scientific

Investigations Report 2012–5239 (USGS, 2013), p. 45.
8 NEA and IAEA, “Uranium 2016,” p. 207. Exploration in northern Inner Mongolia focuses on sandstone-

hosted sites, while exploration projects in southern China focus on volcanic- and granite-type deposits.
9 Zhang and Bai, “China’s Access to Uranium Resources,” p. 12.
10 “Chinese Communist Party Central Committee Circular concerning the Transfer of Cadres and Workers to

Participate in Atomic Energy Development Work (Excerpt),” April 23, 1956, History and Public Policy
Program Digital Archive, Woodrow Wilson Center for International Scholars,
https://digitalarchive.wilsoncenter.org/document/114335.
11 Zhang and Bai, “China’s Access to Uranium Resources,” p. 12.
12 Ibid., p. 13.
13 NEA and IAEA, “Uranium 2016, p. 202.

                                                                                                           4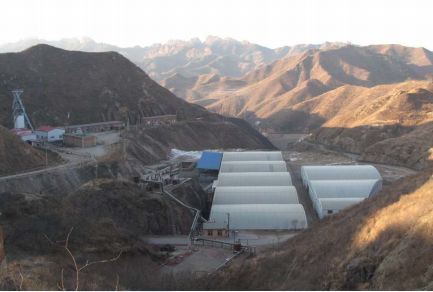
in 2000 to 140,000 meters in 2004; in 2014 alone, China completed 850,000 meters of new drilling.
Most of the new exploration will likely take place in northern China.14

                 Image 1. Fuzhou Mill and uranium ore heaps. Source: China National Nuclear Cooperation.

Estimating Uranium Production in Conventional Uranium Mills

In a paper published by ESARDA, Lalitha Sundaresan of the National Institute of Advanced Studies
in Begaluru, India, and her colleagues produced an equation to estimate the production capacity of a
uranium mill using optical satellite imagery. The equation uses the number of CCD units, the diameter
of the CCDs in a mill, and the average ore grade of the mill. While not perfect, the equation gives a
reasonable estimate of the mill’s production capacity. The equation in exponential form is:

14   Ibid., pp. 202–03.

                                                                                                           5
G N A
P=k*a *b *c
Where k = constant; G = ore grade in percentage; N = number of CCDs; A = area of the CCD in
meters square.15
China reports its uranium production to the IAEA, making it possible to compare this equation’s
estimates with China’s declarations. China has reported that its two largest mills, Yining and Fuzhou,
produce 380 tU/year and 350 tU/year, respectively. The Fuzhou uranium mill is a conventional mill,
so it is possible to estimate its production using the ESRADA equation. Scientific publications
indicate that the average uranium ore grade at this mill is .05 percent.16 The equation estimates that
the mills produce 239 tU/year and 249 tU/year. As there are no visible CCDs in satellite imagery,
these estimations assume that there are four CCD units at Fuzhou, each measuring 25m in diameter,
which is the average diameter of a typical CCD unit. In this case, China’s declared production and
the equation’s estimate are reasonably similar.
Fuzhou Mill, 27.922512, 116.428894. Source: Google Earth.
15Lalitha Sundaresan, Chandrashekar Srinivasan, and Buhpendra Jasani, “Monitoring Uranium Mining and
Milling using Commercial Observation Satellites,” ESARDA Bulletin, December, 2015, http://isssp.in/wp-
content/uploads/2015/08/ESARDA-Paper-corrected.pdf.
16Z. Y. Liu et al., “Origin and Role of Kaolinization in Roll-Front Uranium Deposits and Its Response to
Ore- Forming Fluids in the Yili Basin, China,” Geofluids, April, 2018,
https://www.hindawi.com/journals/geofluids/2018/7847419/; Jinhui Liu, et al. Column Bioleaching
Experiment of Low Grade Uranium Ore from Xiangshan Uranium Deposit. Advanced Materials Research, Vol
825, October 2013, pp. 314–17.
6Democratic People’s Republic of Korea
As part of its 1992 Comprehensive Safeguards Agreement with the IAEA, North Korea declared two
uranium mines and two uranium mills near Pyongsan and Pakchon. In previous work, researchers at
the James Martin Center for Nonproliferation Studies (CNS) geolocated these two operations:17
● Pakchon Uranium Mine and Mill (39°42’34.73″N, 125°34’8.57″E)
● Pyongsan Uranium Mine and Mill (38°19’4.56″N, 126°25’57.43″E)
The Pakchon uranium mine and mill was likely a smaller pilot operation. Optical imagery of the
facility suggests that the site has been non-operational for a number of decades.
However, the Pyongsan mine and mill has undergone significant renovations in recent years.18
Activity at the mine has increased, as evidenced by growing tailings piles observed in optical imagery
and heat visible in thermal imagery. While the production capacity of the Pyongsan mine and mill
has never been publicly disclosed, estimating the mill’s threshold production capacity is possible by
analyzing prominent mill infrastructure visible in optical satellite imagery. The previously noted
equation capacity was created through this approach.
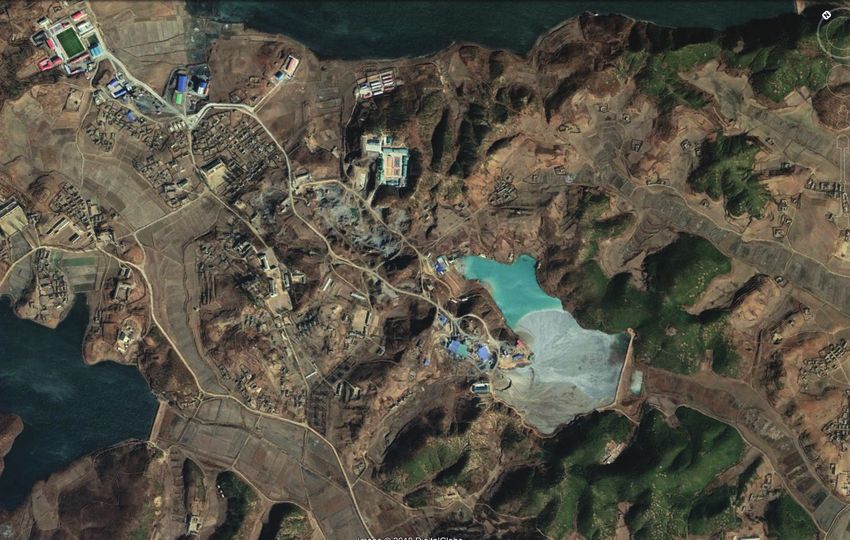
Pyongsan Uranium Mine and Mill, 38.31, 126.43. Source: Google Earth
17 Jeffrey Lewis, “Satellite Imagery: North Korea Expanding Uranium Production,” The Diplomat, August 14,
2015, https://thediplomat.com/2015/08/satellite-imagery-north-korea-expanding-uranium-
production.
18 Ibid.
7Estimating Pyongsan’s Production
The number of CCD units and the uranium ore grade of these sites is not declared, and it is difficult
to determine the exact milling process used to extract uranium ore. Assuming the mill does not use a
heap-leaching process, it is possible to estimate the production of uranium at these mills using the
ESRADA equation. Additionally, optical imagery and historical information give researchers
valuable clues. Optical imagery of the Pyongsan mine shows structures that could house between
two and four CCD units assuming a 25m diameter. The grade of the uranium ore at Pyongsan is
subject to speculation. Multiple open-source analysts cite a single defector who claims that this mine
produces uranium with a grade of roughly 0.8 percent. However, an internal Hungarian memo
written in 1979 claims that North Korea’s two uranium mines, unnamed in the memo, have .26
percent and .086 percent.19 The two mines referenced are likely Pyongsan and Pakchon, given that
North Korea did not likely build new mines or mills between 1979 and 1992. The larger Pyongsan
site is a better candidate for the .26 percent ore figure than Pakchon, since North Korea likely would
have built its larger mine and mill at a site with higher quality ore.
3D model of Pyongsan uranium mine and mill, 38.31, 126.43. Source: Google Earth.
Using the ESARDA equation to estimate Pyongsan’s production yields the following results: two
CCDs processing ore at 0.8 percent would produce an estimated 456 tU/year, while four CCDs
would produce 886 tU/year. If the ore is 0.26 percent, two CCDs would produce an estimated 273
tU/year and four units would produce 529 tU/year. Estimate variations in the number of CCDs
present and the ore’s grade lead to substantial differences in estimated production levels. These
19See “Telegram, Embassy of Hungary in North Korea to the Hungarian Foreign Ministry,” February 17,
1979, as reprinted in Balazs Szalontai and Sergey Radchenko, “North Korea’s Efforts to Acquire Nuclear
Technology and Nuclear Weapons: Evidence from Russian and Hungarian Archives,” Cold War International
History Project, Working Paper #53, Woodrow Wilson International Center for Scholars, August 2006, p. 66,
https://digitalarchive.wilsoncenter.org/document/110133.
8estimates assume that the size of the CCDs at Pyongsan correspond to the average size of CCDs at
other prominent uranium mines found worldwide. Some of the largest uranium operations around
the world use anywhere from six to eight CCD units, which are typically left uncovered. The
Pyongsan operation is not as large as others found worldwide, so an estimate of fewer CCD units,
likely two to four, follows logically.
Suspected Mines
While North Korea declared the Pakchon and Pyongsan uranium mines and mills to the IAEA,
analysts have long suspected that North Korea operates additional domestic uranium-production
facilities. For example, the Nuclear Threat Initiative’s North Korea Facilities Database list 17
suspected uranium mines and mills.20 The US–Korea Institute’s “Overview of North Korea’s NBC
Infrastructure” lists 13 suspected sites.21
After analyzing these suspected facilities, CNS researchers identified three additional sites that
possess optical signatures associated with the two declared uranium mines. These sites are in
Kujang, Sunch’on, and in a facility outside of the Kaesong Industrial Complex previously
unidentified in the open-source literature.
Potential uranium mine and mill near Kaesong, 37.83, 126.59. Source: Google Earth.
With higher-resolution hyperspectral imagery, verifying whether these mines are actually uranium
mines may become possible. However, the only publicly available hyperspectral imagery comes from
20 “North Korea: Facilities,” Nuclear Threat Initiative, updated February 2013,
http://www.nti.org/learn/countries/north-korea/facilities/; “North Korea Facilities Map,” Nuclear Threat
Initiative, n.d., http://www.nti.org/gmap/nuclear_north_korea.html?/.
21 Joseph Bermudez, Jr., “Overview of North Korea’s NBC Infrastructure,” U.S.-Korea InstituteJohns
Hopkins School of Advanced Studies, 2017, https://www.38north.org/wp- content/uploads/pdf/NKIP-
Bermudez-Overview-of-NBC-061417.pdf, p. 26.
9the Hyperion EO-1 satellite and features only 30m spatial resolution, which is not clear enough to
develop hyperspectral signatures that can discriminate from other mining activity.22 At this time, the
limitations of publicly available hyperspectral imagery and the lack of a database of uranium’s
hyperspectral signatures prevents us from definitively assessing these sites as uranium mines and mills.
Suspected uranium mine and mill in Kujang, 39.86, 126.05. Source: Google Earth.
Potential uranium mine and mill in Sun’chon, 39.44, 126.02. Source: Google Earth
22 The EO-1 satellite was decommissioned in 2017.
10Conclusion
Open-source satellite imagery continues to be a useful tool for the discovery and verification of
uranium mines and mills. Multispectral images can help identify mines by revealing mine- specific
waste ponds and zones of heat and activity around certain buildings. Optical imagery can help
estimate the production capacity of mills once key production buildings are identified using the
equation established in the ESARDA paper. This equation can estimate or verify throughput for
declared and undeclared sites.
In China, for instance, the reported Chinese production—350 tU/year—is 101 t/U more than the
estimate calculated using the ESARDA equation: 249 tU/year.
In North Korea, the varying production estimates for Pyongsan are as follows:23
• Two CCDs processing ore at 0.8%U: 456 tU/year
• Four CCDs at 0.8%U: 886 tU/year
• Two CCDs processing ore at 0.26%U: 273 tU/year
• Four CCDs processing ore at 0.26%U: 529 tU/year
Hyperspectral imagery remains an exciting possible tool for identifying uranium mines and mills. But
this potential is unfortunately hampered by the limited amount and poor resolution of hyperspectral
imagery available in open-source data today. Building a database of hyperspectral signatures of
uranium would be a promising development but must be partnered with advancement in the
resolution and quantity of commercially available hyperspectral sensors.
All three potential North Korean mining sites contain equipment necessary for uranium extraction
and production, and all sites bear clues suggesting that they are currently operating. As refined
hyperspectral and multispectral data of these sites becomes available, analysts should further study
them in order to more accurately assess North Korea’s uranium-production capabilities. Continual
monitoring of these sites with high-frequency imagery for vehicle movement, changes at the tailings
pond, and spoil, will continue to be the best option in the near-term.
23The 0.8%U figure comes from a widely-cited defector, and the 0.26%U figure comes from the authors’
inference (see “Estimating Pyongsan’s Production,” above).
11About the Authors
Melissa Hanham is a senior research associate at the James Martin Center for Nonproliferation
Studies (CNS) at the Middlebury Institute of International Studies at Monterey (MIIS). She studies
East Asian security, with particular focus on North Korean WMD capabilities, procurement and
proliferation networks, and China’s nuclear posture. Hanham is an expert on open-
source intelligence, incorporating satellite and aerial imagery, and other remote sensing data, large
data sets, social media, 3D modeling, and GIS mapping. She is particularly focused on the
monitoring and verification of international arms-control agreements using open-source
evidence. She also uses open-source information to study export-control systems and proliferation
finance activities. She is an affiliate of Stanford University’s Center for International Security and
Cooperation. Hanham teaches “Geospatial Tools for Nonproliferation Analysis” at the
Middlebury Institute of International Studies and is a regular contributor to Arms Control Wonk,
the leading blog and podcast on disarmament, arms control, and nonproliferation. In 2018, she
was awarded the Paul Olum Grant Fund for being one of the most inventive scientific and
technical minds working to reduce the threat of nuclear weapons. She previously worked with the
Mixed-Methods, Evaluation, Training & Analysis (META) Lab and the International Crisis Group
in Seoul and Beijing.
Grace Liu is a research associate in the East Asia Nonproliferation Program at CNS. She translates
Korean and Chinese sources, conducts geospatial analysis, and uses 3D-modeling techniques to
assess North Korea’s WMD and ballistic-missile capabilities. Her research focuses on applying
open-source intelligence to verify arms control treaty compliance. Ms. Liu served as an all-
source intelligence officer in the armed forces. She holds a Master’s in Nonproliferation and
Terrorism Studies from MIIS, a Master’s of Business Administration in International Management,
and a Bachelor’s in Military Science from the University of New Mexico.
Joseph Rodgers is a graduate research assistant at CNS and a Master’s Candidate in
Nonproliferation and Terrorism Studies at MIIS. Formerly, he was a visiting research intern at the
United Nations Institute for Disarmament Research, Lawrence Livermore National Laboratory, and
the Arms Control Association. His research applies a variety of technologies to verify global
weapons of mass destruction facilities.
Mackenzie Best is a research assistant with the Department of Geology at Middlebury College
working on this project. She is concurrently a grade control geologist at a high-altitude open pit
copper mine in Espinar, Peru. Beginning in January 2019, she will be a Master of Science student at
the New Mexico Institute of Mining and Technology. She holds a Bachelor’s degree in Geology and
Biology from Middlebury College.
Scott Milne is a graduate research assistant at CNS. His work at the Center focuses on tracking
developments within WMD-capable countries and writing reports for the Nuclear Threat Initiative.
12He is a candidate for a Masters of Arts in Nonproliferation and Terrorism Studies from MIIS and
holds a Bachelor of Arts in History from Hamilton College.
Octave Lepinard is an undergraduate at Middlebury College studying Geology and Computer
Science, with a focus in remote sensing. During the summer of 2018, he was a research assistant at
CNS, where he worked with satellite imagery and various image-processing software to track
developing and growing WMD programs around the world. He also sought to use new technologies
such as hyper-spectral analysis to develop methods for identifying covert uranium mines.
13OCCASIONAL PAPERS AVAILABLE FROM CNS
online at https://nonproliferation.org/category/topics/cns_papers
#40 • Monitoring Uranium Mining #28 • Geo4nonpro.org: A #14 • Nuclear Challenges and
and Milling in China and North Korea Geospatial Crowdsourcing Policy Options for the Next US
through Remote Sensing Imagery Platform for WMD Verification Administration
#39 • Safeguards and Verification in
#27 • Searching for Illicit Dual Use #13 •Trafficking Networks for
Inaccessible Territories
Items in Online Marketplaces: A Chemical Weapons Precursors:
#38 • Geo4Nonpro 2.0 Semi-Automated Approach Lessons from the 1980s Iran-Iraq War
#37 • All the World is Staged: An #26 • 2016 Symposium Findings #12 • New Challenges in Missile
Analysis of Social Media Influence on Export Control of Emerging Proliferation, Missile Defense, and
Operations against US Biotechnologies Space Security
Counterproliferation Efforts in Syria
#25 • Outlawing State-Sponsored #11 • Commercial Radioactive
#36 • North Korea’s Information Nuclear Procurement Programs & Sources: Surveying the Security Risks
Technology Networks Recovery of Misappropriated
#10 • Future Security in Space:
#35 • Countering North Korean Nuclear Goods
Commercial, Military, and Arms
Procurement Networks Through #24 • Strengthening the ROK-US Control Trade-Offs
Financial Measures: The Role of Nuclear Partnership
Southeast Asia #09 • The 1971 Smallpox Epidemic
#23 • Replacing High-Risk in Aralsk, Kazakhstan, and the
#34 • Open-Source Monitoring of Radiological Materials Soviet Biological Warfare Program
Uranium Mining and Milling
for Nuclear Nonproliferation #22 • A Blueprint to a Middle East #08 • After 9/11: Preventing Mass-
Applications WMD Free Zone Destruction Terrorism and
Weapons Proliferation
#33 • WMD Proliferation Risks at #21 • Biotechnology E-commerce: A
the Nexus of 3D Printing and DIY Disruptive Challenge to Biological #07 • Missile Proliferation and
Communities Arms Control Defences: Problems and Prospects
#32 • Taiwan’s Export Control #20 • Countering Nuclear #06 • WMD Threats 2001: Critical
System: Overview and Commodity Smuggling: A System Choices for the Bush
Recommendations of Systems Administration
#31 • Revisiting Compliance in the #19 • Alternatives to High-Risk #05 • International Perspectives on
Biological Weapons Convention Radiological Sources Ballistic Missile Proliferation
and Defenses
#30 • Crowdsourcing Systems and #18 • Stories of the Soviet
Potential Applications in Anti-Plague System #04 • Proliferation Challenges and
Nonproliferation Nonproliferation Opportunities for
#17 • Ugly Truths: Saddam
New Administrations
#29 • The Verification Hussein and Other Insiders on
Clearinghouse: Debunking Iraq’s Covert Bioweapons #03 • Nonproliferation Regimes
Websites and the Potential at Risk
#16 • Rethinking Spent Fuel
for Public Nonproliferation Management in South Korea #02 • A History of Ballistic Missile
Monitoring Development in the DPRK
#15 • Engaging China and Russia
on Nuclear Disarmament #01 • Former Soviet Biological
Weapons Facilities in Kazakhstan:
Past, Present, and Futurewww.nonproliferation.org
You can also read