NEW KIDS ON THE BLOCK: CHINA AS A NEW FORCE IN THE WEALTH-TECH MARKET AUTHOR Cliff Sheng - Oliver Wyman
←
→
Page content transcription
If your browser does not render page correctly, please read the page content below

NEW KIDS ON THE BLOCK:
CHINA AS A NEW FORCE
IN THE WEALTH-TECH MARKET

AUTHOR
Cliff Sheng
Morven Mo
Chris Yang
Sandy Cheng
CONTENTS
Preface ..................................................................................................................... 3

1.    A glance at the wealth-tech market.................................................................... 4

      1.1.      Technologies in wealth management ............................................................ 4

      1.2.      Overview of the wealth-tech market ............................................................. 6

2.    Emergence of China forces ................................................................................. 9

      2.1.      China’s wealth ................................................................................................ 9

      2.2.      China’s tech .................................................................................................. 12

3.    China forces in online securities market ........................................................... 15

      3.1.      Overview of the global online securities market ......................................... 15

      3.2.      Overview of the China online securities market ......................................... 16

      3.3.      Key success factors for offshore online securities trading ........................... 20

Copyright © 2018 Oliver Wyman                                                                                                   2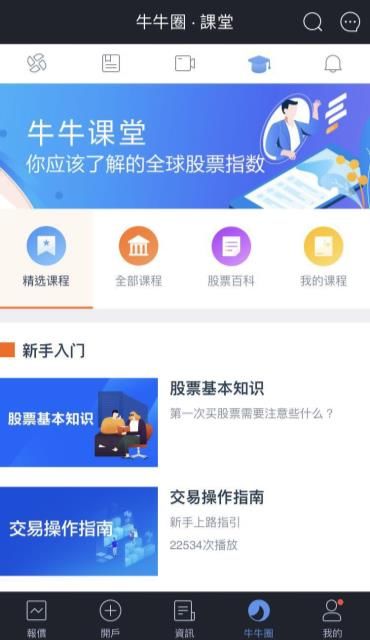
PREFACE
The evolving needs and behaviours of investors, supported by advances in technology, have
created opportunities for both traditional players and new disruptors to reshape the wealth
management industry. In recent years, new companies have offered wealth management solutions
using advanced technologies, including artificial intelligence, big data analysis, cloud computing,
and blockchain. These technologies changed the way in which the wealth management business
operates.

A new segment, wealth-tech, is now on the rise around the world. It focuses on technology-based
solutions and aims to enhance and transform the process and results of retail investment. These
technologies have not only addressed retail investors’ pain points in efficiency and experience, but
also helped wealth managers to lower costs and reach a longer tail of potential customers.

China has seen a significant accumulation of wealth, leading to demand for offshore investment.
In addition, China is becoming a major force in financial technology: It is shaping the wealth-tech
industry of the future and taking it to another level.

Oliver Wyman is publishing this report to analyse the potential impact of China on the wealth-tech
market. It answers the following questions:

1. What and how big is the wealth-tech market?
2. How will China influence the wealth-tech market?
3. How are leading Chinese players reshaping online securities trading?
   What factors will lead to success?

Copyright © 2018 Oliver Wyman                                                                          3
1. A GLANCE AT THE WEALTH-TECH MARKET

1.1. TECHNOLOGIES IN WEALTH MANAGEMENT
Technology has changed the traditional way of wealth management. Retail investors used to
manage their wealth through the traditional means offered by banks and securities firms, so they
suffered from inconvenience, unfavorable experiences, and high fees. For example, the user
interfaces of most banks and securities firms in Hong Kong are based on systems developed for
institutional investors, and they are much less user-friendly for retail investors who want to trade
online. Despite such suboptimal solutions, commissions are relatively high – usually between 0.1
and 0.2 percent. Access to basic market information incurs additional fees.

Now, a wide range of technologies is helping to ease these pain points – in particular, big data,
artificial intelligence, online social networks, and mobile technology and the Internet of things.

Figure 1: Example of application of technologies across wealth management market

                        Online brokerage      Online marketplace     Online              Online wealth
                                              investing              crowdfunding        management
 Big data               • Targeted            • Next product to      • Next product to   • Targeted
                          marketing             invest                 inves               marketing
                        • Stock price                                                    • Product analysis
                          analysis                                                       • Product portfolio
 AI                     • Smart customer      • Fraud                • Smart customer    • Portfolio
                          services              identification         services            optimization and
                        • KYC matching                                                     rebalancing
 Mobile/IoT             • Remote account      • Alternative          • Alternative       • Remote account
                          opening               investment             investment          opening
                        • Alternative           channel                channel
                          investment
                          channel
 Social network         • Virtual community for investors to share information           •

Big Data

Big data offers more-advanced approaches to analyse and use data. It has a range of applications,
from customer analysis and product pricing to risk management. Online financial service platforms
can adopt more-targeted marketing tactics, such as next-product-to-buy (NPTB) suggestions to
increase cross-selling and lead customers to new product offerings. Data can help take risk into
consideration when pricing investment products, so making these platforms more competitive.
Big data analytics can also facilitate the analysis of multiple data sources in order to create credit
profiles. A wider range of data – such as online footprint, Internet use, mobile use, and transaction
channels – can be combined with traditional credit data to generate a more-comprehensive profile
of clients.

Copyright © 2018 Oliver Wyman                                                                                  4
Artificial Intelligence AI applications are increasingly widespread and complex. An online financial service platform can develop intelligent accounts and portfolios for its customers; investor-matching engines to enhance its competitiveness; or strengthen its risk-management systems and tools. In addition, companies can also leverage AI techniques such as facial recognition, which enables precise and timely identity verification, improving the customer experience throughout the investment journey. Mobile Internet The widespread adoption of wealth-tech is not possible without a high penetration of mobile Internet users. The mobile phone has had great success as a means of financial inclusion for Asia’s unbanked population masses. Mobile devices are also playing an important role at the opposite end of the market to mobilize wealth and investment management. With mobile Internet access, wealth managers can offer a completely new investment experience, in which customers can manage their investments easily – both in terms of obtaining advice and of trading and execution. This further increases the efficiency of the capital market. Social Networks It has been hard for investors to find good teachers and peers, but social networks and the investor community are causing rapid change. Investors who are active within that community can help others obtain useful information. In addition, social networks are a way to interact directly with the best investors and to start building a relationship of trust. Moreover, investors who engage in social trading networks can gain an edge by using the so-called wisdom of crowds. Sharing ideas and past experiences helps to increase everyone’s learning curve, and the development of trading literacy can lead to mutual success for all involved. Copyright © 2018 Oliver Wyman 5
1.2. OVERVIEW OF THE WEALTH-TECH MARKET
When wealth meets technology it creates a new market, and wealth-tech developed rapidly in
many countries over the past couple of years. The wealth-tech market can be segmented into the
B2B model, in which technology service providers target institutional customers, and the B2C
model, in which technology-oriented platforms target retail investors to improve their investment
experiences and lower their costs.

In this report, we will focus on the “to C” model of wealth-tech, which can be further segmented
according to type of investment asset – in particular assets that are publicly traded and those that
are not. We have defined four submarkets: online securities trading, online marketplace investing,
online crowdfunding, and comprehensive online wealth management.

Figure 2: Types of wealth-tech

                        PUBLIC MARKET                                          NON-PUBLIC MARKET

               Online                                 Online                             Online
               securities                             marketplace                        crowd
               trading                                investing                          funding

                i.e.   Robinhood                      i.e.   LendingClub                 i.e.   AngelList
                       Ameritrade                            FundingCircle                      Wefunder
                       Futu Securities                       Yirendai                           Renrentou.com
    To C               Huatai Securities                     PPDai                              ANTSDAQ

                                           Comprehensive online wealth management

                                           i.e.   Charles Schwab         Lufax
                                                  Wealthfront            CreditEase

    To B                                                 Technology providers

Copyright © 2018 Oliver Wyman                                                                                   6
The “to C” model consists of online securities trading, with a global transaction volume of
$35 trillion; online marketplace investing, with a volume of $88 billion; online crowdfunding,
at $8 billion; and online wealth management, where $5 trillion of assets are under management.
Between 20 and 65 percent of the volumes in these submarkets are from China.
Figure 3 Global and China wealth-tech market sizes as of 2017
Wealth-tech market, global vs China
Transaction volume, USD 2017
12.7TN 31.0BN 1.6BN
(36%) (35%) (20%)
Online Online
securities marketplace Online
trading investing crowd
funding
22.3TN 56.7BN 6.4BN
(64%) (65%) (80%)
Asset under management, USD 2017
Online wealth
3.9TN (78%) 1.1TN (22%)
management
Global China
Source: Bloomberg, World Bank, Statista, Oliver Wyman estimation
Online securities trading
Online securities trading platforms, commonly known as digital brokers, aim to provide an
alternative to traditional brokerages by facilitating access to stock market information and
investment. Robinhood is the prime example in the United States, while rising Chinese players
include Futu Securities. China’s online retail securities market has grown tremendously in recent
years, from $1.8 trillion in 2012 to $12.7 trillion in 2017, representing compound annual growth
of 47.8 percent. (See Section 3.)
Online marketplace investing
Individuals can also invest in non-standard credit assets through marketplace investing and lending
platforms, also known as peer-to-peer platforms. These investments generally yield higher returns
than publicly traded fixed income products, and they come with higher credit risks. The underlying
assets normally consist of consumer financing or lending to small- and medium-sized enterprises.
Copyright © 2018 Oliver Wyman 7The P2P industry has experienced strong growth in China over the past decade because of large demand from borrowers and investors whose needs were underserved – or not served at all – by traditional financial institutions. PPDai, one of China’s pioneer marketplace lending platforms, offers multiple investment options for consumer loans, as well as a secondary loan market to facilitate loan transfers. By 2018, it had already registered 78 million cumulative users. Investors can pick investment products of varying yields and durations. Leading global players include Lending Club and Funding Circles. Online crowdfunding Crowdfunding is the process whereby people invest in an early-stage unlisted company in exchange for shares in the company, which is why it is also known as equity crowd-investing. It lets retail investors act as venture capitalists by investing directly in private companies – the kind of investment that was previously limited to wealthy or accredited investors. Globally, a handful of platforms focus specifically on accessing startup investments, for example Angelist and Wefunder. In China, equity crowdfunding only started in 2013. In 2015, Alibaba launched its ANTSDAQ platform and JD started JD Equity Crowdfunding, and in just a year since establishment, JD Equity Crowdfunding has helped 89 startups raise over $170 million and became a leading player in China. While equity-based crowdfunding was relatively slow to get started in China, it is picking up fast and totaled $1.6 billion in 2017. Comprehensive online wealth management Online wealth management is growing in significance. It differs from traditional wealth management in its products, channels, investment philosophy, and services. One typical application is robo-advisory. These platforms offer financial advice or investment management solutions with minimal human intervention, instead utilizing artificial intelligence, machine learning, and algorithms to build a diversified portfolio based on a client’s risk profile, appetite, and objectives. Leading players in the US include Charles Schwab. In China, Lufax leverages data analytics and artificial intelligence to get an all-round picture of its investors from their credit data, daily transactions, and investment behavior. It can then find the right products for them. Lufax has also launched robo-advisory services. China’s online wealth management market has grown rapidly and reached $1.1 trillion in assets under management in 2017. Copyright © 2018 Oliver Wyman 8
2. EMERGENCE OF CHINA FORCES

2.1. CHINA’S WEALTH
Chinese consumers accumulated wealth as they urbanized. In 2017, the urban population reached
814 million, or 58 percent of the total, and it is expected to reach 899 million in 2022,
or 63 percent. (See Figure 4.)

Figure 4: Urban vs. rural population in China

 MN people, 2012–2022F
                                         1,375          1,383            1,390         1,397   1,404    1,410     1,432

                                         51.8%          53.1%            54.3%         55.6%   56.7%    57.8%     62.8%

           Urban Population              48.2%          46.9%            45.7%         44.4%   43.3%    42.2%     37.2%
           Rural Population
                                         2012            2013             2014         2015    2016     2017E     2022F

   Urban Population                        712            734              755          777     796       814          899
   Rural Population                        663            649              635          620     608       595          533
   Total                                 1,375          1,383            1,390         1,397   1,404    1,410     1,432

 Source: National Statistics Bureau; China Central Government, World Bank

Continuous waves of urbanization have been the main driver of higher household income, better
education, and increasing wealthy for the mass population in lower-tier cities and urban areas.
As such, Chinese per capita personal disposable income has continued to grow, albeit at a slowing
rate, and reached $3,600 in 2017. (See Figure 5.)

Figure 5: China’s real annual disposable income per capita

 USD K, 2012–2017
                                                                         +8%

                                                                                                                3.6
                                                                                 3.3             3.4
                                                           3.0
                                   2.7
           2.4

           2012                   2013                    2014                   2015            2016           2017

 Source: National Bureau of Statistics of China, Oliver Wyman analysis

Copyright © 2018 Oliver Wyman                                                                                                9
These increases in disposable income have driven up Chinese personal investable assets,
which increased from $11 trillion in 2012 to $22 trillion in 2017, or compound annual growth of
15 percent. In the following five years, we estimate, they will rise at a rate of 11 percent to reach
$37 trillion.
Figure 6: Personal investable assets in China
USD TN, 2012–2022F +11%
37
33
30
+15% 27
24
22
20
18
16
13
11
2012 2013 2014 2015 2016 2017 2018F 2019F 2020F 2021F 2022F
Source: Forbes, Credit Suisse, World Bank, Oliver Wyman estimation
This growing wealth has fueled significant demand for wealth management over the past few
years, especially among high-net-worth individuals and the growing middle class. They are
gradually demanding investments outside China in order to diversify their risks and because of the
dollar-renminbi exchange rate, lower risk-adjusted yields of onshore assets, and the boom in
leading Chinese enterprises’ overseas capital market activities.
Chinese investors’ offshore assets grew from $0.2 trillion in 2012, when they were just 2 percent of
their total investment assets, to $1.1 trillion in 2017, when they were 5 percent of the total.
That represents compound annual growth of 38.1 percent. By 2022 offshore assets will reach
$3.5 trillion after compound annual growth of 26 percent over five years.
Copyright © 2018 Oliver Wyman 10Figure 7: China personal investable assets offshore allocation
USD TN, 2012–2022F +26%
3.5
2.8
2.2
+38% 1.8
1.4
1.0 1.1
0.8
0.6
0.4
0.2
2012 2013 2014 2015 2016 2017 2018F 2019F 2020F 2021F 2022F
2.0% 2.8% 3.7% 4.5% 5.0% 5.0% 5.7% 6.5% 7.3% 8.3% 9.5%
Offshore penetration
Source: Forbes, Credit Suisse, World Bank, Oliver Wyman analysis
Offshore financial assets have grown more strongly than the other two asset categories, real estate
and cash/deposits. We expect such growth to continue: Between 2017 and 2022, offshore financial
assets – consisting of equities, fixed income, insurance and alternative assets – will grow at a
compound annual rate of 28 percent to reach $2.1 trillion, we estimate.
Figure 8: China offshore asset allocation
USD TN, 2012–2022F
2012–17 2017–22
CAGR CAGR
+26%
3.5
Cash and deposit
0.9 38% 25%
2.8
Real estate
2.2 0.7 0.5 35% 20%
1.8 0.6 0.4
+38% 1.4 0.4 0.4
1.1 0.4 Financial assets
1.0 0.3
2.1
0.8 0.3 0.2 39% 28%
0.3 1.7
0.6 0.2 0.2 1.3
0.2 0.4 0.2
0.1 0.2 1.0
0.1 0.1 0.1 0.8
0.1 0.5 0.6
0.00.1 0.3 0.4
0.2
2012 2013 2014 2015 2016 2017 2018F 2019F 2020F 2021F 2022F
Source: Forbes, Credit Suisse, World Bank, Oliver Wyman analysis
The trend towards offshore investments has become powerful. It will have an impact both on
Chinese wealth managers and their business models and on wealth managers around the world.
Copyright © 2018 Oliver Wyman 112.2. CHINA’S TECH
Chinese investors are bringing a new set of characteristics and investment behavior to global
markets, to a large extent driven by Internet-centered lifestyles. These changes have been driven
by China’s Internet giants – known collectively as BATJ: Baidu, Alibaba, Tencent, and JD – which
have established online ecosystems that provide a wide range of consumer services and have
significantly changed customers’ daily behavior.
Figure 9: Illustration of ownership and direct investments of Chinese Internet giants
Illustrative Baidu Alibaba Tencent JD.com MI.com
Group
Valuation
USD 66BN USD 413BN USD 380BN USD 36BN USD 46BN
(Nov 2018)
Year of
2000 1999 1998 1998 2010
establishment
Entertainment/
lifestyle
Finance
Payment/
e-wallet
E-commerce
Transportation
Discount Taxi
Video Ticket Radio Financing Groupon C2C
store services
Overseas Bike
Music Gaming Investing E-wallet B2C O2O
shopping services
Copyright © 2018 Oliver Wyman 12Figure 10 illustrates how Chinese consumers’ daily lives are connected to these Internet giants.
Figure 10: Illustration of China online ecosystem
Weekday
8:00 9:00 11:30 12:00 13:00 16:30 18:00 21:00
Reserve taxi Get breakfast Order fruits Browse lunch Online shopping/ Reserve Do the laundry Watch
to work delivered delivery options and errands at housekeeping delivery online TV
voucher lunch break service
Weekend
10:00 11:00 11:30 13:00 14:00 16:00 17:00 18:00 21:00
Get pet Nail care Track Listen to Buy tutorial Get afternoon Book Get necessary Gym practice
service service investment paid music lessons for retreats holiday trip medicine class
Yoga
Chinese investors have a number of distinctive characteristics:
A do-it-yourself spirit
Unlike their US peers, who tend to rely on wealth or asset managers, many Chinese retail investors
trade securities and purchase wealth management products directly. Reasons include a reluctance
to trust other people with wealth-related decisions, underdeveloped wealth and
asset-management industries, and a speculation-oriented market.
These retail investors account for around 80 percent of total domestic securities trading volume,
and they demand direct, convenient investment channels in which they can easily manage their
own investments and obtain information and advice at a low cost. Their demand has provided an
opportunity for a wealth-tech industry to emerge and offer retail investors faster, cheaper,
and more-user-friendly solutions.
As Chinese investors begin to manage their overseas investments, their preference for DIY
solutions is reshaping the wealth management industry in places like Hong Kong. This in turn is
influencing the behavior of local investors in those places. Something similar happened in the US
after the emergence of discounted and online brokers targeting millennials. The new brokers
triggered a trend towards DIY investment even though the country’s mainstream consisted of
managed wealth and institutional investors.
Copyright © 2018 Oliver Wyman 13Tech-savvy The rapid development of Internet giants such as Alibaba and Tencent in the past decade has made the Chinese tech-savvy, and they are now very used to online shopping and mobile payments. One consequence is that Chinese investors are receptive to new technologies and open to digital wealth management. In addition, fintech players in China react to market demand quickly: They adopt new technologies and launch new products and services in days rather than months. This is a contrast to more-developed markets such as Hong Kong, which have mature, well-established investment industry dominated by traditional players. Investors in these markets tend to be older and their needs are better served. As a result they are more comfortable managing their wealth with traditional options, such as branches and phone calls, than they are with new technologies. Price-sensitive China consumers are used to the online economy, where there is high level of transparency and much information is available, and they tend to compare prices for the best value. In addition, the BATJs use their main businesses – such as retail, gaming, and advertisements – to subsidize different types of free service. As a result, Chinese consumers are often unwilling to pay for services. Advisory fees account for less than 5 percent of wealth managers’ total income, compared to more than 30 percent in the US. One example of a free service in China is the stock price information offered by most online securities players. When Chinese investors took their wealth offshore to places such as Hong Kong, these characteristics presented challenges to existing players. The technology from China, represented by Alibaba and Tencent, is using this opportunity to expand outside China. Compared to traditional players, the technology from China brings not only new technologies, but also new business models that have been proven in China. Thanks to their success in China and on global capital markets, most of these tech players are well funded and have a strong capital base with which to withstand any price competition. They usually adopt quite an aggressive customer-oriented strategy, which involves subsidized prices and high-quality service – real-time response services for example. Such strong China tech has changed the dynamics of multiple spaces in the global wealth-tech landscape by raising the industry’s level of services and customers’ expectations. As a result, the online securities market is being reshaped. Copyright © 2018 Oliver Wyman 14
3. CHINA FORCES IN ONLINE SECURITIES MARKET

3.1. OVERVIEW OF THE GLOBAL ONLINE SECURITIES MARKET
The online retail securities market is for the trading of securities that have been ordered directly
by individual or retail investors and then channeled to brokers via electronic media. The global
transaction volume of retail securities rose from $44 trillion in 2012 to $59 trillion in 2017,
representing compound annual growth of 6 percent over five years and driven by an enlargement
of the retail investor base. The percentage of online transactions more than doubled over the same
period, from $8.8 trillion in 2012 to $27.8 trillion in 2017, or compound annual growth of
26 percent. The big jump in 2015 was driven by the bull market in China.

Figure 11: Global retail securities market transaction volume

 USD TN, 2012–2017

                                                          +6%
                                                                77

                                                                                        59
                                                                44%     56
                               48                   50
          44
                              23%                  30%                 44%             47%     Online
         20%

                                                                56%
         80%                  77%                  70%                 56%             53%     Offline

        2012                 2013                 2014          2015   2016            2017

 Source: Bloomberg, World Bank, Oliver Wyman estimation

Leading players in the online global securities market include TD Ameritrade and
Interactive Brokers. TD Ameritrade was the first broker to support 24/5 trading – 24 hours a day,
five days a week. It has won awards for its platforms, tools, and mobile apps, as well as its research,
customer service, and education. Interactive Brokers is one of the largest online securities trading
firms in the US, offering transaction services for stocks, options, futures, and other financial
products in locations including Europe, Hong Kong, and Australia.

Copyright © 2018 Oliver Wyman                                                                        15
3.2. OVERVIEW OF THE CHINA ONLINE SECURITIES
MARKET
China has become the largest market for online securities trading, contributing between 40 and
60 percent of the global online trading volume between 2015 and 2017, up from less than
20 percent in 2012. This is a result of both the development of China’s capital market and the
increase in its online penetration.
Figure 12: Global online retail securities trading volume
USD TN, 2012–2017
+25.9%
33.8
22.2% 27.8
2.1% 24.2
34.3% Others
30.2%
2.9% Hong Kong
14.9 2.1%
60.3%
11.0 35.7% 42.0% China
8.8 46.6%
37.1% 1.9%
37.7% 1.6% 1.8% 34.5%
43.1% 25.5% 35.6% US
17.6% 27.9% 15.5% 21.1% 20.9%
2012 2013 2014 2015 2016 2017
Source: Bloomberg, Oliver Wyman estimation
Over the past decades, despite a few tough years, the Chinese securities market has expanded
strongly, thanks to significant restructuring and market recovery. Trading activity in Chinese
securities picked up in earnest in the latter half of the 1990s after the start of online stock trading
and the widespread introduction of self-service trading terminals in brokerage branches. In the
early 2000s, over 70 percent of security firms provided online securities trading service and nearly
20 percent of the total trading volume was online. As competition intensified, demand grew for
better service quality and coverage. The competitive landscape gradually shifted from a price war
and commoditized services towards technology advances and service quality.
Copyright © 2018 Oliver Wyman 16Figure 13: Turnover forecast of China domestic online retail securities market
USD TN, 2012–2022F
+19%
30.3
+48%
25.6
21.6 21.6
18.2
15.3
12.2 12.7
5.7
1.8 3.1
2012 2013 2014 2015 2016 2017 2018F 2019F 2020F 2021F 2022
Source: Bloomberg, World Bank, Oliver Wyman estimation
A variety of players have now entered the market, including top traditional financial institutions
with self-developed online platforms and alliances of information providers and middle-sized
securities firms. As the online penetration rate reaches over 80 percent, major players are focusing
their efforts on expanding their share of the existing market. Cooperation between Internet giants
and leading securities firms is producing synergies between traffic and industry insight, as well as
between services like wealth management advisory and standardized products available from
online channels. For the foreseeable future, the Chinese market will play a more-important role in
the global online securities market and contribute to changes in the rules of the game.
Case example:
Huatai Securities – a leading onshore online securities trading platform
Traditional Chinese securities firms started to adopt Internet strategies in 2009.
Huatai Securities was one of the earliest and developed a low-brokerage-commission strategy
to attract investors, taking advantage of low operating costs resulting from technology
advances. It launched a mobile trading app in 2014, and its share of transaction volume
increased from less than 5 percent in 2013 to around 8 percent in 2017. Key features include
the ability to open an account in three minutes, real-time securities market information, and
more than 100 online investment professionals to provide advisory services. In late 2017,
Huatai announced an upgrade for the app, which now uses artificial intelligence to monitor
securities performance in real time.
Huatai’s mobile app has around 7 million active investors as of August 2018, significantly more
than PingAn Securities, which is ranked second with around 4 million. China’s online retail
securities market has also attracted tech giants such as Baidu, Alibaba, and Tencent, which
have been actively investing. Tencent invested in Futu Securities, and Alibaba-backed YF
Financial acquired Reorient Group and expanded into the online wealth management and
brokerage businesses. However, the investment and strategic resources needed are entry
barriers to new joiners and small players.
Copyright © 2018 Oliver Wyman 17The offshore online securities market is much smaller than the onshore but has experienced even
faster growth. It expanded from $11.8 billion in 2012 to $297.5 billion in 2017, compound annual
growth of 90.8 percent. It will grow to $1,355.8 billion in 2022, we estimate, after compound
growth of 35.4 percent over five years.
Figure 14: China’s offshore online retail securities trading volume
Online offshore retail securities market
USD BN, 2012–2022F +35.4%
1,355.8
1,055.5
825.2
625.9
+90.8%
445.4
297.5
184.5
98.8
11.8 17.0 43.7
2012 2013 2014 2015 2016 2017 2018F 2019F 2020F 2021F 2022F
Source: HKEX, NYSE, Forbes, World Bank, Oliver Wyman analysis
The leading players in this market are relatively new to the securities business and mostly have
strong links to technology companies. For example, Futu Securities was founded by former Tencent
employees and invested in by Tencent. One of Tiger securities’ major shareholders is Xiaomi.
These newcomers offer low commissions and an online-only transaction channel. Investors can
execute trades using a mobile or desktop app with limited involvement from brokers.
These brokers adopt asset-light models and use their strong technology capabilities to attract a
large user base. Some of the brokers offer social networking channels that provide the latest
market information.
Case example:
Futu Securities – a leading offshore online securities trading platform
Futu Securities is a leading technology-driven online securities trading services platform,
which allows individual investors to trade securities in various markets. It also offers a variety
of products and services designed to simplify the investing process, including real-time stock
quotes, market data, and news. In addition, Futu hosts an interactive investor community
where users and clients can exchange investment views and ideas. This community gives
investors the opportunity to attend lessons, share their analyses, and join the live earnings
calls of listed companies.
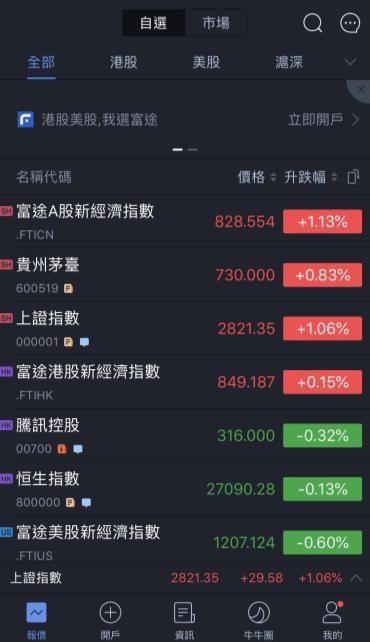
Copyright © 2018 Oliver Wyman 18Figure 15: Futu Securities App Real time stock quote Investor community Copyright © 2018 Oliver Wyman 19
3.3. KEY SUCCESS FACTORS FOR OFFSHORE ONLINE
     SECURITIES TRADING
The most successful offshore online securities trading platforms leverage their tech parents’
technologies and customer bases, as well as insights and solutions proven in domestic markets.
According to our observations, they tend to have the characteristics below.

Closed-loop, proprietary technology facilities

To stay ahead of the market, leading securities firms need robust systems to support all the
processes along the securities-transaction value chain, from the mobile app in the front office
to trading, clearing, and risk management in the back.

• Proprietary systems: Leading players should develop their own systems for the whole securities
  transaction process, from mobile app and customer relationship management to trading,
  clearing, and risk management. This will mean they have independent platforms that do not rely
  on systems provided by third parties or other securities firms.
• Scalability: The systems need to be designed so that they can be scaled up to cope with any
  sudden increase in trading volume due to high market volatility. If a trade cannot be executed
  on a timely basis due to technical issues, investors may switch to another platform.
• Security: Safety is always investors’ top concern. Leading securities firms should make system
  security a priority, as any security incidents would significantly affect investors’ confidence
  in them.

Excellent user experience

A favorable experience is crucial for attracting and retaining investors.
There are four key components:

• Efficient services: Transactions must be executed efficiently and on a timely basis. The investor
  experience can further be enhanced by letting investors monitor the performance of their
  investments round the clock.
• Accurate, real-time information: Securities trading requires analysis of the most up-to-date
  information. Leading platforms should therefore provide accurate, real-time information that
  investors can reference before they make an investment decision. Such services rely heavily on
  relationships with information providers.
• Easy to use: Both the PC and mobile versions of the securities platform need simple,
  user-friendly designs.
• Low transaction costs: Competition means that low transaction costs are a weapon for
  increasing market share. Leading platforms do not necessarily charge zero transaction fees,
  but in general they have low-cost, easy-to-understand transaction schemes.

Copyright © 2018 Oliver Wyman                                                                       20
Effective, low-cost access New investors need to be obtained and signed up efficiently in order to cover the operating and marketing costs. In general, there are two methods: • Conversion from internal ecosystem: Leading platforms normally develop their own investor ecosystems, which provide securities information, trading facilities, and performance tracking. A user may download an app and read the information on it before investing in securities. Accurate, real-time securities information is a way to attract these users and make them part of the ecosystem. Once these users have developed an understanding of the ecosystem, platforms can then turn them into investors. • External acquisition: Securities player can promote their services and attract new investors by cooperating with third-parties, such as social media platforms. Financial services comparison players publish information on different securities firms, including their commission rates, minimum commission fees, margin rates, and custody fees. Some of the firms offer these comparison websites referral fees as a means to attract new investors. These three attributes have helped new platforms establish a presence in markets such as Hong Kong, where they are quickly capturing a share of local investors. Futu Securities has become the fourth biggest online securities retail trading platform in Hong Kong in terms of revenue generated. Its annual H-share transaction volume was 300 billion Hong Kong dollars in 2017, with around 15 percent of its transactions coming from investors in Hong Kong. These new platforms will continue to grow as Chinese wealth moves to other markets, such as Singapore and the US, and as technology-oriented experiences and low-cost services appeal to younger people around Copyright © 2018 Oliver Wyman 21
ABOUT OLIVER WYMAN
Oliver Wyman is a global leader in management consulting. With offices in 50+ cities across nearly 30 countries,
Oliver Wyman combines deep industry knowledge with specialized expertise in strategy, operations, risk
management, and organization transformation. The firm has more than 4,700 professionals around the world who
help clients optimize their business, improve their operations and risk profile, and accelerate their organizational
performance to seize the most attractive opportunities. Oliver Wyman is a wholly owned subsidiary of
Marsh & McLennan Companies [NYSE: MMC].
For more information, visit www.oliverwyman.com. Follow Oliver Wyman on Twitter @OliverWyman

www.oliverwyman.com

Copyright © 2018 Oliver Wyman
All rights reserved. This report may not be reproduced or redistributed, in whole or in part, without the written permission of
Oliver Wyman and Oliver Wyman accepts no liability whatsoever for the actions of third parties in this respect.
The information and opinions in this report were prepared by Oliver Wyman. This report is not investment advice and should not
be relied on for such advice or as a substitute for consultation with professional accountants, tax, legal or financial advisors.
Oliver Wyman has made every effort to use reliable, up-to-date and comprehensive information and analysis, but all information is
provided without warranty of any kind, express or implied. Oliver Wyman disclaims any responsibility to update the information or
conclusions in this report. Oliver Wyman accepts no liability for any loss arising from any action taken or refrained from as a result
of information contained in this report or any reports or sources of information referred to herein, or for any consequential,
special or similar damages even if advised of the possibility of such damages. The report is not an offer to buy or sell securities or a
solicitation of an offer to buy or sell securities. This report may not be sold without the written consent of Oliver Wyman.
You can also read