No. 1151 2021 Interbank relationship lending revisited: Are the funds available at a similar price? By: Carlos León Javier Miguélez - Banco de la ...
←
→
Page content transcription
If your browser does not render page correctly, please read the page content below
Interbank relationship lending
revisited: Are the funds available
at a similar price?

By: Carlos León
 Javier Miguélez

 No. 1151
 2021
Interbank relationship lending revisited:
 Are the funds available at a similar price?a

 Carlos Leónb
 Javier Miguélezd

 The opinions contained in this document are the sole responsibility of the authors and do not
 commit Banco de la República or its Board of Directors.

 Abstract
Under the market discipline hypothesis, monitoring by interbank lenders may induce changes in
either the price or availability of new interbank funds to borrower banks. However, the presence
of interbank relationship lending has been evaluated based on the availability of funds only—
disregarding their price. We revisit relationship lending in unsecured interbank lending markets
by simultaneously evaluating the availability and price of funds. We calculate the survival ratio of
networks containing the price of daily interbank lending in Colombia from 2014 to 2020. Under
this framework, an interbank relation survives from one day to the next if the funds are available
at a price that does not increase too much; that is, either a halt in interbank funding or a sizeable
increase in the price of interbank funding mark a break in the relation between two banks. We find
that about 38 percent of relations in the Colombian unsecured interbank lending market survive
from one day to the next. Therefore, from a comprehensive market discipline perspective, we find
evidence of interbank relationship lending in Colombia.

JEL Classification: E43, G21, L14

Keywords: market discipline, interbank, lending, network.

a
 Opinions and statements in this article are the sole responsibility of the authors, and do not represent neither those
of Banco de la República nor of its Board of Directors. We thank Daniel Osorio for encouraging us to follow this
research path. We thank Pamela Cardozo, Clara Machado, and Daniel Osorio for their comments and suggestions.
Any remaining errors are our own.
b
 Financial Infrastructure Oversight Department, Banco de la República; Department of Finance, Tilburg University.
E-mail: cleonrin@banrep.gov.co / c.e.leonrincon@tilburguniversity.edu. [corresponding author]
d
 Financial Infrastructure Oversight Department, Banco de la República. E-mail: jmiguema@banrep.gov.co.
Reexaminando las relaciones de préstamo interbancario:
 ¿Están los fondos disponibles a un precio similar? a

 Carlos Leónb
 Javier Miguélezd

Las opiniones contenidas en el presente documento son responsabilidad exclusiva de los autores
 y no comprometen al Banco de la República ni a su Junta Directiva

 Resumen
Según la hipótesis de disciplina de mercado, el monitoreo que realizan los bancos que otorgan
créditos en el mercado interbancario puede inducir cambios en el precio o disponibilidad de nuevos
fondos para los bancos que buscan liquidez. No obstante, la presencia de relaciones de préstamo
interbancario se ha evaluado con base en la disponibilidad de fondos únicamente—dejando de lado
su precio. En este documento reexaminamos la presencia de relaciones de préstamo interbancario
evaluando simultáneamente la disponibilidad y precio de fondos interbancarios. Calculamos el
coeficiente de sobrevivencia de las redes diarias que contienen el precio de los préstamos
interbancarios en Colombia desde 2014 hasta 2020. Bajo esta aproximación, una relación
interbancaria sobrevive de un día al siguiente si los fondos están disponibles a un precio que no se
incrementa demasiado; en este sentido, la no disponibilidad de fondos o un aumento considerable
en el precio de los fondos marca una discontinuidad en la relación entre dos bancos. Encontramos
que cerca del 38 porciento de las relaciones en el mercado interbancario no colateralizado
sobrevive de un día al siguiente. En consecuencia, desde una perspectiva amplia de disciplina de
mercado, encontramos evidencia de la existencia de relaciones de préstamo interbancario en
Colombia.

Clasificación JEL: E43, G21, L14

Palabras clave: disciplina de mercado, interbancario, préstamo, redes.

a
 Las opiniones contenidas en este documento son responsabilidad exclusiva de los autores y no comprometen al
Banco de la República ni a su Junta Directiva. Agradecemos a Daniel Osorio por sugerirnos esta idea de investigación.
Agradecemos a Pamela Cardozo, Clara Machado y Daniel Osorio por sus comentarios y sugerencias. Cualquier error
es de los autores.
b
 Departamento de Seguimiento a la Infraestructura Financiera, Banco de la República; Departamento de Finanzas,
Universidad de Tilburg. E-mail: cleonrin@banrep.gov.co / c.e.leonrincon@tilburguniversity.edu. [autor para
correspondencia]
d
 Departamento de Seguimiento a la Infraestructura Financiera, Banco de la República. E-mail:
jmiguema@banrep.gov.co.
1 Introduction

Interbank relationship lending, corresponding to the presence of stable and strong interbank
lending relationships, is a well-documented fact (see Furfine, 1999, Furfine, 2001, Cocco, et al.,
2009, Affinito, 2012, Afonso, et al., 2013, Hüser, 2016, Bräuning & Fecht, 2017, Kobayashi &
Takaguchi, 2018, Degryse, et al., 2019, León & Miguélez, 2020), with well-studied theoretical
foundations (see Iori, et al., 2015, Hüser, 2016). Interbank relationship lending is an indicator of
trust among financial institutions, and it has been credited as the mainstay of interbank markets
and financial stability.

 However, there is no uniformly accepted method for measuring interbank relationship
lending. Furfine (1999) and Bräuning and Fecht (2017) use the number of transactions between
banks. Furfine (2001) and Degryse, et al. (2019) use the number of days with transactions between
banks. Cocco, et al. (2009), Affinito (2012), Temizsoy, et al. (2015), Capera-Romero, et al. (2015),
and Bräuning and Fecht (2017) use the concentration of relations between banks. Kobayashi and
Takaguchi (2018) measure interbank relationship lending based on how significant the number of
trades is with respect to a null network model. León and Miguélez (2020) measure the persistence
of relations in consecutive interbank lending networks. Mazzarisi, et al. (2020) use the persistence
of banks’ lending relations to model interbank networks.

 From the simplest to the most elaborate, all these approaches focus on the availability of
(new) interbank funding.1 They all neglect the price of interbank funding when measuring the
extent of relationship lending.2 This is potentially misleading.

1
 In the case of customer relationship lending (see Petersen & Rajan, 1994, Lončarski & Marinč, 2020), the focus on
proxies for funding availability—in the form of past relationships—is pervasive too (see Huang & Huang, 2011). As
in the case of interbank relationship lending, there is no uniformly accepted method for measuring customer
relationship lending (Bharath, et al., 2007, Huang & Huang, 2011).
2
 Authors who have data on bilateral interbank rates do not use them to measure relationship lending. Instead, they
focus on testing whether pricing is explained by interbank relationship lending. After controlling for other factors
(e.g., bank size, counterparty risk, search costs, time of transactions, reciprocal relationships), they find that interbank
relationship lending has a negative effect on bilateral interbank rates. See Furfine (2001) for the United States’
interbank market; Cocco, et al. (2009) for the Portuguese case; Temizsoy, et al. (2015) for the Italian case; Bräuning
and Fecht (2017) for the German case; Degryse, et al. (2019) for the Russian case.

 1
For example, if Bank A increases the rate it charges to Bank B by a factor of four (e.g., from
2 percent on day to 8 percent on day + 1), the relation is taken as continuous because of funding
availability. Additionally, if from day to day + 1 Bank A does not change the rate it charges to
Bank C, both interbank relations (between Bank A and Bank B, and between Bank A and Bank C)
are—mistakenly—regarded as equal. In this example, the hypothesis of market discipline (see
Flannery, 2001, King, 2008) is neglected: The ability of Bank A to monitor and assess changes in
the conditions of Bank B and to incorporate those changes in the price of interbank funding is
ignored.3

 In this vein, based on the incentives for banks to monitor each other and to exert market
discipline via funding prices in unsecured interbank markets (see Rochet & Tirole, 1996, Flannery,
1998, Furfine, 2001, Nier & Baumann, 2006, King, 2008, Sarmiento, 2016, Sarmiento, et al.,
2017), sizeable increases in the price of bilateral interbank funds may mark a decline in the trust
between banks. This de facto discontinuity in banks’ relations is unnoticed when the funding
availability criterion is used alone—as in customary measures of interbank relationship lending.
Therefore, taking into account that market discipline may either affect the price or availability of
new funds (Flannery, 1998, King, 2008), we focus on the availability of similarly priced interbank
funds, i.e., agreed at equal or more favorable rates for the borrower.

 We address this shortcoming of customary measures of interbank relationship lending by
implementing the adjusted version of the survival ratio (see León & Miguélez, 2020) on a network
built from daily Colombian unsecured interbank bilateral transactions from January 2014 to
August 2020. Instead of using an unweighted and directed network corresponding to the
availability of interbank funds, we use a weighted and directed network corresponding to interbank
bilateral lending rates. Consequently, following Flannery (1998), either a halt in interbank funding
or a sizeable increase in the price of interbank funding mark a break in the relation between two
banks. As in Furfine (2001), León, et al. (2016), and Bräuning and Fecht (2017), we use an
algorithm to accurately infer bilateral interbank lending rates from large-value payment system

3
 Following Flannery (2001), when we refer to market discipline, we refer to the investors’ market monitoring that
results in information via changes in prices—not to the claimants’ market influence that induces firms’ actions.

 2
data. To mitigate issues related to varying macro conditions, the funding price is measured as a
spread with respect to the local interbank reference rate (IBR).

 Under our approach, we find that about 38 and 14 percent of funds are available at a similar
price from one day to the next and during a 5-day period, respectively. Results are robust to
changes in the threshold used to determine what a sizeable change in interbank lending price is.
After discarding randomness as a plausible source of results, we find evidence of interbank
relationship lending in Colombia from a comprehensive market discipline perspective. Also, akin
to Furfine (2001), our results suggest that high counterparty risk does not cause high funding prices
but the unavailability of funds.

 Our work contributes to related literature. Although it is well-known that market discipline
may either affect the price or availability of new funds, our work introduces a method able to
incorporate both to evaluate the presence of interbank relationship lending. Therefore, our work
closes an important gap in related literature, which may enrich the explanatory modeling of
interbank markets. From a financial stability perspective, our work provides a measure that better
gauges the bilateral and overall willingness of banks to lend to each other, which is easy to
calculate, interpret, and monitor; available as a high-frequency variable for monitoring and
analytical purposes. Regarding the Colombian case, results add to previous findings about
relationship lending reported in Capera-Romero, et al. (2015) and León and Miguélez (2020).

 The rest of this paper is organized as follows. Section 2 describes the dataset and its
construction. Section 3 details the methodological approach. Section 4 presents the main results.
Section 5 summarizes and discusses our findings.

 3
2 The interbank rates network dataset

The main input of our work is a weighted and directed network corresponding to daily unsecured
interbank bilateral lending rates, i.e., the price of funding. We work on bilateral interbank
transactions and their rates because we aim to study the availability of new funds at a similar price.4

 As usual, there are two sources to build this weighted network of bilateral lending rates.
First, banks’ reports to financial authorities. Second, interbank bilateral rates inferred from
interbank payment transactions—a procedure that is commonly known as the Furfine algorithm.
In the Colombian case, both sources are available. The first source is available from the Colombian
Financial Superintendence, which collects, processes, and consolidates reports from banks.5 The
second source is available by using the Furfine algorithm developed for the Colombian case in
León, et al. (2016).

 The natural choice is to use reported data. However, there are five reasons why we choose
to work with inferred interbank bilateral rates. First, in our case, the reported dataset comes with
some caveats that make its usage difficult.6 Second, the Furfine algorithm for the Colombian case
has been tested for accuracy; as reported in León, et al. (2016), the algorithm’s implicit overnight
interest rates closely match the publicly available overnight reference rates, and most loans
identified by the algorithm (about 99 percent) match reported data. Third, in our case, the data is
available daily and with no lag from the single non-tiered large-value payment system in
Colombia, which is owned and managed by Banco de la República (the Central Bank of
Colombia). Fourth, unlike reported data, transactional data avoids errors from consolidating,
processing, and transmitting by banks and authorities. Fifth, as highlighted by Kyriakopoulos, et

4
 Although it is possible to work on outstanding interbank lending, it would not reflect the repeated nature of interbank
relations we aim to capture. Further, by using outstanding interbank lending the persistence of relations will be equal
or higher than that obtained with new funding. Therefore, working on new funding is a conservative and judicious
choice.
5
 In the Colombian case, non-banking institutions (e.g., broker-dealers, pension funds, trust companies) borrow and
lend without collateral too, but at intraday maturity only. As we work on overnight and term unsecured lending, for
brevity, we refer to banks.
6
 Three main caveats exist. First, although the dataset contains daily reports from lending banks, it is only available in
weekly batches with a lag between one and two weeks. Second, the identification of the banks (i.e., their names and
codes) is erratic. Third, due to unlabeled data, discarding unwarranted interbank transactions is difficult and uncertain;
that is the case of transactions resulting from auctions of the interbank reference rate formation program—as explained
below.

 4
al. (2009), transactional data provide real-time pictures of transactions of financial institutions’
activities, and—unlike reported data—are difficult to tamper.7

 Therefore, we implement the Furfine algorithm in León, et al. (2016). Furfine (1999)
introduced this type of algorithm to identify interbank lending relations from the United States’
large-value payment system (i.e., Fedwire) based on a simple premise: In the large-value payment
system, all interbank loans from Bank A to Bank B on day will result in repayment from Bank
B to Bank A on day + 1, such that the implicit interest rate between the loan and the repayment
is reasonable with respect to an interbank reference rate. Since its introduction, this algorithm has
been used and evaluated extensively (see Furfine, 2001, Millard & Polenghi, 2004, Heijmans, et
al., 2010, Guggenheim, et al., 2010, Armantier & Copeland, 2012, Arciero, et al., 2013, León, et
al., 2016, Bräuning and Fecht, 2017).

 However, unlike most implementations of the Furfine algorithm, we do not have to work on
the entire (raw) large-value payment system dataset. The Colombian large-value payment system
uses transactional codes that enable us to filter interbank loans and their repayments with ease and
to discard interbank loans and repayments pertaining to the auctions of the reference rate ( )
formation program—not corresponding to interbank relationship lending. On this filtered data, the
algorithm uses an area of plausible implicit interest rates that is set at a ±100 basis points corridor
with respect to the maximum and minimum publicly available interbank reference rates for the
overnight, one-month, and three-month maturities. Plausible maturities for interbank loans are set
from overnight to 90 days. In the case of multiple potential matches, the algorithm uses a recursive
procedure that determines the selected match based on the lowest difference with respect to the
estimated interbank rate term structure, the lowest maturity, and the order of arrival of the
transaction to the large-value payment system—in that order.8

7
 Tampering reported interbank data is possible. For instance, in March 2008, Libor panel banks were accused of
misreporting interbank interest rates to avoid negative signaling (see Guggenheim, et al., 2010). Nevertheless,
tampering transactional data is not impossible, e.g., by misusing transactional codes in large-value payment systems.
8
 This configuration of the algorithm corresponds to the best performing as reported in León, et al. (2016). In our case,
it is the best performing too.

 5
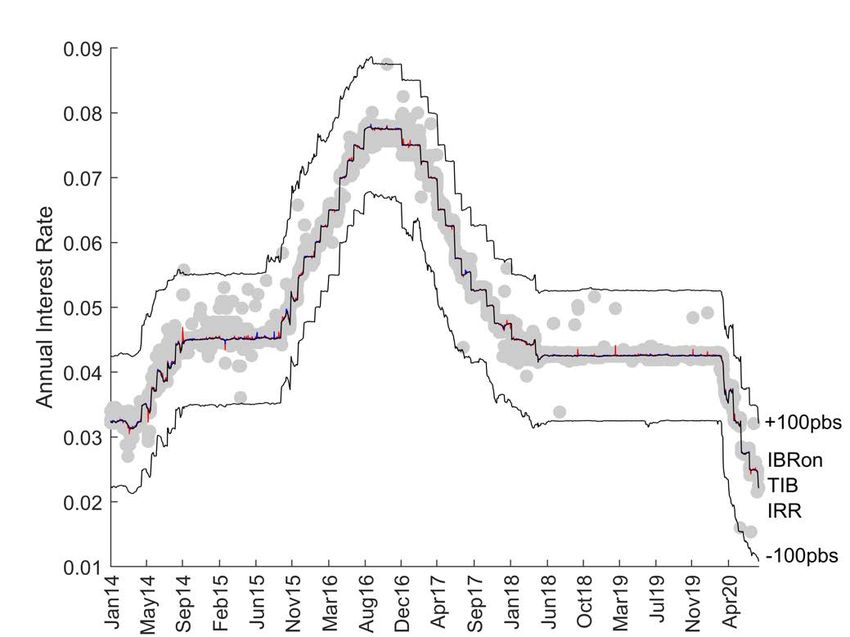
Figure 1 displays the main outcome of the implemented algorithm. Dots correspond to
interbank loans identified by the algorithm. The corridor corresponds to the selected ±100 basis
points with respect to the maximum and minimum for the overnight, one-month, and three-
month time-to-maturities. Intertwined in the middle of the corridor, the interbank overnight
reference rate ( ), the interbank overnight funds average rate ( ), and the algorithm’s
weighted average implicit interbank rate ( ) are in black, blue, and red, respectively.9

 Figure 1. Interbank rates inferred from large-value payment system data. Dots
 represent the loans identified by the algorithm. The three lines in the middle of the
 ±100 bps corridor correspond to the implicit interbank interest rate ( ), in red;
 the interbank overnight reference rate ( ), in black; and the interbank
 overnight funds average rate ( ), in blue.

 The overall goodness of fit of the algorithm is apparent in the visual convergence of the three
series in the middle of the corridor, whose correlations are about 0.99. The algorithm’s goodness
of fit is evaluated by the matches with reported data. About 99.16 and 99.22 percent of identified

9
 The interbank overnight reference rate (Índice Bancario de Referencia overnight – ) is the overnight rate of
the interbank reference rate formation program. The interbank overnight funds average rate (Tasa Interbancaria –
 ) is calculated and reported by the central bank based on bank’ reports to the Colombian Financial
Superintendency. The weighted average implicit interbank rate ( ) is the weighted average rate resulting from the
algorithm.

 6
interbank transactions by number and value, respectively, match reported loans; about 50.97 and
54.50 percent are exact matches (i.e., two-decimal precision), respectively.10

 The attained dataset consists of interbank lending transactions from January 2th, 2014 to
August 4, 2020, which total 1,606 days, = 1606. During this period, we infer 21,210 interbank
lending transactions among 40 banks, = 40. Regarding the maturity of lending transactions,
overnight lending is prevalent. About 56.94 and 50.66 percent of lending transactions correspond
to overnight lending by number and value, respectively. The mean maturity of lending transactions
is about three days, whereas the mode and the median are both equal to one day.11

 From the dataset, we build two networks. The first network is unweighted and directed,
representing the presence or absence of an interbank relation, i.e., the availability of funding. Let
 represent the number of banks in the network at time , is a matrix of dimensions × ×
that represents the unweighted and directed network, with elements !"# such that

 1 if there is an interbank loan from to at time ,
 !"# =2 G [1]
 0 otherwise.

 The second network is weighted and directed. Let !"# be the weighted average rate charged
by Bank to Bank for interbank funds at time , and # the interbank overnight reference
rate at time , is a weighted and directed matrix of dimensions × × with elements !"#
such that

 K !"# − # M | !"# =1,
 !"# = J O [2]
 0 otherwise.

10
 As highlighted in León, et al. (2016), the reliability of reported data is uncertain. Therefore, this comparison is only
indicative of the goodness of fit attained by the algorithm.
11
 Due to the prevalence of overnight lending, we consider the daily frequency as the natural snapshot rate (see Clauset
& Eagle, 2007) of the Colombian interbank network for analytical purposes. That is, as overnight lending is
predominant, most lending and borrowing decisions and interactions occur daily. Aggregating transactions into
weekly or monthly networks may bias the results upwards—higher incidence of interbank relationship lending.

 7
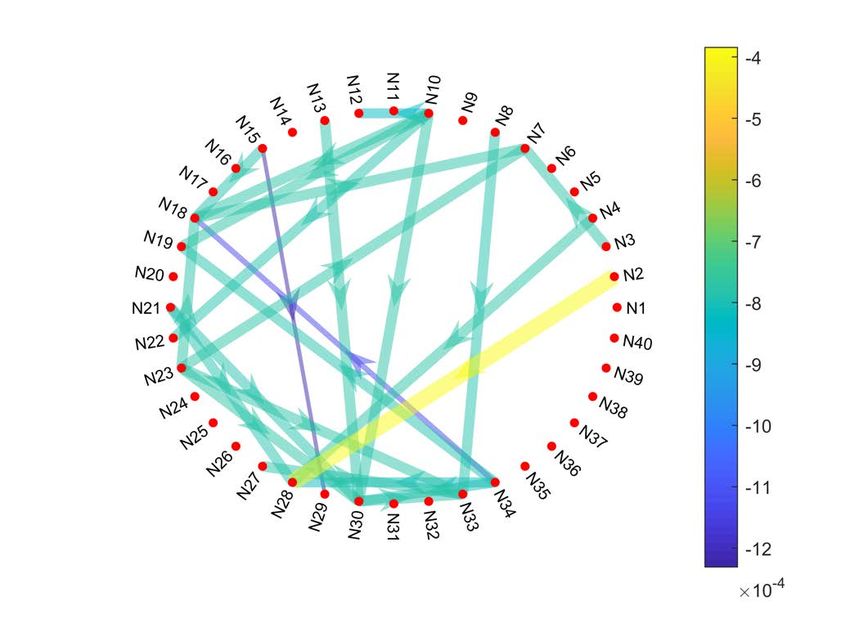
Conditional on the availability of funding ( !"# =1), !"# contains the weighted average
interest rate spread. By subtracting the corresponding interbank overnight reference rate ( # ),
we are able to work on the bilateral interbank lending spread. 12 This enables us to identify
variations in the price of funding due to changes in bilateral interbank relations—while avoiding
variations due to changes in macro conditions.

 Figure 2 shows the network graph corresponding to day = 871 (July 28, 2017) in ; this
is the day with the highest value of interbank lending in the sample. Nodes represent each bank in
the sample, with a code that obfuscates its identity—for confidentiality reasons. Arrows
correspond to lending transactions, from the lender to the borrower, whereas the width and color
represent the spread with respect to the overnight reference rate.

 Figure 2. Network graph corresponding to day = 871 in . Nodes represent
 each bank in the sample. Arrows correspond to lending transactions, from the
 lender to the borrower, whereas the width and color (see color bar on the right)
 represent the spread with respect to the overnight reference rate ( ).

12
 Using the interbank overnight reference rate is a judicious choice because—as reported before—overnight lending
is prevalent.

 8
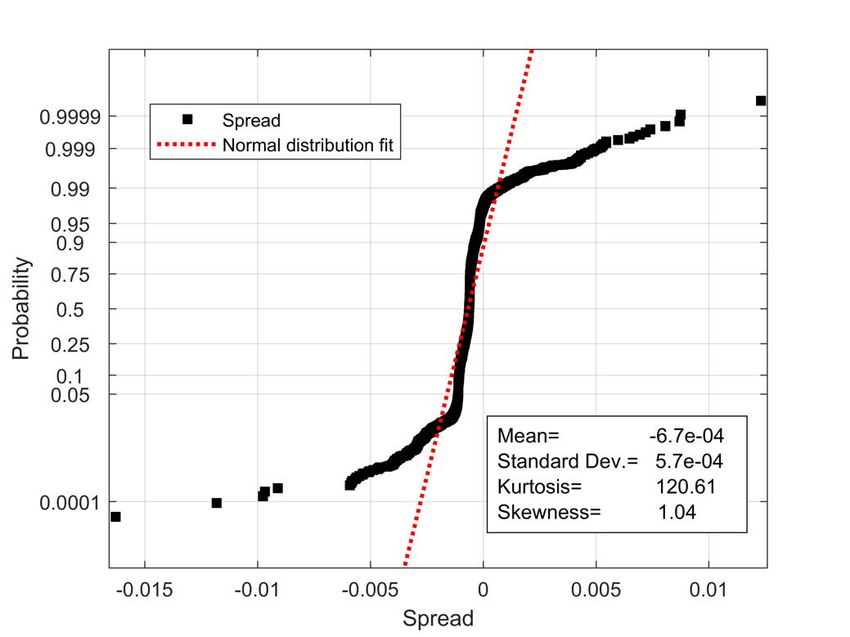
Figure 3 shows the distribution of spreads in !"# in a probability plot. As the algorithm’s
plausible implicit interest rates are set at a ±100 basis points corridor with respect to the maximum
and minimum publicly available interbank reference rates for the overnight, one-month, and three-
month maturities, most spreads in !"# are bound to approximately ±100 basis points with respect
to the overnight reference rate ( ); deviations from this bound occur when one-month and
three-month reference rates deviate from the overnight reference rate. The distribution of spreads
departs from a Normal or Gaussian distribution, with fat tails in both ends of the distribution.

 Figure 3. Probability plot of spreads in !"# .

3 The survival ratio

The survival ratio measures how persistent network relations are over time (see Onnela, et al.,
2003, Coehlo, et al., 2007). Based on Onnela, et al. (2003), León and Miguélez (2020) introduce
two survival ratios to measure how persistent interbank network relations are, namely the single-

 9
step survival ratio and the multi-step survival ratio.13 The single-step survival ratio measures the
fraction of relations found common in two consecutive networks. As it measures the persistence
of relations from time − 1 to time , it evaluates the availability of interbank funds over time.

 Let # be the set of relations of the network at time , ∩ the intersection operator, and ⟨∙⟩ the
number of elements in the set, the single-step survival ratio at time is denoted # , and is calculated
as14
 1
 # = ⟨ # ∩ #$% ⟩
 ⟨ #$% ⟩ [3]
 where
 0 ≤ # ≤ 1

 The multi-step survival ratio, ̅# , measures the long-term persistence of relations in a
network. By setting > 1 in [4], the multi-step survival ratio measures the fraction of relations
that persisted in a range of consecutive networks—without any interruption. Therefore, it evaluates
the availability of interbank funds from time − to time .

 1
 ̅# = ⟨ # ∩ #$% ⋯ ∩ #$& ⟩
 ⟨ #$& ⟩ [4]

 where
 >1
 0 ≤ ̅# ≤ 1

 The single-step and multi-step survival ratios are designed to work on unweighted networks.
As they perform calculations based on the number of relations, they are convenient to measure the

13
 Onnela et al. (2003) designed the survival ratio for trees—a special case of networks. We use the survival ratios
suggested in León and Miguélez (2020) because their ratios use the number of relations in the preceding network as
denominator, whereas Onnela et al. use the number of relations in a tree, which is the number of participants minus
one.
14
 A second-best alternative to the survival ratio is the Jaccard index (see Jaccard, 1912). It is an inferior choice because
in the Jaccard index the order of the networks is irrelevant (see León & Miguélez, 2020).

 10
extent of repeated lending in interbank networks. Consequently, the survival ratios are suitable
measures of funding availability.

 However, we aim to measure the extent of similarly priced funding availability. Therefore,
we need to transform the weighted and directed network (i.e., containing bilateral weighted
average interest rate spreads) into an unweighted and directed network, ] , that preserves the
information about the stability of interbank funding prices.

 Let !"# represent the weighted average interest rate spread Bank charges Bank at time
(as in [2]), and the maximum acceptable increase in the weighted average interest rate spread
from time − 1 to , ] is an unweighted and directed matrix of dimensions × × with
elements ]!"# such that

 0 !"# = 0,
 ⎧ ⎫
 ⎪ ⎪
 ]!"# = 0 if K !"# − !"#$% M > | !"#$% ≠0, [5]
 ⎨ ⎬
 ⎪ ⎪
 ⎩1 otherwise. ⎭

 Under this formulation, ] is an unweighted and directed matrix in which the only relations
that exist at time are those that are new or those that existed at time − 1 at a similar weighted
average spread. Consequently, when the survival ratio is applied to ], a relationship will survive
if it is found common in two consecutive networks at a similar interest rate spread; that is, under a
comprehensive market discipline criterion when funding is available at a similar price. By
construction, as becomes large, ] converges into , which corresponds to a customary approach
to interbank relationship lending—based on the availability of new funds only.

4 Main results

The main results are divided into three parts. First, we briefly present and analyze the main
connective features of the interbank lending network , which is the main input of our work.

 11
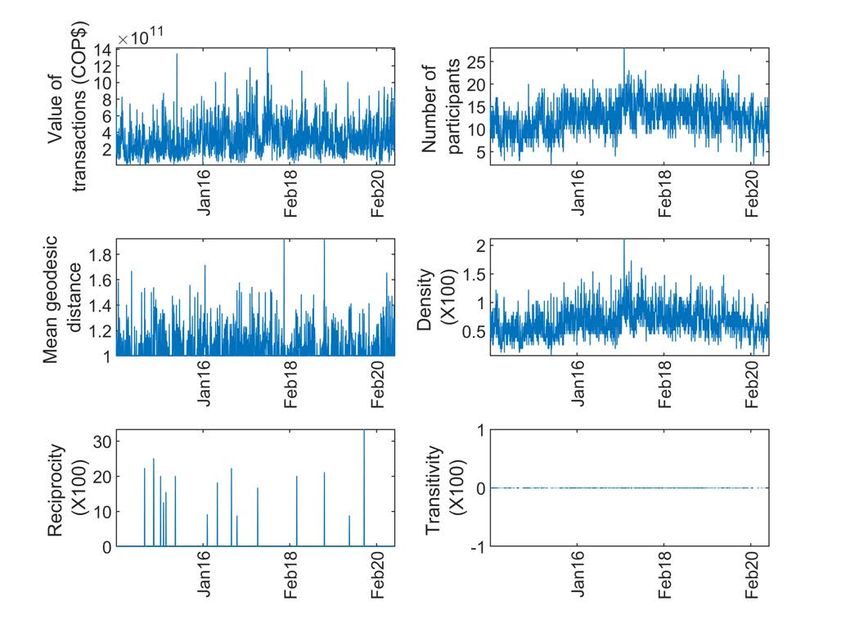
Second, we present the results obtained when applying the survival ratio to the matrix ], which is
a subproduct of the interbank lending network ; as before, ] is an unweighted and directed
matrix that represents the availability of funding at similar prices. Third, we test whether the
attained survival ratios significantly differ from those corresponding to a null (i.e., randomly
rewired) network.

4.1 The main connective features of the interbank lending network

The interbank lending network consists of 1,606 daily weighted and directed networks, with 40
participating banks. The main connective features of the interbank lending network are reported
in Table 1. We report the mean, standard deviation, minimum, and maximum corresponding to the
following network statistics:15 i) The number of participants (i.e., banks with at least one relation);
ii) mean geodesic distance, corresponding to the average minimum number of relations between
all pairs of reachable banks; iii) density, corresponding to the fraction of possible relations
observed in the network; iv) reciprocity, corresponding to the fraction of dyads (i.e., reciprocal
relations); and v) transitivity, corresponding to the fraction of possible triads (i.e., transitive
relations).

 Statistic Mean St. dev. Min Max
 a
 Number of participants 12.73 3.55 2.00 28.00
 b
 Mean geodesic distance 1.07 0.12 1.00 1.92
 c
 Density (× 100) 0.66 0.26 0.06 2.12
 Reciprocity (× 100) d 0.18 1.93 0.00 33.33
 Transitivity (× 100) e 0.00 0.00 0.00 0.00
 nd th a
 Table 1. Networks’ descriptive statistics, from January 2 , 2014 to August 4 , 2019. Number
 of banks with at least one relation; b average minimum number of relations between all pairs of
 reachable banks; c fraction of possible relations observed in the network, under the assumption
 of no self-relations; d fraction of relations that are reciprocated; e fraction of transitive relations
 observed in the network.

15
 In network analysis, there are many different descriptive statistics (see Newman, 2009). We focus on those that are
relevant to our aim. We purposely avoid statistics related to the distribution of relations or the network importance
(i.e., centrality) of participants in the network because they are beyond our scope.

 12
Table 1 suggests that Colombian interbank networks share most of the connective features
reported in related literature (see Furfine, 1999, Bech & Atalay 2010, Fricke & Lux, 2014, Craig
& von Peter, 2014, Molina-Borboa, et al., 2015, Hüser, 2016). Also, the most salient connective
features correspond to those reported in previous studies related to the Colombian interbank market
(see León, et al., 2018, León & Miguélez, 2020). It is a low density (i.e., sparse) network, with less
than 1 percent of all potential relations. The mean geodesic distance is low, consistent with small-
world networks. Relations do not tend to be reciprocal; this is an expected finding as it should be
unusual to find reciprocated lending in a single day. And, no transitive relations are to be found.
Figure 4 exhibits the time series corresponding to the statistics reported in Table 1.

 Figure 4. Time series of networks’ descriptive statistics, from January 2nd, 2014 to
 August 4th, 2019.

4.2 The survival ratio of the interbank lending network

The single-step and multi-step survival ratios are applied to the matrix ]. As in [5], matrix ] is an
unweighted and directed matrix that represents the availability of interbank funding at similar
prices. To build matrix ], the threshold for what a similar spread is, , is to be defined; as before,

 13
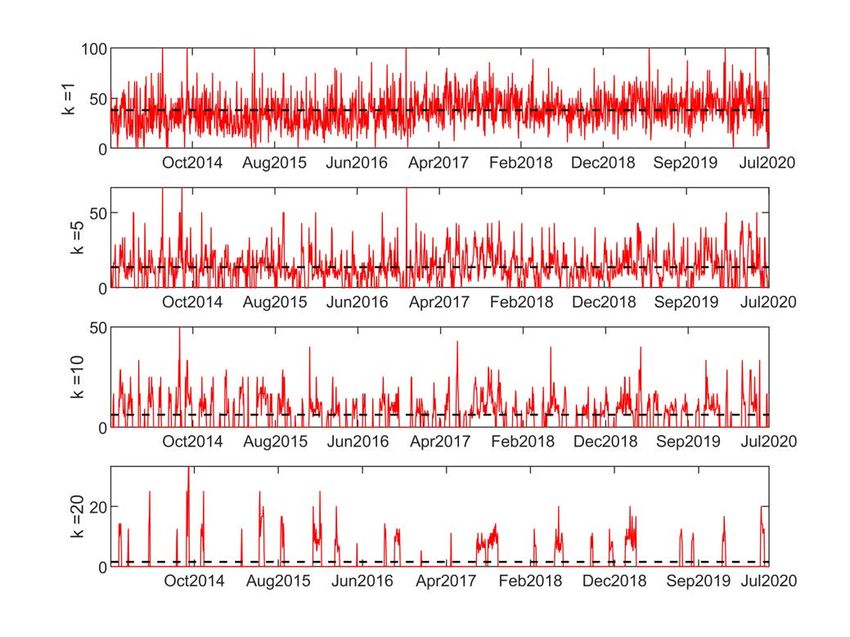
an increase in spread higher than marks a break in the interbank relation. We use five different
thresholds, = 0.0000, 0.0001, 0.0005, 0.0010, 0.0100, corresponding to increases of 0, 1, 5,
10, and 100 basis points in the spread with respect to . For example, if = 0.0000, any
increase in the spread that Bank A charges to Bank B would result in a break in their relationship
by the unavailability of funds at similar prices. Therefore, the higher , the easier to find available
funding at a similar price.

 Figure 5 exhibits the single- and multi-step survival ratios under a threshold set to =
0.0010, corresponding to a 10 basis points increase in the spread with respect to . The
single-step survival ratio corresponds to interbank relations that survive from one day to the next
( = 1), whereas the multi-step corresponds to three ranges of consecutive networks, namely one-
week ( = 5), two-week ( = 10), and four-week ( = 20) ranges. The discontinuous lines
correspond to the mean.

 Figure 5. Time series of single-step ( = 1) and multi-step ( = 5, 10, 20) survival ratios
 (× 100) when = 0.0010, from January 2nd, 2014 to August 4th, 2019. The discontinuous
 lines correspond to the mean.

 14
As expected, Figure 5 shows that the single-step survival ratio ( = 1) is the highest. On
average, when = 0.0010, about 38 percent of relations survive from one day to the next. That
is, when the availability in interbank relations is restricted to lending transactions whose spread do
not increase more than 10 basis points from day − 1 to , about 38 percent of relations persist.
As increases, the survival ratio decreases. On average, the survival ratio is about 13.71, 6.19,
and 1.56 percent as the range is set to = 5, 10, 20, respectively.

 This suggests that the relations between financial institutions in the Colombian interbank
networks are not occasional: There is repeated funding at similar prices on consecutive days.
Nevertheless, it is apparent that for the two-week and four-week ranges (i.e., = 10, 20) the
persistence in interbank lending transactions tends to be low.

 Table 2 reports descriptive statistics for the single- and multi-step survival ratios (i.e., =
1, 5, 10, 20) for different choices of , namely = 0.0000, 0.0001, 0.0005, 0.0010, 0.0100. For
comparison purposes, we also report the descriptive statistics for → ∞, corresponding to a
customary approach to interbank relationship lending—based on the availability of new funds
only.

 When the availability of funding is restricted to lending transactions whose spread does not
increase ( = 0.0000), on average 16.12 percent of relations persist from one day to the next. In
the case of multi-step survival ratios, on average, no relations persist. Nevertheless, this a severe
and impractical scenario because minor changes in the spread may arise from factors unrelated to
market discipline, e.g., changes in the maturity of lending and the rounding of interest rates.

 15
Survival ratio (X100) Mean St. dev. Min Max
 = 1 16.12 16.07 0.00 100.00
 =5 0.22 2.08 0.00 33.33
 = 0.0000
 = 10 0.00 0.00 0.00 0.00
 = 20 0.00 0.00 0.00 0.00
 = 1 36.25 16.95 0.00 100.00
 =5 11.64 10.43 0.00 50.00
 = 0.0001
 = 10 4.40 6.99 0.00 42.86
 = 20 0.79 2.80 0.00 25.00
 = 1 37.80 16.46 0.00 100.00
 =5 13.19 10.55 0.00 50.00
 = 0.0005
 = 10 5.70 7.43 0.00 42.86
 = 20 1.49 4.04 0.00 33.33
 = 1 38.08 16.45 0.00 100.00
 =5 13.71 10.73 0.00 66.67
 = 0.0010
 = 10 6.19 7.70 0.00 50.00
 = 20 1.56 0.41 0.00 33.33
 = 1 38.33 16.43 0.00 100.00
 =5 14.11 10.75 0.00 66.67
 = 0.0100
 = 10 6.69 7.96 0.00 50.00
 = 20 1.79 4.41 0.00 33.33
 = 1 38.33 16.43 0.00 100.00
 =5 14.11 10.75 0.00 66.67
 →∞
 = 10 6.69 7.96 0.00 50.00
 = 20 1.79 4.41 0.00 33.33
 Table 2. Descriptive statistics for single-step ( = 1) and multi-step ( = 5, 10, 20) survival
 ratios when = 0.0000, 0.0001, 0.0005, 0.0010, 0.0100, from January 2nd, 2014 to August
 4th, 2019.

 When the threshold is set to = 0.0001, on average, 36.25 percent of funding relations
persist from one day to the next, whereas 11.64, 4.40, and 0.79 persist in one-week, two-week, and
three-week periods. Therefore, admitting a slight increase in the lending spread results in an
important increase in the availability of interbank funding at similar prices.

 When the threshold is further increased, on average, about 38 percent of relations persist
from one day to the next for all choices of , whereas about 14, 6, and 2 percent persist in one-
week, two-week, and three-week periods. Therefore, increasing the threshold from = 0.0005 to
 = 0.0100 causes a negligible increase in all survival ratios.

 16
When → ∞, results do not change with respect to setting = 0.0100. That is, allowing a
spread increase of 100 basis points is enough for converging to a customary approach to interbank
relationship lending where the price of funds is irrelevant.

 The minor increase in the survival ratios when increasing the threshold from = 0.0005 to
 → ∞ could be related to a previous finding by Furfine (2001). When Furfine studied the United
States’ interbank market, he reported that high counterparty risk does not cause high funding prices
but the unavailability of funds. That is, unsecured funding availability will cease as a bank will not
lend to a high-risk bank at any price. The extremely short maturity of unsecured interbank lending
may account for this finding. First, banks are able to halt lending rapidly (King, 2008). Second,
the revenue from charging a significantly high price for overnight lending to a risky counterparty
is negligible with respect to the principal (Furfine, 2001). Besides, from the borrower’s
perspective, likely, a high-risk bank will not borrow at a high price to avoid negative signaling to
the market.

4.3 A test for randomness of results

From a comprehensive market discipline perspective, results reported in Figure 5 and Table 2
suggest that a sizeable fraction of the relations between banks in the Colombian interbank networks
are available at a similar price. In turn, this provides evidence of interbank relationship lending.
Nevertheless, it is advisable to test whether results deviate significantly from a random allocation
of relations between banks; if they don’t, results may be attributable to a simple coincidence.

 To perform this test, we build a null model for the interbank networks. We perform limited
randomization of the interbank networks in ] by randomly rewiring relations from lending to
borrowing banks in each observation. 16 This preserves the main connective features of the
interbank networks while respecting the role of banks in the network. This randomization is

16
 This entails randomly shuffling observed relations among actual borrowing and lending banks. This preserves the
number of banks and relations, and the role of banks as lenders, borrowers, or both. Randomizing relations among all
banks in the network is not a sound choice because the existence of a small group of lenders and borrowers would be
neglected—making the rejection of the null hypothesis of distributional equality trivial.

 17
performed 100 times for each of the 1,606 networks in the dataset. We use the two-sample
Kolmogorov-Smirnov non-parametric test of distributional equality to determine whether results
deviate significantly from this null interbank network.

 Table 3 exhibits the mean of the single-step and multi-step survival ratios calculated on ]
(reported in Table 2) and the mean calculated on the null networks in each case (in brackets). For
brevity, we report three different choices of , namely = 0.0000, 0.0010, 0.0100. We mark
with † when the null hypothesis of equal distribution is rejected at 0.99 confidence.

 Survival ratio
 = 0.0000 = 0.0010 = 0.0100
 (X100)
 = 1 16.12 [9.03] † 38.08 [15.13] † 38.33 [15.18] †
 =5 0.22 [0.12]... 13.71 [0.60] † 14.11 [0.60] †
 = 10 0.00 [0.00] .. 6.19 [0.00] † 6.69 [0.00] †
 = 20 0.00 [0.00] .. 1.56 [0.00] † 1.79 [0.00] †
 Table 3. Mean survival ratio, from January 2nd, 2014 to August 4th, 2019. Mean
 survival ratios calculated on randomized (i.e., null) networks are reported in
 brackets. † Null hypothesis of equal distribution of inferred and randomized data
 is rejected at 0.99 confidence (i.e., p-value < 0.01) with Kolmogorov-Smirnov
 non-parametric two-sample test.

 In the scenario where = 0.0000 , the distribution of single-step survival ratios is
significantly different from those of the null networks (i.e., randomized versions of ]); that is,
randomness is not a plausible explanation for the attained single-step survival ratios. On the other
hand, the distribution of the three multi-step survival ratios with = 0.0000 is not significantly
different from those attained with randomized versions of ]. This shows that under the—severe
and impractical—scenario where interbank relations are continuous as long as their spreads do not
increase, the multi-step survival ratio of interbank relations is not significantly different from that
of randomly connected networks.

 In the following two scenarios, where = 0.0010 and = 0.0100, all distributions of
survival ratios are significantly different from those of their corresponding null networks.
Regarding the single-step survival ratios, in both scenarios, the mean is about 2.5 times the mean
of null networks, whereas, in the case of the one-week ( = 5) multi-step survival ratio, the mean

 18
is about 23 times the mean of null networks. That is, under feasible thresholds for what a similar
spread is, results show that the obtained survival ratios deviate significantly from null model
networks. Consequently, from a comprehensive market discipline perspective, it is fair to conclude
that there is evidence of interbank relationship lending in the Colombian market.

5 Final remarks

Evidence of interbank relationship lending has focused on the availability of funds. Our work goes
a step further by incorporating the price of available funds. In this vein, our work enables us to
evaluate interbank relationship lending from a comprehensive market discipline perspective,
which comprises the availability and the price of funds as the determinants of the persistence in
interbank relations.

 From this perspective, results show that the fraction of bilateral interbank funding relations
that survive at similar prices is substantial: We find that about 38 percent of relations in the
Colombian unsecured interbank lending market survive from one day to the next. As expected,
when evaluated over longer periods, interbank lending relations survive to a lesser extent. Results
are robust to changes in the threshold for what a feasible similar price is. Also, tests show that
results significantly depart from null model networks—thus, results are not attributable to
coincidence. This enables us to conclude that interbank relationship lending exists in the
Colombian market.

 Our work contributes to related literature. First, incorporating the availability of funding and
the price of funding allows for an enhanced evaluation of relationship lending in interbank markets.
In turn, this enhancement may improve explanatory modeling and dynamic modeling of interbank
markets. Second, from a financial stability perspective, our work provides a convenient method to
monitor interbank markets’ individual and market-wide trust. Third, our work adds to existing
evidence of interbank relationship lending from an augmented analytical and methodological
perspective. Fourth, we expect this method to be useful in other jurisdictions. Although we
acknowledge that the Colombian case displays certain idiosyncrasies, we expect similar results
elsewhere because market discipline is prevalent in unsecured interbank markets, whilst the main

 19
connective features of the Colombian interbank networks overlap with those reported for most
jurisdictions. Also, as relationship lending is not exclusive to interbank markets, we expect our
work to provide an enhanced general method to evaluate other types of relationship lending and
relationship banking.

 Results not only are useful to draw conclusions on the existence of interbank relationship
lending in Colombia but also are convenient to draw noteworthy general questions. First, as
highlighted at the end of Section 4.2, the negligible increase in the survival ratio when increasing
the price similarity threshold overlaps with evidence of market discipline being exerted primarily
through funds rationing—rather than through pricing (see Furfine, 2001, King, 2008). Although
further testing and analyzing this finding is beyond our aim, an interesting question arises: Is this
a stylized fact of interbank markets? Second, relationship lending and market discipline are not
limited to the interbank market. Customer relationship lending is an obvious candidate to evaluate
under our approach: Do prevailing conclusions regarding the existence of customer relationship
lending hold after incorporating the price of available funds? Also, concurrent with the former
question, is customer relationship lending exerted primarily through funds rationing too? About
relationship lending-based interbank network modeling (see Mazzarisi, et al., 2020), does
incorporating the price of funding open new mechanisms for generating networks? In our view,
the approach herein presented enables researchers to address these (and other) interesting questions
regarding market discipline and relationship lending.

 20
6 References

Affinito, M. (2012). Do interbank customer relationships exist? And how did they function in the
 crisis? Learning from Italy. Journal of Banking and Finance, 35(12), 3163-3184.
Afonso, G., Kovner, A., & Schoar, A. (2013). Trading partners in the interbank lending market.
 Federal Reserve Bank of New York Staff Reports, 620.
Arciero, L., Heijmans, R., Heuver, R., Massarenti, M., Picillo, C., & Vacirca, F. (2013). How to
 measure the unsecured money market? The Eurosystem’s implementation and validation
 using TARGET2 data. DNB Working Paper, 369, De Nederlandsche Bank.
Armantier, O. & Copeland, A. (2012). Assessing the quality of Furfine-based algorithms. Staff
 Report, 575, Federal Reserve Bank of New York.
Bharath, S., Dahiya, S., Saunders, A., & Srinivasan, A. (2007). So what do I get? The bank’s view
 of lending relationships. Journal of Financial Economics. 85, 368–419.
Bech, M.L. & Atalay, E. (2010). The topology of the federal funds market, Physica A, 389, 5223-
 5246.
Bräuning, F. & Fecht, F. (2017). Relationship lending in the interbank market and the price of
 liquidity. Review of Finance, 22(1), 33-75.
Capera-Romero, L., Lemus-Esquivel, J.S., & Estrada, D. (2015). Relaciones crediticias y riesgo
 de contagio en el mercado interbancario no colateralizado colombiano. In: Gómez-González,
 J.E. & Ojeda-Joya, J.N., (Eds.), Política Monetaria y Estabilidad Financiera en Economías
 Pequeñas y Abiertas. Banco de la República, Bogotá, pp. 559-616.
Clauset, A. & Eagle, N. (2007). Persistence and periodicity in a dynamic proximity network.
 Proceedings of the DIMACS Workshop on Computational Methods for Dynamic Interaction
 Networks (Piscataway).
Cocco, J., Gomes, F., & Martins, N. (2009). Lending relationships in the interbank market. Journal
 of Financial Intermediation, 18 (1), 24–48.
Coehlo, R., Gilmore, C.G., Lucey, B., Richmond, P., & Hutzler, S. (2007). The evolution of
 interdependence in world equity markets—Evidence from minimum spanning trees. Physica
 A, 376, 455-466.
Craig, B. & von Peter, G. (2014). Interbank tiering and money center banks. Journal of Financial
 Intermediation, 23, 322-347.
Degryse, H., Karas, A., & Schoors, K. (2019). Relationship lending during a trust crisis on the
 interbank market: A friend in need is a friend indeed. Economic Letters, 182, 1-4.
Fricke, D. & Lux, T. (2014). Core–periphery structure in the overnight money market: Evidence
 from the e-MID trading platform. Computational Economics, 45(3), 359-395.

 21
Flannery, M.J. (1998). Using market information in prudential bank supervision: A review of the
 U.S. empirical evidence. Journal of Money, Credit and Banking, 30, 273-305.
Flannery, M.J. (2001). The faces of “market discipline”. Journal of Financial Services Research.
 20:2/3, 107-119.
Furfine, C. (1999). The microstructure of the federal funds market, Financial Markets, Institutions
 and Instruments, 8, 24-44.
Furfine, C. (2001). Banks monitoring banks: evidence from the overnight federal funds market.
 Journal of Business, 74 (1), 33-58.
Guggenheim, B., Kraenzlin, S., & Schumacher, S. (2011). Exploring an uncharted market:
 Evidence on the unsecured Swiss Franc money market. SNB Working Papers, 2011-5, Swiss
 National Bank.
Heijmans, R., Heuver, R., & Walraven, D. (2010). Monitoring the unsecured interbank money
 market using TARGET2 data”, DNB Working Paper, 369, De Nederlandsche Bank.
Huang, J-C., & Huang, C-S. (2011). The effects of bank relationships on firm private
 debtrestructuring: Evidence from an emerging market. Research in International Business
 and Finance, 25, 113-125.
Hüser, A-C. (2016). Too interconnected to fail: A survey of the interbank networks literature.
 SAFE Working Paper, 91, Goethe University Frankfurt-SAFE.
Iori, G., Mantegna, R., Marotta, L., Micciché, S., Porter, J., & Tumminello, M. (2015). Networked
 relationships in the e-MID interbank market: a trading model with memory. Journal of
 Economic Dynamics and Control, 50, 98-116.
Jaccard, P. (1912). The distribution of the flora in the Alpine zone. The New Phytologist, XI(2),
 37-50.
King, T.B. (2008). Discipline and liquidity in the interbank market. Journal of Money, Credit, and
 Banking, 40, 295-317.
Kyriakopoulos, F., Thurner, S., Puhr, C., & Schmitz, S. (2009). Network and eigenvalue analysis
 of financial transaction networks. The European Physical Journal B, 71, 523-531.
Kobayashi, T. & Takaguchi, T. (2018). Identifying relationship lending in the interbank market:
 A network approach. Journal of Banking and Finance, 97, 20-36.
León, C. & Miguélez, J. (2020). Interbank relationship lending in Colombia. Borradores de
 Economía, 1118, Banco de la República.
León, C., Cely, J., & Cadena, C. (2016). Identifying interbank loans, rates, and claims networks
 from transactional data. Lecturas de Economía, 85, 91-125.
León, C., Machado, C., & Sarmiento, M. (2018). Identifying central bank liquidity super-spreaders
 in interbank funds networks. Journal of Financial Stability, 35, 75-92.

 22
Lončarski, I. & Marinč, M. (2020). The political economy of relationship banking. Research in
 International Business and Finance, 51, 101078.
Mazzarisi, P., Barucca, P., Lillo, F., & Tantari, D. (2020). A dynamic network model with
 persistent links and node-specific latent variables, with an application to the interbank
 market. European Journal of Operational Research, 281, 50-65.
Millard, S. & Polenghi, M. (2004). The relationship between the overnight interbank unsecured
 loan market and the Chaps sterling system. Bank of England Quarterly Bulletin, Q1, Bank
 of England.
Molina-Borboa, J.-L., Martínez-Jaramillo, S., López-Gallo, F., & van der Leij, M. (2015). A
 multiplex network analysis of the Mexican banking system: link persistence, overlap and
 waiting times. Journal of Network Theory in Finance, 1(1), 99-138.
Newman, M.E.J. (2010). Networks: An Introduction. Oxford University Press. New York.
Nier, E. & Baumann, U. (2006). Market discipline, disclosure and moral hazard in banking.
 Journal of Financial Intermediation, 15, 332-361.
Onnela, J.P., Chakraborti, A., & Kaski, K. (2003). Dynamics of market correlations: Taxonomy
 and portfolio analysis. Physical Review E, 68.
Petersen, M.A. & Rajan, R.G. (1994). The benefits of lending relationships: evidence from small
 business data, The Journal of Finance, XLIX (1), 3-37.
Rochet, J.C. & Tirole, J. (1996). Interbank lending and systemic risk. Journal of Money Credit and
 Banking, 28(4), 733-762.
Sarmiento, M. (2016). Market discipline and liquidity risk: Evidence from the interbank funds
 market. Graduate Institute of International and Development Studies Working Paper, 14,
 Graduate Institute of International and Development Studies-Geneva.
Sarmiento, M., Cely, J., & León, C. (2017). An early warning indicator system to monitor the
 unsecured interbank funds market. Research in International Business and Finance, 40, 114-
 128.
Temizsoy, A., Iori, G., & Montes-Rojas, G. (2015). The role of bank relation in the interbank
 market. Journal of Economic Dynamics & Control, 59, 118-141.

 23
You can also read