INDIA'S AIR TRANSPORT SECTOR - THE FUTURE IS BRIGHT BUT NOT WITHOUT ITS CHALLENGES - Global Aviation Summit

Page created by Mark Jones
 
CONTINUE READING
INDIA'S AIR TRANSPORT SECTOR - THE FUTURE IS BRIGHT BUT NOT WITHOUT ITS CHALLENGES - Global Aviation Summit
INDIA’S AIR TRANSPORT SECTOR
    THE FUTURE IS BRIGHT…
BUT NOT WITHOUT ITS CHALLENGES
           January 2019
INDIA'S AIR TRANSPORT SECTOR - THE FUTURE IS BRIGHT BUT NOT WITHOUT ITS CHALLENGES - Global Aviation Summit
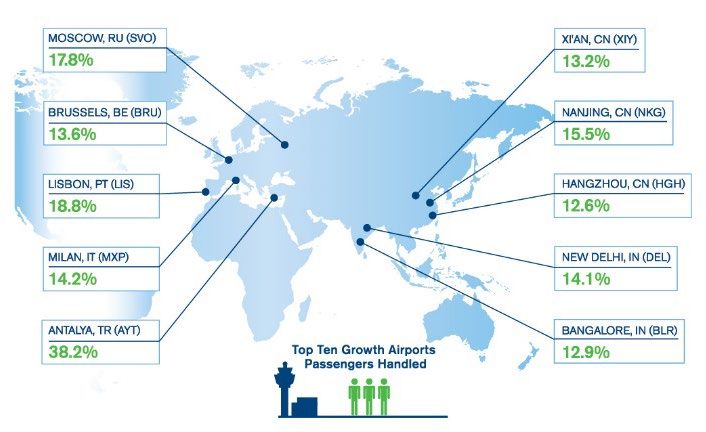
Preface

In a country where train travel has long been the dominant mode of transport, India’s aviation sector has
increasingly established itself as a safe, affordable and credible alternative. The number of passengers flown
by Indian airlines has more than doubled over the past seven years, compared with just a 6% rise in railway
passengers 1.

Moreover, as the world’s largest democracy with a population of more than 1.3 billion citizens, India’s
potential for further growth and industry development is very clear. Indeed, we expect air passenger
numbers to, from and within India to increase by 3.3x over the next 20 years, to more than 500 million
passenger journeys per year.

This significant expansion is expected to be underpinned by a trebling in the proportion of middle-class
households and further increases in time-saving options for air passengers. This highlights the important role
aviation can play in connecting the country – both internally and with the rest of the world.

This strong growth outlook for air passenger demand will see India overtake Germany, Japan, Spain, and the
UK within the next 10 years to become the world’s third largest air passenger market.

These are exciting times for the air transport industry in India.

Of course, the future will not be without challenges – for those in the industry and policy-makers and
regulators alike. These challenges will include making sure that the right type of infrastructure is put into
place, at the right time and in the right location to ensure that the demand can be met, as well as ensuring
that the regulatory environment is one which successfully fosters a competitive and healthy airline transport
sector that will continue to make a major contribution to the Indian economy in the years to come. A robust
and financially sound industry is critical to delivering the benefits that aviation can bring – creating jobs,
bringing families together, facilitating business, and supporting trade, investment and economic growth.

Events such as this Global Aviation Summit 2019 show that the importance of the industry is well-understood
in India and underscores the initiatives that are already being taken to position the country for the key role
it will increasingly have in global aviation leadership. It is my pleasure to contribute this assessment to the
Summit.

Brian Pearce
Chief Economist
International Air Transport Association
Geneva
January 2019

1http://www.indianrailways.gov.in/railwayboard/uploads/directorate/stat_econ/IRSP_2016-
17/Facts_Figure/Fact_Figures%20English%202016-17.pdf
INDIA'S AIR TRANSPORT SECTOR - THE FUTURE IS BRIGHT BUT NOT WITHOUT ITS CHALLENGES - Global Aviation Summit
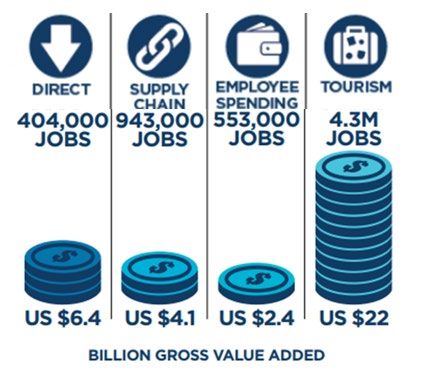
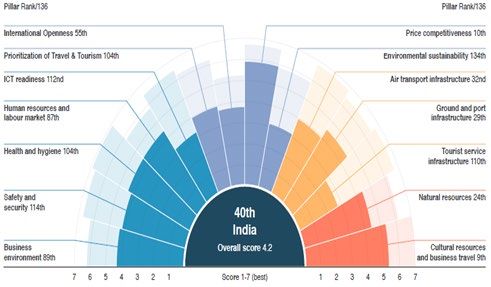
Table of Contents
Preface ................................................................................................................................................................. i

India’s air transport industry; a global perspective ............................................................................................ 1

Recent developments ......................................................................................................................................... 1

   India’s Domestic air transport market............................................................................................................ 2

   India’s International air transport market ...................................................................................................... 5

   India’s air cargo market .................................................................................................................................. 7

Business models & industry structures continue to evolve ............................................................................... 8

Financial performance ........................................................................................................................................ 9

The value of air transport to India ....................................................................................................................10

   7.5m jobs and a $30bn contribution to GDP ................................................................................................10

Looking forward................................................................................................................................................11

   Sound fundamentals point to a bright future ..............................................................................................11

The policy environment matters ......................................................................................................................13

   Air passenger forecast scenarios ..................................................................................................................13

   National Civil Aviation Policy ........................................................................................................................14

   Travel & Tourism Competitiveness ..............................................................................................................14

   Ease of Doing Business .................................................................................................................................15

Concluding comments ......................................................................................................................................16
India’s air transport industry; a global perspective
•        The Indian air transport sector has shown very strong growth in recent years – particularly on the
         domestic market segment.

•        In October 2018, the domestic India market recorded its 50th consecutive months of double-digit year-
         on-year growth; an outstanding performance and one which is showing no signs of ending anytime soon.

•        The air transport market in India employs more than 400,000 people and supports another 940,000
         more in the supply chain. Overall the industry contributes some US$35 billion annually to India’s GDP.

•        The fundamental drivers of air passenger demand – including population and demographics and
         increasing incomes – are favorable and supportive of ongoing growth over the longer-term.
•        Over the next 20 years IATA forecasts growth of 6.6% per year on average – the number of annual air
         passenger journeys is forecast to increase by more than 414 million over the period, moving to
         over570 million journeys in 2037.
•        The industry must continue to work constructively with its key stakeholders – including the government
         and policy-makers – to ensure that this sizeable increase in demand can be met and to realise the full
         benefits that the air transport industry can deliver to India.

Recent developments                                                                     Figure 2: Annual growth in India’s O-D air
                                                                                        passenger journeys
In 2017, more than 158 million passengers flew on
                                                                                                % growth year-on-year
routes to, from and within India (Figure 1). This                                        30%

represents an increase of almost 15% over 2016                                           25%

and is the third consecutive year of growth in the                                       20%

                                                                                         15%
order of 15-20% per year (Figure 2).
                                                                                         10%

The figures for the 2018 year-to-date suggest that                                        5%

India is on track to record a fourth straight year of                                     0%

double-digit passenger growth.                                                           -5%

                                                                                         -10%
Figure 1: Total air passenger journeys to, from &                                               2007   2008   2009      2010   2011   2012   2013   2014   2015   2016   2017

within India (annual) 2                                                                 Source: IATA
        Million pax per year
 180
                                                                                        The strong performance of air passenger demand
 160

 140
                                                                                        growth in India has not been confined to just the
 120                                                                                    past few years, however; the total number of air
 100                                                                                    passengers has more than doubled over the past
  80
                                                                                        seven years, from a level of 79 million journeys
  60

  40
                                                                                        undertaken in 2010.
  20
                                                                                        Indeed, utilising data from the World Bank and
    0
         2007    2008    2009   2010   2011   2012   2013   2014   2015   2016   2017   ICAO, which measures the number of passengers
Source: IATA                                                                            carried by airlines based in the particular country,
                                                                                        we can see the growth of the Indian market in a
                                                                                        longer-term perspective (Figure 3, over).
                                                                                        From flying just 16 million passengers 20 years
                                                                                        ago, Indian airlines have seen their passenger

2 Unless stated otherwise, all data in this report are
calculated on an origin-destination (O-D) basis.
                                                                                                                                                                           1
volumes increase more than 8-fold in the period                                                Figure 5: Evolution of market share: Domestic vs
since. Along the way, India has overtaken a host of                                            International
countries, including Germany and Japan, in the                                                  100%
                                                                                                90%
process.                                                                                        80%
                                                                                                70%
Placed in this longer-term context, the relative
                                                                                                60%
performance of the air transport industry in India                                              50%

is stark.                                                                                       40%
                                                                                                30%

Figure 3: Increases in air passenger demand,                                                    20%
                                                                                                10%
1997-2017, selected countries                                                                    0%
         Passengers carried by airlines based in each country (million)                            2007   2008     2009    2010   2011 2012 2013   2014   2015    2016   2017
160                                                                                                                                  DOM INT
                                                                                   UK
140                                                                                India       Source: IATA
120                                                                                Japan

100
                                                                                   Germany     Reflecting the relative size of the domestic and
                                                                                   Brazil
    80                                                                                         international markets, the composition of the
                                                                                   Canada
    60
                                                                                   Korea       current in-service fleet is heavily tilted towards
    40                                                                             Australia   narrowbody aircraft.
    20                                                                             Spain

                                                                                   France      Narrowbodies account for ¾ of the total current
     0
      1997                                 2007                           2017                 fleet, with widebodies contributing a further 10%.
Source: World Bank, ICAO
                                                                                               The remainder consists primarily of turboprops
Returning to more recent outcomes, it is                                                       and regional jet aircraft (Figure 6).
unsurprising to note that the bulk of the flights                                              Figure 6: Composition of India’s current aircraft
taken in 2017 were domestic in nature, accounting                                              fleet
for around 62% of the total (Figure 4).
                                                                                                                 Other*, 14.2%

Figure 4: Composition of 2017 air travel: Domestic
vs International
                                                                                                  Widebody, 9.9%

    International
         38%                                                                                                                                                     Narrowbody,
                                                                                                                                                                    75.9%

                                                                             Domestic          Source: CAPA * incl turboprops and regional jets
                                                                                 62%

                                                                                               The following sections investigate the recent
                                                                                               performance and key developments for the
Source: IATA
                                                                                               domestic and international market segments in
Indeed, the domestic share of total traffic has                                                turn.
been generally increasing gradually over the past                                              India’s Domestic air transport market
decade. From 54.5% in 2007, and notwithstanding
                                                                                               The India domestic market is currently the fastest
some bumps along the way, the domestic share
                                                                                               growing (measured in terms of revenue passenger
has gradually risen to the 61.7% level of 2017
                                                                                               kilometres 3) of the main domestic markets that
(Figure 5).
                                                                                               IATA consistently track around the world.

3Revenue passenger kilometres (RPKs) is a measure of the
volume of passengers carried by an airline. An RPK is flown
when a revenue (paying) passenger is carried one kilometre.
                                                                                                                                                                          2
Over the year to June 2018, the India domestic                                         Figure 9: Annual growth in origin-destination
market has grown by a very strong 17.6%, well                                          passenger journeys – India Domestic
above the industry-wide (domestic markets) pace                                         40%
                                                                                                  % growth year-on-year

of 7.9% (Figure 7).
                                                                                        30%

Figure 7: Comparison of key global domestic                                             20%
market RPK growth
                                                                                        10%

                                                                                         0%

                                                                                        -10%

                                                                                        -20%
                                                                                                 2007    2008    2009     2010   2011   2012   2013   2014   2015   2016   2017

                                                                                       Source: IATA

                                                                                       While such rapid growth cannot continue
                                                                                       indefinitely, equally, there are no indications that
                                                                                       the performance is likely to come to an abrupt end
Source: IATA
                                                                                       anytime soon.
October 2018 was the 50th consecutive month of                                         Highlighting this point, and the magnitude of the
double-digit growth in India domestic passenger                                        potential growth in the India domestic market, the
volumes, surpassing the four-year milestone.                                           number of domestic journeys undertaken in 2017
In 2017, there were a total of 97.7 million                                            represents just 7.3% of India’s total population.
domestic passenger journeys, up almost                                                 The strong demand outcomes over recent years
15 million from 83 million in 2016 (Figure 8).                                         have been partly due to the stimulus of lower
Figure 8: Number of origin-destination air                                             airfares.
passenger journeys per year – India Domestic                                           In real (inflation-adjusted) terms, the average cost
 120
       Million pax per year
                                                                                       of an India domestic airfare has been trending
 100
                                                                                       lower for more than a decade.

 80                                                                                    After rising in 2013 and 2014 which, again, in large
 60
                                                                                       part reflects the impact of the market disruption
                                                                                       associated with the demise of Kingfisher, the
 40
                                                                                       downwards trend has since resumed.
 20
                                                                                       Figure 10: Average India Domestic airfare,
  0
        2007    2008    2009   2010   2011   2012   2013   2014   2015   2016   2017   adjusted for inflation
                                                                                               Index, 2005=100
Source: IATA                                                                           100
                                                                                        90

Growth in the India domestic market has been                                            80
                                                                                        70
faster than that of the total market depicted                                           60
previously in Figure 2.                                                                 50
                                                                                        40
Following two lean years in 2012 and 2013 (in part                                      30

reflecting the demise of Kingfisher), growth has                                        20
                                                                                        10
recovered strongly.                                                                      0
                                                                                          2005 2006 2007 2008 2009 2010 2011 2012 2013 2014 2015 2016 2017
In both 2015 and 2016, India domestic RPKs grew
                                                                                       Source: IATA
by more than 20% and in 2017, although the pace
of growth eased moderately, it still recorded a                                        India domestic passenger demand is also being
very strong 17.6% rate (Figure 9). Growth for 2018                                     driven in part by rapid expansion in the domestic
is on course to surpass this figure.                                                   air network.

                                                                                                                                                                              3
This is evident both in terms of a strong rise in the                                                                                      Against this backdrop of developments in demand
number of airport pairs in operation within India –                                                                                        and capacity, the India domestic passenger load
these have risen by more than 50% since 2015 – as                                                                                          factor remains elevated.
well as increases in the average frequency of
                                                                                                                                           Indeed, in February 2018, it exceeded 90% for the
flights on each route (Figure 11).
                                                                                                                                           first time ever, hitting an all-time high for the
Both of these factors ultimately translate into time                                                                                       seven global domestic markets 4 that we track each
savings for passengers and therefore have similar                                                                                          month (Figure 13).
stimulatory impacts on demand as reductions in
                                                                                                                                           Figure 13: Domestic India – passenger load factor
air fares.
                                                                                                                                           performance
Figure 11: Components of India’s domestic air                                                                                              95% % of available seat kilometres                        Domestic passenger load factors
                                                                                                                                                                                                                                                            Domestic India
network growth: new routes vs increased                                                                                                    85%
                                                                                                                                                   The shaded area shows the min/max load factor range for
                                                                                                                                                   the 7 global domestic markets we track each month.

frequency*
                                                                                                                                           75%
           Number of airport pairs                                                         Number of flights per week
    700                                                                                                                               36
                                                                                                                                           65%
                                                                                                                                      34
                         Domestic routes (# airport pairs in operation), left axis
    600                                                                                                                               32   55%
                         Average flight frequency, right axis                                                                                                                                                                                Failure of
                                                                                                                                                                                                   Tōhoku earthquake                         Kingfisher
                                                                                                                                      30                                                              impact in Japan
                                                                                                                                           45%                                                                                               Airlines
    500
                                                                                                                                      28                       9/11                  SARS impact in China
                                                                                                                                      26   35%
    400                                                                                                                                          2000
                                                                                                                                                        2001
                                                                                                                                                                2002
                                                                                                                                                                       2003
                                                                                                                                                                              2004
                                                                                                                                                                                     2005
                                                                                                                                                                                            2006
                                                                                                                                                                                                   2007
                                                                                                                                                                                                          2008
                                                                                                                                                                                                                 2009
                                                                                                                                                                                                                        2010
                                                                                                                                                                                                                               2011
                                                                                                                                                                                                                                      2012
                                                                                                                                                                                                                                              2013
                                                                                                                                                                                                                                                     2014
                                                                                                                                                                                                                                                            2015
                                                                                                                                                                                                                                                                   2016
                                                                                                                                                                                                                                                                          2017
                                                                                                                                                                                                                                                                                 2018
                                                                                                                                      24

    300                                                                                                                               22   Source: IATA
                                                                                                                                      20

    200
           2005 2006 2007 2008 2009 2010 2011 2012 2013 2014 2015 2016 2017 2018
                                                                                                                                      18
                                                                                                                                           The bigger picture is that the current load factor
Source: SRS Analyser                                  * aircraft >19 seats, at least 1 flight
                                                                                                                                           performance represents a significant turnaround
per week on average                                                                                                                        from the early-2000s when India regularly posted
                                                                                                                                           the lowest domestic passenger load factor
Overall, India domestic demand (measured by                                                                                                amongst our group of countries, even dipping
RPKs) have grown faster than the corresponding                                                                                             below 50% on occasion.
rate of capacity growth (measured by available
                                                                                                                                           The evolution and maturity of India’s domestic air
seat kilometers or ASKs) in recent years.
                                                                                                                                           transport market can be illustrated by comparing
While the degree of outperformance has                                                                                                     the experiences around the time of 9/11 with that
moderated from that seen in late-2014 and early-                                                                                           of late 2014.
2015, annual RPK growth has still exceeded that of
                                                                                                                                           In the former, domestic capacity continued to
ASK growth by 3 percentage points on average
                                                                                                                                           increase even as demand slumped, while in late-
each month over the past two years (Figure 12).
                                                                                                                                           2014 Indian airlines slowed capacity growth to
Figure 12: India Domestic – passenger demand                                                                                               support the load factor even as demand was
(RPKs) and capacity (ASKs)                                                                                                                 growing strongly.
            % year-on-year
    60%
                                                                                                                                           In part, this appears to reflect the increasing
    50%

    40%
                                                                                                                                           influence of competitive (market) pressures over
                                                                                 Revenue passenger kilometres
    30%                                                                                                                                    time via a mix of policy, regulatory and industry
    20%
                                                                                                                                           developments.
    10%

     0%                                                                                                                                    Such forces have instilled a greater focus on
                                                                                                       Available seat kilometres
    -10%
                                                                                                                                           airlines to achieve the load factor levels needed to
    -20%

    -30%
                                                                                                                                           generate adequate returns for their investors.
           2001

                  2002

                         2003

                                2004

                                       2005

                                              2006

                                                     2007

                                                            2008

                                                                   2009

                                                                          2010

                                                                                  2011

                                                                                         2012

                                                                                                2013

                                                                                                       2014

                                                                                                              2015

                                                                                                                     2016

                                                                                                                            2017

                                                                                                                                   2018

Source: IATA

4
    India, China, the US, Brazil, Russia, Japan and Australia.

                                                                                                                                                                                                                                                                                 4
Figure 14 puts the strong and sustained growth                                         Figure 16: World’s top ten growth airports 2017 –
performance of the India domestic market into a                                        passengers handled
global perspective.
Since 2014, in terms of RPKs flown India has
overtaken Australia, Japan, Brazil, and Russia – all
of the main domestic markets that we follow, with
the exception of China.
The India domestic market now accounts for
around 1.5% of total industry-wide RPKs and is
larger than all of the domestic markets that we
follow, with the exception of China and the US.
                                                                                       Source: ACI, IATA WATS
Figure 14: Main global domestic air transport
markets, share of industry-wide RPKs
1.6%
       % of industry-wide RPKs
                                                                                       India’s International air transport
1.5%
                                                                        India
                                                                                       market
1.4%
                                   Russia
1.3%
                                                                                       In 2017, around 60 million international
1.2%
                                              Japan
                                                                          Brazil
                                                                                       passengers flew to/from India, up from 55 million
1.1%                                                                                   in 2016 (Figure 17).
1.0%
                                                              Australia                Figure 17: Number of origin-destination air
0.9%
                                                                                       passenger journeys per year – India International
0.8%
    2010         2011       2012   2013     2014       2015      2016           2017         Million pax per year
                                                                                        70
Source: IATA
                                                                                        60

Furthermore, of the 100 largest domestic city pair                                      50

routes in the world in 2017, ten can be found in                                        40

India (Figure 15).                                                                      30

                                                                                        20
Figure 15: Largest city-pair routes Within India &
                                                                                        10
their 2017 global ranking
                                                                                         0
                                                                                              2007    2008    2009   2010   2011   2012   2013   2014   2015   2016   2017
                                   #pax 2017 YoY growth Global rank
 1     Mumbai-Delhi                5,566,510           1.9%               7            Source: IATA
 2     Bangalore-Delhi             3,492,889          -1.5%               20
 3     Bangalore-Mumbai            2,716,801           3.0%               35           While the international market has not grown as
 4     Kolkata-Delhi               2,153,297           5.6%               52
 5     Delhi-Pune                  1,997,165          17.5%               63           fast as its domestic counterpart, the sustained
 6     Delhi-Hyderabad             1,891,240           3.8%               75           period of robust growth, over a number of years,
 7     Delhi-Chennai               1,836,447          -5.4%               80
                                                                                       is still readily evident.
 8     Mumbai-Goa                  1,748,145          -0.2%               89
 9     Mumbai-Chennai              1,717,468          5.1%                91
                                                                                       The 2017 outcomes represents an increase of
10     Delhi-Goa                   1,692,230          23.6%               96
                                                                                       10.3% on 2016 and is the third consecutive year of
Source: IATA WATS
                                                                                       double-digit international passenger growth
In a similar way, of the top 10 growth airports in                                     (Figure 18).
terms of passengers handled in 2017, two are
located in India, namely Delhi and Bangalore
(Figure 16).
In terms of global rankings, Delhi is #16 globally in
terms of passengers handled and Mumbai is #29.

                                                                                                                                                                         5
Figure 18: Annual growth in origin-destination                                                  pairs has been increasing, so too have the average
passenger journeys – India International                                                        number of flights on the international city pair
 20%
         % growth year-on-year                                                                  routes (Figure 20).

 15%
                                                                                                Figure 20: Average flight frequencies on
                                                                                                international airport pairs served, selected
 10%
                                                                                                countries
                                                                                                     Average flight frequencies (per week per int'l airport pair)
   5%                                                                                           14

                                                                                                                                                                         India
                                                                                                12                                                                                           12.1
   0%
                                                                                                10                                                                         Brazil
                                                                                                                                                                                              8.6
  -5%                                                                                                                                                      China                              8.4
                                                                                                 8
         2007    2008    2009     2010    2011    2012    2013   2014    2015   2016   2017
                                                                                                                                                                                              7.1
Source: IATA                                                                                     6
                                                                                                                                                                Russia

                                                                                                 4

Contributing to this growth performance, India                                                   2
has steadily increased the number of overseas city                                               0
pairs served by a non-stop service from the                                                       2005 2006 2007 2008 2009 2010 2011 2012 2013 2014 2015 2016 2017 2018

                                                                                                Source: IATA, SRS Analyser
country over time (Figure 19).
In 2018, there are 304 such international pairs, up                                             In contrast to both China and Russia, India is well
from around 230 ten years ago.                                                                  served by the frequency of flights on the
                                                                                                international markets served.
Figure 19: Non-stop international airport pairs
served, selected countries                                                                      India has almost four additional frequencies per
1,200
        Non-stop int'l airport pairs served                                                     week on average between the airport pairs
                                                                                         1030   compared with both Russia and China.
1,000

 800
                                                                      China                     A choice of flight times is particularly important for
                                                                                                business travelers who value the flexibility the
 600
                                                             Russia
                                                                                          576
                                                                                                additional frequencies provide.
 400
                                                         India                            304   The bulk of international traffic is to the Middle
 200
                                         Brazil                                           149   East and Asian destinations, with these two
   0                                                                                            markets accounting for around 70% of the total
    2005 2006 2007 2008 2009 2010 2011 2012 2013 2014 2015 2016 2017 2018

Source: IATA, SRS Analyser                                                                      share of international traffic from India in 2017
                                                                                                (Figure 21).
In relative terms, the India market appears to have
                                                                                                Figure 21: Share of international traffic by
considerably less international city pairs served
                                                                                                continent, 2017
than either China or Russia.                                                                                                                         Sth America,
                                                                                                                                    Africa, 2.8%
                                                                                                                                                         0.2%
                                                                                                                  Nth America,
However, Indian travelers have ready access (via                                                                     11.6%

the geographic proximity) to the Middle East
super-connector hubs – Dubai, Abu Dhabi and
Doha – that China and Russia do not.                                                                  Europe, 13.6%
                                                                                                                                                                                    Middle East,
                                                                                                                                                                                      41.5%

This increases the size of the network significantly
for Indian travelers, as well as making India more
accessible for international visitors. As such, it may                                                                Asia, 30.3%
go some way to explaining the relatively lower
                                                                                                Source: IATA
number of international city pairs for India relative
to China and Russia.                                                                            Looking more closely at the composition of
As was the case for the India domestic market, at                                               international travel, at the country-level, the top
the same time as the number of international city

                                                                                                                                                                                            6
10 international markets account for two-thirds of                               Figure 23: Top freight country pairs from India,
the total (Figure 22).                                                           2017
                                                                                              Other , 22.2%
The United Arab Emirates (UAE) leads the way,
with almost 20% of the total, followed by Saudi                                                                                                 UAE, 28%

Arabia and the United States each with just over
9% market share.                                                                      Kuwait, 2%

                                                                                     Thailand, 3%

Figure 22: Share of international traffic by country,                                 Germany, 4%

2017
                                                                                      Saudi Arabia, 5%
                                                                                                                                            Qatar, 11%
                                                                                            Singapore, 5%
            Other, 32.9%
                                                            UAE, 19.8%
                                                                                                     Hong Kong, 6%   UK, 6%      Ethiopia, 7%

                                                                                 Source: IATA
                                                                      US, 9.3%

                                                                                 Figure 24 depicts the relative market size (in
                                                                                 tonnes) and the annual growth rate of India’s top
         Qatar, 2.9%                                           S.Arabia, 9.3%    10 air cargo trading partners.
               Kuwait, 3.1%
            Malaysia, 3.6%                          Singapore, 5.4%              While the UAE is clearly the largest market by
                                               UK, 5.1%
                 Oman, 3.9%   Thailand, 4.6%
                                                                                 some margin, the fastest growing market was
Source: IATA
                                                                                 Ethiopia, which more than doubled its cargo
                                                                                 tonnage with India in 2017. Kuwait and Thailand
                                                                                 also deserve a mention with growth exceeding
India’s air cargo market                                                         30% for the year for both countries.
While the focus of this paper to date has been on                                Of the top ten markets, Hong Kong was the only
the air passenger market, it would be remiss to                                  one to see a fall in its cargo tonnage with India in
overlook the air cargo segment.                                                  2017, down a modest 0.3% compared with its
This is particularly the case given India’s                                      2016 volume.
integration into the global pharmaceutical value                                 Figure 24: Top freight country pairs from India,
chains – a strong growth performer for the air                                   tonnes & annual growth, 2017
cargo segment over recent years.
                                                                                                                               tonnes                      %ch
Nonetheless, 2017 was also an impressive year of                                 UAE                                          292,556                  4.7%
growth for the Indian air cargo market.                                          Qatar                                        113,652                 18.2%
                                                                                 Ethiopia                                      77,626                114.4%
The total cargo tonnage flown from India crossed                                 UK                                            66,275                 16.0%
the one million tonne threshold in 2017, with a                                  Hong Kong                                     61,460                 -0.3%
                                                                                 Singapore                                     58,146                  5.4%
strong, double-digit growth rate of 16.9% 5.                                     Saudi Arabia                                  52,041                 25.6%
                                                                                 Germany                                       46,583                  6.3%
The top ten trading partner countries for Indian air                             Thailand                                      32,872                 34.2%
cargo account for almost 78% of the total                                        Kuwait                                        24,576                 30.2%
(Figure 23).                                                                     Source: IATA WATS
The UAE leads the way with almost a 30% market
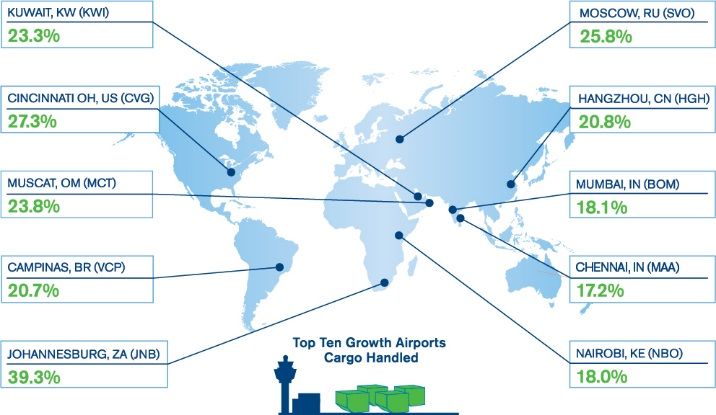
                                                                                 As was the case on the passenger side, India has
share, followed by Qatar with 11%.
                                                                                 two airports ranked in the global top 10 fastest
                                                                                 growing in 2017, namely Mumbai and Chennai.
                                                                                 These two airports recorded very strong growth of
                                                                                 18.1% and 17.2%, respectively in 2017 (Figure 25).

5
 The top freight country pairs cover all scheduled traffic,
excl. integrators. The data are uni-directional in nature.
                                                                                                                                                            7
In terms of global rankings, Dehli and Mumbai           For India the growth of the LCC market has been
appear in the list of the top 50 airports for freight   significant. In 2004 there were just over 5 million
handled, at #29 and #31, respectively.                  total LCC seats offered. Incorporating the
                                                        schedules data for the remaining months of 2018,
Figure 25: The top 10 growth airports 2017 – cargo
                                                        this figure has risen to almost 135 million seats –
handled
                                                        an increase of 27x in the 14-year period
                                                        (Figure 27).
                                                        Figure 27: Increase in the number of LCC seats in
                                                        the Indian air transport market
                                                                       Total LCC seats (DOM+INT)
                                                         160,000,000

                                                         140,000,000

                                                         120,000,000

                                                         100,000,000

                                                          80,000,000

Source: ACI, IATA WATS                                    60,000,000

                                                          40,000,000

                                                          20,000,000

                                                                  0
                                                                       2004     2006     2008      2010   2012   2014   2016   2018
Business models & industry                              Source: SRS Analyser
structures continue to evolve
                                                        Even if you consider just the past five year period,
Globally, air transport is a highly dynamic industry
                                                        the number of LCC seats in the Indian market has
and in this regard, the industry in India is no
                                                        more than doubled, from 64 million in 2013.
different.
                                                        One of the key competitors for airlines
As markets evolve and customer demands change,
                                                        domestically is the extensive train network in
airlines must constantly review and update their
                                                        India. The train system carries more than 8 billion
operations and product offering to ensure that
                                                        passengers per year. Many of these will be
they continue to meet the market need.
                                                        commuter trips over relatively short distances, for
One important part of this story is the evolution in    which air travel is not a viable substitute.
business models and market structures observed
                                                        However, a proportion of these train journeys
in the industry, notably the rise of the so-called
                                                        could potentially be taken by air; the market
Low Cost Carrier (LCC) business model (Figure 26).
                                                        opportunity for an affordable airline alternative is
All told, at the global level, LCCs account for         clear.
around 28% of the total number of seats flown.
                                                        Looking at the share of LCC seats in the Indian
Figure 26: Proliferation of the LCC model globally      market brings to light a number of interesting
                                                        observations.
                                                        Firstly, around 55% of all seats in the market are
                                                        offered by low cost carriers (Figure 28). Focusing
                                                        on the domestic market alone, the LCC share of
                                                        total seats is almost 70%.
                                                        While the share of LCC seats offered on India’s
                                                        international routes is much smaller, at just under
                                                        25%, this share has risen from essentially zero in
                                                        2004.
Source: SRS Analyser

                                                                                                                                 8
Figure 28: Share of LCC seats in the Indian air                             Amongst Indian airlines, there are currently
transport market                                                            around 600 aircraft in service. Evidencing the
         LCC seats, share of total                                          optimism and positive outlook for the sector, and
 80%

 70%
                                                                            providing some insights as to the near-term
 60%
                    INT         DOM     TOTAL
                                                                            evolution of the market, some 1123 aircraft are
 50%                                                                        currently on order for India. The bulk of these
 40%                                                                        deliveries are currently slated for delivery to
 30%                                                                        IndiGo – a major low cost carrier (Figure 29).
 20%

 10%
                                                                            Figure 29: Aircraft currently on order – Indian
 0%                                                                         airlines
       2004       2006        2008    2010      2012   2014   2016   2018
                                                                              Air India
Source: SRS Analyser
                                                                                Vistara

Arguably, the emergence of LCCs has facilitated                                  GoAir

the democratization of air travel and fueled
                                                                            Jet Airways
aviation growth, albeit in various ways across
                                                                               SpiceJet
different markets.
                                                                                IndiGo
In emerging markets LCCs have broadened the
                                                                                          0   50   100   150   200   250   300   350   400   450    500
market and allowed more people the opportunity                                                                                                 # aircraft

to fly for the very first time. In more mature                              Source: CAPA
markets, LCCs have deepened the market allowing
people to fly more often.
Given its prevalence, the LCC model cannot be
                                                                            Financial performance
ignored in any assessment of India’s air transport
                                                                            Historically, the global air transport industry has
market. However, LCCs aren’t the only way in
                                                                            struggled to generate consistent profits. Even in
which the industry is evolving.
                                                                            periods of strong demand, profitability has,
Increasingly, we are seeing a blurring of the                               historically, proven to be elusive.
traditional distinction between full service airlines
                                                                            While, as a rule, airlines have been able to pay
and LCCs as each are increasingly adopting
                                                                            their debts, equity investors typically have not
practices typically the domain of the other,
                                                                            been adequately compensated for risking their
resulting in a so-called ‘hybrid’ business model.
                                                                            capital in the sector.
More broadly, there are range of new and
                                                                            The last three years – and we expect 2018 to be
alternative investment and alliance or partnership
                                                                            the fourth – have seen a turnaround in this
structures emerging globally which add a new
                                                                            situation at the global, industry-wide level.
dimension to the industry, as airlines try to find
new and innovative ways to expand their                                     The industry is now generating returns which
networks and their product offering. In some                                exceed its cost of capital, and delivering a net
global markets, the changing industry structure is                          profit figure of around US$30 billion per year
one of consolidation rather than expansion.                                 (Figure 30).

These developments can apply to both the
international and domestic markets. Indeed, some
of these new structures and arrangements are
evident in the Indian air transport industry, having
been supported by changes in the regulatory and
policy environment.

                                                                                                                                                            9
Figure 30: Global airline industry financial                                                                    Figure 32: Financial performance of selected
performance                                                                                                     Indian airlines vs the global industry, EBIT margin
10.0
        % revenues
                                       Global commercial airline profitability
                                                                                                US$ billion
                                                                                                           40
                                                                                                                2013-2018*
 8.0                                                                                                                    EBIT margin
                                                                                                          30     15%
 6.0                                                 EBIT margin (left axis)
                                                                                                          20     10%
 4.0
 2.0                                                                                                      10      5%

 0.0                                                                                                      0
                                                                                                                  0%
 -2.0                                                                                                     -10
                                                                                                                 -5%
 -4.0
                                                     Net post-tax profit (right axis)                     -20
 -6.0                                                                                                            -10%
 -8.0                                                                                                     -30
                                                                                                                                                Air India          SpiceJet      IndiGo
                                                                                                                 -15%
-10.0                                                                                                     -40                                   GoAir              Jet Airways   Industry
         2000     2002    2004     2006       2008       2010       2012      2014       2016      2018
                                                                                                                 -20%
                                                                                                                            2013      2014   2015           2016        2017     2018
Source: IATA
                                                                                                                Source: Airline Analyst *data for Indian airlines related to
Unfortunately, for the most part, the airlines in                                                               year-ended 31 March, industry data relate to the calendar
India have not yet been able to match this recent                                                               year prior
improvement in the industry-wide financial
performance (Figure 31).                                                                                        It is clear that the overall industry in India is not
                                                                                                                yet on a sound financial footing and this remains a
Over the period shown, most airlines have                                                                       work-in-progress for the industry and its key
struggled to consistently generate a net profit                                                                 stakeholders, including policy-makers.
after tax; the main exception being IndiGo who,
along with GoAir, are the only airlines to have                                                                 While the industry has demonstrated resilience in
generated profits in each year of the period                                                                    the face of various shocks and disruption
shown. The recent financial performance of Air                                                                  (including the global financial crisis and airline
India has been well-documented elsewhere.                                                                       exits), financial stability is a key factor for the
                                                                                                                industry to be able to successfully develop and
Figure 31: Financial performance of selected                                                                    grow.
Indian airlines, Net profit after tax 2013-2018*
          Net profit after tax, US$m
   500

   300

   100                                                                                                          The value of air transport to
  -100

  -300
                                                                                                                India
  -500                                                                                                          6.2m jobs and a $35bn contribution to
  -700
                                                        Air India          SpiceJet       IndiGo
                                                                                                                GDP
  -900
                                                        GoAir              Jet Airways                          The air transport sector makes a significant
 -1100
                2013        2014             2015           2016             2017           2018                contribution to the Indian economy (Figure 33).
Source: Airline Analyst * data relate to year-ended 31 March
                                                                                                                Analysis undertaken by Oxford Economics shows
In a similar way, many Indian airlines have been                                                                that the air transport sector directly contributes
unable to match the global industry performance                                                                 404,000 jobs in India. This includes airlines, airport
in terms of operating (EBIT) margin either.                                                                     operators, airport on-site enterprises such as
                                                                                                                restaurants and retail, aircraft manufacturers and
The performance of GoAir and IndiGo are again
                                                                                                                air navigation service providers.
notable over the period, as is the improved
financial results of SpiceJet in more recent years.                                                             In addition, by buying goods and services from
                                                                                                                local suppliers the sector supported another
                                                                                                                943,000 jobs across the supply chain.

                                                                                                                                                                                            10
Figure 33: The value of aviation in India              Looking forward
                                                       Sound fundamentals point to a bright
                                                       future
                                                       IATA’s long-term passenger forecasts for India
                                                       highlight the potential for significant growth in air
                                                       transport demand over the next twenty years.
                                                       A favorable population and demographic profile –
                                                       notably a relatively young population – along with
                                                       the expected continuation of economic
Source: Oxford Economics, IATA                         development and growth in household incomes
                                                       underpins this very positive long-term outlook.
On top of this, the sector is estimated to have
                                                       India’s population is expected to increase further
supported a further 553,000 jobs by paying wages
                                                       over the forecast horizon, rising from 1.3 billion
to its employees, some or all of which are
                                                       persons currently to 1.6 billion by the end of our
subsequently spent on consumer goods and
                                                       forecast horizon (Figure 34).
services and create employment in other sectors
of the economy.                                        This ongoing population increase is expected to
                                                       see India overtake China as the world’s most
Air transport brings tourists and investment into      populous country within the next decade. Of itself,
India, and helps businesses trade their goods and      a growing population will typically have a positive
services around the world. Foreign tourists            impact on the demand for air transport services.
arriving by air to India, who spend their money in
                                                       Figure 34: India’s population forecast
the local economy, are estimated to have
                                                              Population , billion persons
supported an additional 4.3 million jobs.               1.8

                                                        1.6

                                                        1.4
But it’s not all just about employment.
                                                        1.2

                                                        1.0
The air transport industry (directly and indirectly)
                                                        0.8
is estimated to have supported an $10.4 billion         0.6

gross value added contribution to GDP in India          0.4

while spending by foreign tourists supported a          0.2

                                                        0.0
further $21.2 billion gross value added                       2006         2011              2016   2021   2026   2031   2036

contribution to GDP.                                   Source: Oxford Economics, IATA

Furthermore, the air transport jobs tend to be         In addition to the expected increase in population,
highly productive – not just for their airline         India is also forecast to become a richer country
employers but for the economies in which they          over the next 20 years.
are employed.
                                                       After adjusting for inflation, per capita incomes
The average air transport services employee in         are expected to increase to almost US$5,000 per
India generates nearly INR1.3 million in Gross         year in 2036, up five-fold since 2006 and more
Value Added annually, which is around 10 times         than double the current level (Figure 35).
more than the economy-wide average.

                                                                                                                         11
Figure 35: India’s rising incomes – GDP per capita                                         Figure 37: India’s forecast air passenger demand,
 5,000
          GDP per capita, real US$                                                         2017-37
 4,500                                                                                             Million O-D passengers per year
                                                                                            600
 4,000
 3,500                                                                                      500
 3,000
 2,500                                                                                      400

 2,000
                                                                                            300
 1,500
 1,000                                                                                      200

  500
                                                                                            100
    0
         2006         2011           2016          2021          2026        2031   2036
                                                                                              0
                                                                                               2017     2019    2021     2023   2025   2027   2029   2031     2033   2035   2037
Source: Oxford Economics
                                                                                           Source: IATA/TE
At the same time, the number of middle-class
households in India is expected to continue to                                             The additional 359 million passengers will not be
increase over the coming decades, to around 20%                                            sourced evenly from the domestic and
by 2036, compared with just 2% in 2006 (Figure                                             international segments.
36).                                                                                       Domestic passengers will account for around 63%
Figure 36: Increase in the share of middle class                                           of the total growth over this period, or 228 million
households in India                                                                        additional passengers.
          % share of middle class households
 20%
                                             Forecast to rise by a further
                                                                                           Foreign passengers will contribute less to overall
 18%
 16%
                                             13 percentage points over
                                             the next 20 years
                                                                                           growth, representing 37% of the total market
 14%                                                                                       growth, equal to 131 million additional passengers
 12%
                                                                                           (Figure 38).
 10%
            Risen by 5 percentage
  8%        points since 2006                                                              Figure 38: Expected increase in Indian air
  6%
  4%
                                            7% in 2017
                                                                                           passenger demand 2017-37, and DOM vs INT
  2%                                                                                       contributions
  0%
                                                                                                  Passenger flows (million)
         2006        2011            2016         2021          2026         2031   2036    400

Source: Oxford Economics                                                                    350

                                                                                            300                                                          INT
                                                                                                                                                        36.6%
The latest IATA/Tourism Economics (TE) forecasts                                            250

suggest the demand for air travel to, from and                                              200

within India – on an Origin-Destination basis – will                                        150                                                             DOM
                                                                                                                                                            63.4%
increase at an average rate of 6.1% per year over                                           100

the next twenty years.                                                                       50

                                                                                              0

India is forecast to gain an additional 359 million                                                                Total pax                          INT & DOM

passengers by 2037, compared to 2017 (Figure                                               Source: IATA/TE

37); an increase of 3.3x the current level.
                                                                                           Of the 6.1% average annual growth in Indian air
This means that, by 2037, there will be almost                                             passenger demand over the next 20 years,
520 million passengers flying to/from and within                                           improvements in living standards (via higher
India each year.                                                                           incomes) are expected to contribute the major
                                                                                           share, at 5.1 percentage points.
                                                                                           Favourable population and demographic factors
                                                                                           are forecast to contribute 0.6 percentage points to
                                                                                           annual growth. Other factors, mainly future
                                                                                           technological gains, will contribute 0.8 percentage
                                                                                           points per year.

                                                                                                                                                                            12
The modest subtraction from growth (0.5                                                 to maintain their ranking over the forecast period
percentage points) from trade mainly reflects the                                       (Figure 41).
Oxford Economics view that the economy will
                                                                                        The mature air transport markets of the UK and US
become slightly less trade intensive over the
                                                                                        are expected to see the largest decline in rankings,
forecast horizon (Figure 39).
                                                                                        losing 3 places and 2 places to #9 and #6,
Figure 39: Sources of growth in India’s air                                             respectively.
passenger demand, 2017-37
                                                                                        Figure 41: Top 10 Indian air transport markets,
 7
        %, %age pt        Living standards   Pop'n & Demog.    Technology   Trade
                                                                                        2017-37
 6                                                             0.8                                  2017 2019 2021 2023 2025 2027 2029 2031 2033 2035 2037
                                                               0.6                      Dom. India 1                                                     Dom. India
 5
                                                                                        UAE          2                                                         UAE
 4
                                                                                        S. Arabia    3                                                      S. Arabia
 3                      6.1
                                                                                         US          4                                                     Singapore
                                                               5.1
 2                                                                                      Singapore 5                                                         Thailand
 1                                                                                       UK          6                                                         US

 0                                                                                      Thailand     7                                                        Oman
                                                               -0.5
 -1                                                                                      Oman        8                                                        Qatar
                      Total pax                               Drivers
                                                                                        Malaysia     9                                                         UK
Source: IATA/TE                                                                          Kuwait     10                                                      Malaysia

Putting this performance into a global context, the
                                                                                         S
                                                                                        Source: IATA/TE

positive outlook will see India move up from the
#7 ranked largest air passenger market in the
world currently to #3 (behind China and the
                                                                                        The policy environment matters
United States) within the next decade. India will
                                                                                        It is important to note that while the fundamental
hold this position through to the end of our
                                                                                        drivers of air passenger demand provide a
forecast horizon in 2037.
                                                                                        favorable tailwind to growth in the sector, these
Along the way, India will overtake Germany,                                             outcomes are not guaranteed.
Japan, Spain and the United Kingdom (Figure 40).
                                                                                        Demand forecasts can be impacted – either
Figure 40: Top 10 global air transport markets,                                         positively or negatively – by a range of other
2017-37                                                                                 factors, including the availability of infrastructure
 US           1
               2017 2019 2021 2023 2025 2027 2029 2031 2033 2035 2037
                                                                               China    and broader government policy decisions around
China         2                                                                US       market regulation and liberalization, for example.
UK            3                                                                India

Spain         4                                                             Indonesia   Air passenger forecast scenarios
                                                                                UK
Japan         5
                                                                                        As part of the forecast process, we prepare two
Germany       6                                                                 Spain

India         7                                                                Japan
                                                                                        generic global scenarios.
Italy         8                                                             Germany
France        9                                                              Thailand
                                                                                        The scenarios are designed to demonstrate the
Indonesia 10                                                                   France   possible impacts on air passenger demand of both
 S
Source: IATA/TE                                                                         a more favorable future outcome (where there is
                                                                                        policy stimulus and further air transport market
The composition of the top ten air transport                                            liberalization) and a less favorable future outcome
markets for India show relatively little change over                                    where policies are more restrictive and there is a
the 20-year forecasting horizon.                                                        pick-up in protectionism.
Kuwait is set to drop out of the top 10, to be                                          The effect of these two broad scenarios on India’s
replaced by Qatar as the only compositional
                                                                                        air passenger demand forecasts are depicted in
change expected. The top 3 markets (Domestic
                                                                                        Figure 42.
India, the UAE and Saudi Arabia) are all expected

                                                                                                                                                             13
Figure 42: India’s air passenger demand outlook                                           More recently, a new draft scheme has been
under three scenarios, 2017-37                                                            announced seeking to extend the UDAN
 1000
        Million O-D passengers per year                                                   framework to international routes.

  800
                   Baseline
                                                                                          Travel & Tourism Competitiveness
                   Policy Stimulus & Market Liberalisation
  600
                                                                                          The World Economic Forum’s (WEF) Travel and
                   Pick-up in Protectionism
                                                                                          Tourism Competitiveness Index provides a
  400
                                                                                          framework to assess and benchmark the factors
  200                                                                                     and policies which impact a country’s T&T sector
                                                                                          competitiveness.
   0
        2017   2019   2021     2023    2025    2027    2029   2031   2033   2035   2037
                                                                                          In its latest report, India ranks #40 out of the 136
Source: IATA/TE
                                                                                          countries assessed, a strong improvement of 12
Under the less favorable scenario, India’s air                                            places over the previous survey (Figure 43).
passenger market will still grow, albeit at a slower                                      India’s strengths include its vast cultural and
pace, of 4.9% per year. While this difference                                             natural resources (ranked 9th and 24th,
doesn’t seem significant, it translates to more                                           respectively), and its price competitiveness
than 100 million less passengers per year in 2037                                         advantage (10th).
than under the ‘constant policies’ scenario.
                                                                                          The WEF notes that India continues to enrich its
On the upside, a more favorable policy backdrop                                           cultural resources, protecting more cultural sites
could see air passenger demand for India growing                                          and intangible expressions through UNESCO
at a near-double digit annual pace of 9.1%,                                               World Heritage lists, and via a greater digital
generating an additional 385 million passengers in                                        presence.
2037 compared with the constant policies
scenario. This would take the number of                                                   International openness (55th, up 14 places),
passengers travelling to, from and within India by                                        through stronger visa policies implementing both
air to just over 900 million in 2037.                                                     visas on arrival and e-visas, has enabled India to
                                                                                          rise up through the global ranking.
National Civil Aviation Policy
In the Indian context, no consideration of the                                            The travel and tourism sector benefited from
policy environment could overlook the recent                                              improvements in India’s transport infrastructure,
National Civil Aviation Policy (NCAP).                                                    which the WEF notes has traditionally been a
                                                                                          challenging area.
The 2016 introduction of the NCAP brought a
number    of     important      initiatives   and                                         In this regard, it is notable, that the air transport
developments to India’s air transport industry.                                           infrastructure sub-component places India 32nd
                                                                                          currently in the global ranking.
The policy addresses a range of key areas for civil
aviation including airline operations, safety and                                         Figure 43: India’s travel & tourism competitiveness
security, international traffic rights and
maintenance, repair and overhaul (MRO)
operations.

The NCAP aims to make flying more affordable
and convenient to the general population,
including by establishing a regional air
connectivity scheme, the UDAN initiative.

                                                                                          Source: WEF

                                                                                                                                            14
Nonetheless, there is always room for                                                                        A strong and vibrant business environment
improvement which could lift India’s ranking into                                                            stimulates employment opportunities, investment
the top quartile of countries.                                                                               and trade which the air transport sector can both
                                                                                                             help to enhance and benefit from.
Within the air transport infrastructure category,
India ranks relatively low (133rd) in terms of                                                               The World Bank’s Ease of Doing Business Index is
airport density (the number of airports per million                                                          designed to provide objective data for use by
of population) and 108th for the number of                                                                   governments in designing sound business
departures per 1000 population.                                                                              regulatory policies.

While health conditions in the country continue to                                                           The latest index reveals strong improvement,
improve, the WEF includes India towards the                                                                  ranking India at #77 of 190 countries, ahead of the
lower end of its global rankings for this indicator                                                          South Asia regional average.
(104th).
                                                                                                             Key challenges for India highlighted by the World
Similarly, the WEF notes that while India’s ICT                                                              Bank include dealing with enforcing contracts and
readiness (112th), security concerns (114th),                                                                resolving insolvency.
tourist service infrastructure (110th) and human
                                                                                                             Importantly, and as was the case with the WEF
resources (87th) are slowly improving, further
work is required across these dimensions to lift                                                             measure discussed above, improvements in the
India’s overall global ranking.                                                                              broader business environment in India are
                                                                                                             underway; India’s ease of doing business ranking
Importantly, the WEF is clear that steps are                                                                 has risen from #132 just five years ago, clearly
already being taken in the right direction to                                                                moving in the right direction.
address the shortcomings and concludes that “the
Indian transport and tourism sector presents
significant opportunities that are yet to be
reaped”.

India’s travel and tourism competitiveness ranking
relative to its Asia Pacific peers is shown in
Figure 44.

Figure 44: Asia Pacific travel & tourism
competitiveness rankings
      Global ranking (out of 136 countries)
140
                                                                                                   124 125
120
                                                                                     101 102 103
100                                                                             94

                                                                        78 79
 80
                                                                64 67
 60
                                                        40 42
 40                                                34
                                              30
                                      26
                           19
 20                  15 16
               11 13
      4    7

  0

Source: WEF

Ease of Doing Business
The robustness and efficiency of the broader
business environment is also important – not just
for air transport sector and related parts of the
industry supply chain.
                                                                                                                                                             15
Concluding comments                                     supporting services, both on the ground and in the
                                                        air.
Air transport is the business of freedom. It is so
much more than just moving people and cargo             Equally, the broader business and policy
from one destination to another.                        environment should not place unnecessary
                                                        hurdles before the industry which inhibit its
Air transport helps to bring families together, it
                                                        growth and development and, in turn, reduce the
supports and enhances business and investment
                                                        level of benefits that aviation can deliver to the
decisions, it promotes the transfer of knowledge
                                                        nation.
and innovation, and provides opportunities to
study abroad and experience different cultures.         There is no doubt that this is an exciting period for
                                                        air transport in India.
As this paper has made clear, the future of India’s
air transport industry is bright.                       And there is a clear mandate for the industry, its
                                                        supply chain partners and the government and
However, this does not mean that that the future
                                                        policy-makers to all work in a collaborative
flightpath will be without turbulence.
                                                        manner, towards the common goal of ensuring
The significant growth potential of the industry in     that the benefits that the air transport industry
India will also create challenges – for the airlines,   can bring to India are fulfilled.
its industry partners and policy-makers alike – to
ensure that this growth potential can be met.
For example, this will require the right type of
                                                                                           IATA Economics
infrastructure to be put into place, at the right
                                                                                       economics@iata.org
time and in the right place. Infrastructure is not
                                                                                              January 2019
just airports, it includes investment and

                                                                                                          16
You can also read