Results Q1 2019 Schaeffler AG - dbAccess Berlin Conference 2019
←
→
Page content transcription
If your browser does not render page correctly, please read the page content below

Results Q1 2019 Schaeffler AG

dbAccess Berlin Conference 2019

Disclaimer

This presentation contains forward-looking statements. The words “anticipate”, “assume”, “believe”, “estimate”, “expect”, “intend”, “may”, “plan”, “project”,
“should” and similar expressions are used to identify forward-looking statements. Forward-looking statements are statements that are not historical facts;
they include statements about Schaeffler Group’s beliefs and expectations and the assumptions underlying them. These statements are based on plans,
estimates and projections as they are currently available to the management of Schaeffler AG. Forward-looking statements therefore speak only
as of the date they are made, and Schaeffler Group undertakes no obligation to update any of them in light of new information or future events.
By their very nature, forward-looking statements involve risks and uncertainties. These statements are based on Schaeffler AG management’s current
expectations and are subject to a number of factors and uncertainties that could cause actual results to differ materially from those described in the
forward-looking statements. Actual results may differ from those set forth in the forward-looking statements as a result of various factors (including,
but not limited to, future global economic conditions, changed market conditions affecting the automotive industry, intense competition in the markets
in which we operate and costs of compliance with applicable laws, regulations and standards, diverse political, legal, economic and other conditions
affecting our markets, and other factors beyond our control).
This presentation is intended to provide a general overview of Schaeffler Group’s business and does not purport to deal with all aspects and details
regarding Schaeffler Group. Accordingly, neither Schaeffler Group nor any of its directors, officers, employees or advisers nor any other person makes
any representation or warranty, express or implied, as to, and accordingly no reliance should be placed on, the accuracy or completeness of the information
contained in the presentation or of the views given or implied. Neither Schaeffler Group nor any of its directors, officers, employees or advisors nor
any other person shall have any liability whatsoever for any errors or omissions or any loss howsoever arising, directly or indirectly, from any use
of this information or its contents or otherwise arising in connection therewith.
The material contained in this presentation reflects current legislation and the business and financial affairs of Schaeffler Group which are subject
to change.

                                                                                                                                                            2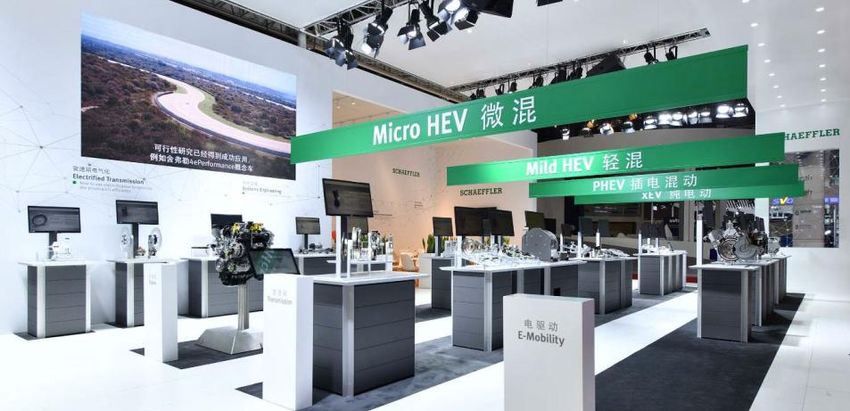
Agenda

         1   Overview

         2   Business Highlights Q1 2019

         3   Financial Results Q1 2019

         4   Outlook

                                           3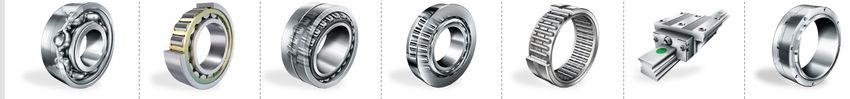
1 Overview
Q1 2019 with mixed results – Market environment still subdued

Key messages                                                                                   Sales growth1   Gross margin
    1
         Group sales growth1 of +0.4% with an expected slow start into the
         year, Auto OEM Outperformance of 500 bps                                              +0.4%           25.2%
      Gross margin 25.2% (Q1’18: 27.0%), down y-o-y in Automotive
                                                                                               EUR 3,622 mn    EUR 913 mn
    2
      divisions, up in Industrial

         EBIT margin2 7.5% (Q1’18: 11.0%), sequentially stabilized vs. Q4’18
    3
         (6.5%)

         Free Cash Flow3 of EUR -235 mn due to lower profitability and
    4
         higher Capex
                                                                                               EBIT margin2    Free Cash Flow3

         Transformation continues – Acquisition of XTRONIC, consolidation                      7.5%            EUR -235 mn
    5
         of European plant footprint
                                                                                               EUR 272 mn
    6 Guidance 2019 confirmed on Group and divisional level

1   FX-adjusted | 2 Before special items | 3 Before cash in- and outflows for M&A activities

                                                                                                                                 4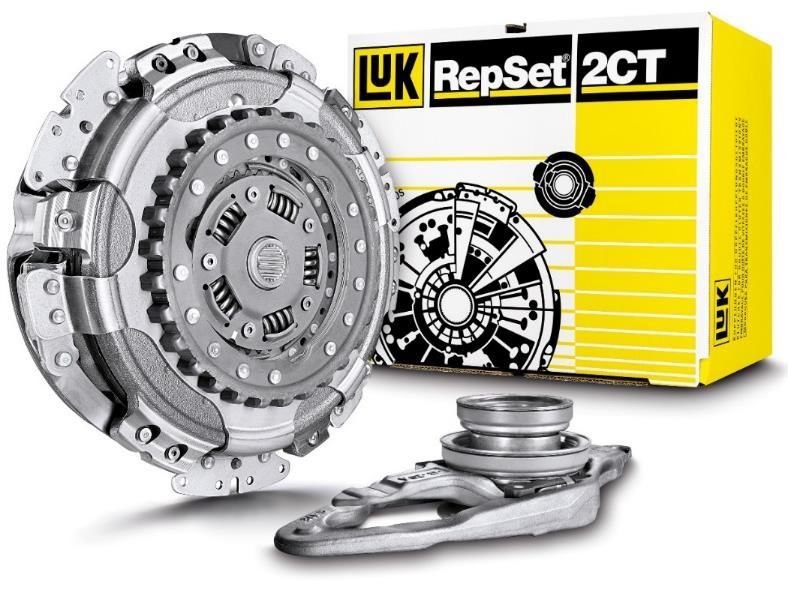
1 Overview
Schaeffler Group Q1 2019 – Highlights and lowlights

              Automotive OEM: LVP1 outperformance of 500 bps             Weak Automotive OEM business in Greater China
              driven by strong growth in Americas (+12.4%2)              (-14.5%2) and Europe (-3.3%2)

                                                                         Automotive Aftermarket sales impacted by weak OES
              Strong growth in Industrial division (+6.9%2) with all
                                                                         business and pricing pressure from customer
              regions contributing, especially Greater China (+14.1%2)
                                                                         consolidation in Europe

                                                                         Gross margin still negatively impacted by higher
              EBIT margin3 sequentially improved by 100 bps mainly
                                                                         production costs, overhead costs continued to grow
              driven by Automotive OEM
                                                                         faster than sales

              Refinancing: Successful placement of EUR 2.2bn             Capex to Sales ratio temporary over 10% driven by
              Investment Grade bonds                                     payouts of investments decided in H2 2018

1   Light Vehicle Production | 2 FX-adjusted | 3 Before special items

                                                                                                                              5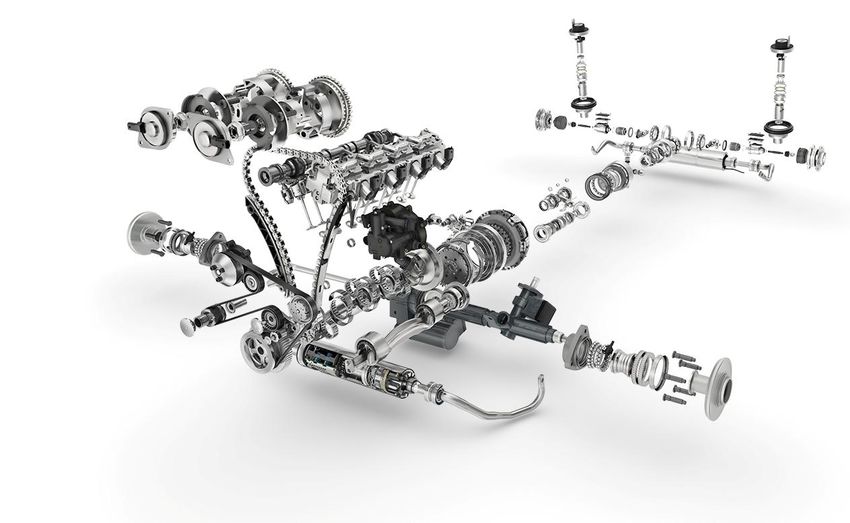
2 Business Highlights Q1 2019
Automotive OEM – Strong Outperformance, earnings quality still unsatisfactory, albeit stabilized

Sales
                                 -1.7%1                         Strong Outperformance of LVP3 by 500 bps, driven by strong growth in Region
in EUR mn
                                                                Americas with 12.4%1
                       2,280                2,286
                                                                Business division E-Mobility growing by 33.9%1 driven by ramp ups for hybrid
                                                                modules, CVT transmissions and clutch actuators
                     Q1 2018              Q1 2019
Gross profit                                                    R&D ratio flat y-o-y at 8%, especially focusing on E-Mobility & mechatronic systems
margin                 24.2%                21.1%

                                                                Weakness in Automotive OEM business in China (-14.5%1) and Europe (-3.3%1)
EBIT2                           -4.6%-pts                       continued in Q1 2019
in EUR mn

                        218                                     Negative fixed cost effects caused by lower volumes despite flexing costs in China
                                             113

                     Q1 2018              Q1 2019               Overhead costs increased, in particular personnel costs, but headcount decreased
                                                                in Q1 2019
EBIT margin2           9.6%                 5.0%    1   FX-adjusted | 2 Before special items | 3 Light Vehicle Production

                                                                                                                                                     6
2 Business Highlights Q1 2019
Automotive OEM – Successful Auto Show Shanghai and projects pipeline building up

                                                           Business highlights

                                                          u Successful Auto fair in Shanghai (16 - 25 April, 2019)
                                                             § Showcasing Schaeffler’s Powertrain Matrix and
                                                               SpaceDrive Technology
                                                             § E-Axle Production Launch Ceremony parallel to Auto
                                                               Shanghai

                                                          u Positive Business Development in Q1 2019
                                                             § Classic Engine and Transmission business divisions with
                                                               growing share of system solutions vs. components in the
                                                               order intake
                                                             § Pipeline of new projects in E-Mobility building up

                                                                                                                         7
2 Business Highlights Q1 2019
Automotive Aftermarket – Slow start with mixed sales and lower EBIT margin

Sales
                                 -1.1%1                         Good growth in Independent Aftermarket with +3.0%1, driven by strong
in EUR mn
                                                                performance in Region Americas (in particular South America)
                        447                  441
                                                                Price increases for selected parts of the product portfolio implemented

                     Q1 2018              Q1 2019
Gross profit                                                    Demand in OES business in Region Europe showing temporary decline
margin                 35.6%                33.7%

EBIT2                                                           Price pressure due to customer consolidation in European markets
                                -3.7%-pts
in EUR mn

                                                                Lower gross margin due to higher product costs and negative price impact,
                         81                  64                 efficiency measures (in particular on SG&A) initiated to compensate headwinds

                     Q1 2018              Q1 2019

EBIT margin2           18.1%                14.4%   1   FX-adjusted | 2 Before special items

                                                                                                                                                8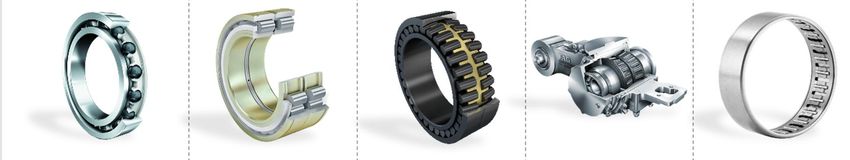
2 Business Highlights Q1 2019
Automotive Aftermarket – Chassis Specialist and additional NAPA business

  Portfolio re-positioning:                                               Portfolio expansion:
  FAG brand, the chassis specialist                                       Entering the North American bearings & seals business

u Re-positioning of RUVILLE steering                                     u Bearings & seals program started in
  portfolio under FAG brand                                                North America in Q2/18

u Upgrade of product quality and                                         u Product catalogue is expanding -
  positioning as premium brand                                             currently covering more than
                                                                           9,000 parts and 1.1 million referenced
u Market launch in Europe on June 1,                                       applications
  2019 and global roll-out until 2021
                                                                         u Continued ramp-up of sales volume
                                                                           results in up to 7 EUR mn of
                                                                                                                                    NAPA
                                                                           incremental sales in Q1/19
       Steering &             Strut     Drive shaft   Wheel bearings &
       suspension           mountings   assemblies       modules         u Steady improvements in profitability as a result of additional fixed
                                                                           cost coverage, as well as purchasing productivity

                                                                                                                                                  9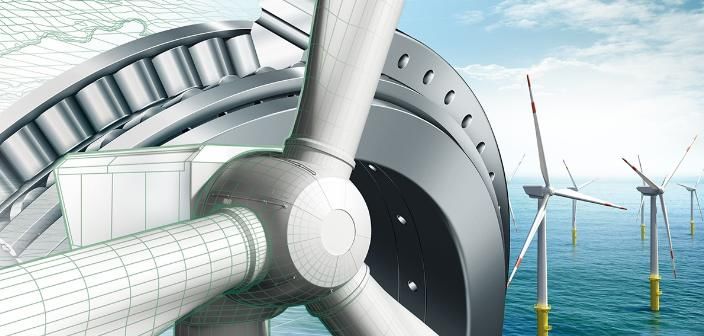
2 Business Highlights Q1 2019
Industrial – Strong growth and slightly lower earnings quality

Sales
                                 +6.9%1                         Above average sales growth with positive contribution from all regions (China
in EUR mn
                                                                +14.1%1)
                        824                  895

                                                                Continued double digit growth in Wind, Raw Materials and Railway sector clusters

                     Q1 2018              Q1 2019
Gross profit                                                    Gross margin increased due to positive volume development and favorable pricing
margin                 30.2%                31.6%               more than offsetting an increase in production costs

                                                                Growth momentum declining, industrial production forecast lowered to 2% (Prior:
EBIT2                           -0.6%-pts                       2.6%)
in EUR mn

                                                                Higher logistic costs driven by increase of special freights, full ramp up of our
                         92                  95
                                                                European distribution center and remaining costs in replenishment centers

                     Q1 2018              Q1 2019               Higher overhead costs in all functional areas overcompensated positive price and
                                                                margin evolution, program FIT to support earnings quality going forward
EBIT margin2           11.2%                10.6%   1   FX-adjusted | 2 Before special items

                                                                                                                                                    10
2 Business Highlights Q1 2019
Industrial – Continued growth in key sectors
Sector Wind
u Significant sales growth with key customer for multi-megawatt turbines
Further localization & in China
growth in China u Local production ramp-up of large size bearings in Nanjing, China
Sector Rail
u New orders with large railway OEM in Eastern Europe
Rail growth in
u Supply of broad product range including spherical, ball and axle box
Eastern Europe bearings
Sector Raw Materials u Orders secured with key customers in Asia-Pacific and China
Raw Materials growth in u New large size bearing contract for cement industry, renewed contract
Asia-Pacific and China with partners in the pulp and paper industry and new major order for
continuous caster bearings in China
Sector Ind. Automation u Mitsubishi Electric Corporation and Schaeffler entered into a global
Industry 4.0 strategic partnership
partnership u Target is to boost connectivity and to create Industry 4.0 solutions that
reduce machine downtime and maximize productivity for the customer
112 Business Highlights Q1 2019
Capital allocation – Focus increased and discipline strengthened
Investment1) allocation | in EUR mn Mid-term target: Investment priorization going forward
Capex ratio: 6-8%2) u Automotive OEM: Strategic growth fields E-Mobility and Chassis
Mechatronics – clearly linked to our EUR 1.5-2.0 bn p.a. order intake
target of program RACE
FY 2017 FY 2018 Q1 2018 Q1 2019
u Automotive Aftermarket: Expansion of our logistics network in all
regions to increase speed and reliability of our delivery process
Automotive OEM 1,006 970 181 225
u Industrial: Improve our technological expertise in future growth fields
Automotive Industry 4.0 and Mechatronics
33 64 18 40
Aftermarket
Industrial 248 241 35 30 Strengthened Capex discipline – Actions taken in Q1
u Capex ratio2 Q1 temporarily increased due to Q4 investment payouts
Schaeffler Group 1,287 1,275 234 296 and higher spending for AKO Europe
u Capex Committee started in Q1 with tightened hurdle rates and stricter
approval levels
Capex ratio2) 9.1% 8.7% 8.6% 10.3% u Capex budgets further reduced in non-strategic areas
1 Additions to intangible assets and property, plant and equipment| 2 Capex in % of sales
122 Business Highlights Q1 2019
Transformation continues – XTRONIC and European footprint
Automotive
Acquisition of XTRONIC OEM Divestment of Barden plant, UK Industrial
u Backward integration for recently acquired u Signing of agreement to sell The Barden Corporation (UK), Plymouth
Paravan technology for autonomous driving to HQW Holding, a UK affiliate of HQW Precision GmbH
u Strengthen software competence for existing u Divestment is part of Schaeffler‘s UK realignment activities
mechatronic projects and enable more advanced announced last November and the company´s „Global Footprint“
solutions going forward initiative
u Key leadership personnel committed to continue
to work for the company
u Fully consistent with our M&A radar priorities
u Divestment of Barden plant is another step to make Schaeffler‘s
footprint in Europe more efficient
u Integration of XTRONIC will further support position of Schaeffler as
partner for mechatronics and future mobility solutions
133 Financial Results Q1 2019
Key figures Q1 2019
Q1 2019
in EUR mn Q1 2018 Q1 2019 vs. Q1 2018
+2.0%
Sales 1 3,551 3,622
+0.4%1
Gross Profit 960 913 -47 mn
2
Gross Margin 27.0% 25.2% -1.8%-pts.
EBIT2 391 272 -119 mn
EBIT Margin2 3 11.0% 7.5% -3.5%-pts.
Net income3 238 137 -101 mn
4
EPS4 (in EUR) 0.36 0.21 -0.15
Schaeffler Value Added5 743 421 -322 mn
4
ROCE6 19.3% 15.0% -4.3%-pts.
Free Cash Flow7 5 -69 -235 -166 mn
Capex 6 306 373 +67 mn
Net financial debt 2,439 2,805 +366 mn
7
Gearing ratio8 87.8% 88.5% +0.7%-pts.
1 FX-adjusted | 2 Before special items | 3 Attributable to shareholders of the parent company | 4 Earnings per common non-voting share | 5 Defined as EBIT before special items minus Cost of Capital
(10% × Ø Capital Employed) | 6 Before special items and based on LTM | 7 Before cash in-and outflows for M&A activities | 8 Ratio of net financial debt to equity incl. non-controlling interests
143 Financial Results Q1 2019
1 Sales growth – Region Americas with double-digit growth rates
Sales | in EUR mn Key aspects
u Group sales up by +0.4%1 (Q1’18: +3.9%1)
+0.4%1
u Sales growth1 mainly driven by Americas (+11.9%), offsetting negative
growth in Greater China (-8.0%) and Europe (-1.5%)
u Strong growth1 in Americas driven by all divisions (Auto OEM: +12.4%,
Auto AM: +14.1%, Industrial: +9.1%)
3,551 3,642 3,521 3,527 3,622
Q1 18 Q2 18 Q3 18 Q4 18 Q1 19
Sales by region Q1 2019
Y-o-y growth w/o FX effects +2.8% Asia/Pacific
14,241 10%
Sales growth 51%
16%
Reported Greater China -8.0% -1.5% Europe
-0.6% +4.9% +2.5% -0.4% +2.0%
23%
FX-adjusted
+3.9% +7.9% +3.7% +0.3% +0.4%
Americas +11.9%
1 FX-adjusted
153 Financial Results Q1 2019
2 Gross Profit – Gross margin lower on negative price, mix and higher production costs
Gross Profit Q1 2018 vs. Q1 2019 | in EUR mn Key aspects
Negative price effect driven by continued price pressure in major
1 1 AOEM end markets, especially in China; Industrial division with
favorable pricing
-20 +8
-20 Negative mix effect driven by AOEM, due to adverse customer and
-2 2 product mix in classic product lines and negative regional mix (mainly
-44 +31
2 China)
3 Higher production costs in all divisions mainly due to higher input
3
costs (raw materials and personnel costs)
Actions
960 913
u Additional closing days
Gross Profit Price Volume Mix Production FX effect Others Gross Profit u Further reduction of number of temporary workers
Q1 2018 costs Q1 2019
u Hiring freeze in all indirect areas
Gross margin development
27.0% -0.8%-pts +0.3%-pts -0.8%-pts -1.7%-pts +1.2%-pts -0.0%-pts 25.2%
163 Financial Results Q1 2019
3 EBIT margin – Sequential improvement, but still subdued earnings quality
EBIT1 | in EUR mn Key aspects
u Even if sequentially improving, Automotive OEM division’s Q1 2019
-119 mn
EBIT margin is the main driver of the Group’s EBIT margin y-o-y erosion
u Automotive Aftermarket EBIT margin affected by market consolidation
in Western Europe
u Industrial EBIT margin slightly lower y-o-y as ongoing positive volume
and price effects could not fully offset higher production and logistic
costs
391 4042 3553 2314 2725
Q1 18 Q2 18 Q3 18 Q4 18 Q1 19
EBIT margin1 Q1 19
1,381 in EUR mn Q1 18 Q1 19 vs. Q1 18
EBIT margin1
Auto OEM 9.6% 5.0% -4.6%-pts.
11.0% 11.1% 10.1% 6.5% 7.5%
Aftermarket 18.1% 14.4% -3.7%-pts.
FY EBIT margin1
9.7% 7.5% Industrial 11.2% 10.6% -0.6%-pts.
1Before special items |2 Reported EBIT of EUR 382 mn including EUR 22 mn restructuring expenses Group 11.0% 7.5% -3.5%-pts.
related to the integration of the internal supplier BCT | 3 Reported EBIT of EUR 376 mn including EUR 21
mn positive special item | 4 Reported EBIT of EUR 205 mn including EUR 4 mn restructuring expenses
5Reported EBIT of EUR 230 mn including EUR 55 mn restructuring expenses in connection with the
related to the integration of the internal supplier BCT and 22 mn restructuring expenses for program RACE and a EUR 13 mn refund of a penalty paid in 2015 in the Industrial division in connection
reorganization of UK business activities with antitrust proceedings in South Korea
173 Financial Results Q1 2019
Automotive OEM – Q1 with strong outperformance; low quality of earnings
RACE update:
Reported EBIT includes
EUR 55mn restructuring
Sales by business division | y-o-y growth EBIT2 Q1 2018 vs. Q1 2019 | in EUR mn expenses
Q1 2018 Q1 2019 ∆1
Engine Systems 710 699 -3.4%
Transmission Systems 1,077 1,035 -6.0%
E-Mobility 105 145 +33.9%
+1
Chassis Systems 388 406 +3.6%
-703 -2 -13
Total 2,280 2,286 -1.7%
-21
Automotive OEM sales1 and market development Q1
218 113
+12.4%
+2.4%
EBIT Gross R&D Selling Administrative Others EBIT
-0.1% Q1 2018 Profit expenses expenses expenses Q1 2019
-2.7%
-7.0% -3.3%
-13.7% -14.5%
Europe Americas Greater China Asia/Pacific EBIT margin development2
World production: -6.7%
9.6% -3.1%-pts -0.1%-pts +0.1%-pts -0.6%-pts -0.9%-pts 5.0%
Production of light vehicles Q1 2019 vs. Q1 2018 (IHS April)
Schaeffler Automotive OEM: -1.7%1
Sales growth Schaeffler Automotive OEM Q1 2019 vs. Q1 2018 1 FX-adjusted | 2 Before special items | 3 Includes positive FX effects of EUR 21 mn
183 Financial Results Q1 2019
Automotive Aftermarket – Slow start driven by weaker OES business and higher product costs
Sales by region | y-o-y growth EBIT4 Q1 2018 vs. Q1 2019 | in EUR mn
Q1 2018 Q1 2019 ∆1
Europe 338 321 -4.2%
Americas 78 88 +14.1% +0
-105 -1
Greater China 19 20 +1.1% -2
-4
Asia/Pacific 12 11 -9.6%
Total 447 441 -1.1%
Automotive Aftermarket sales growth by channel1
81 64
IAM2
OES3 EBIT Gross R&D Selling Administrative Others EBIT
Q1 2018 Profit expenses expenses expenses Q1 2019
Total
EBIT margin development4
-15% -10% -5% 0% 5%
18.1% -1.8%-pts +0.1%-pts -0.4%-pts -0.4%-pts -1.2%-pts 14.4%
Q1 2018 Q1 2019
1 FX-adjusted | 2 Independent Aftermarket | 3 Original Equipment Service 4 Before special items | 5 Includes negative FX effects of EUR 1 mn
193 Financial Results Q1 2019
Industrial – Q1 with continued growth momentum, gross margin increase offset by
higher overhead costs
Sales by region | y-o-y growth EBIT2 Q1 2018 vs. Q1 2019 | in EUR mn
Q1 2018 Q1 2019 ∆1
Europe 482 501 +4.4% +333
Americas 141 162 +9.1% -4
Greater China 131 155 +14.1% -10
-6
Asia/Pacific 70 77 +6.3% -10
Total 824 895 +6.9%
Industrial sales growth by sector cluster Q1 20191
92 95
Raw Materials
Railway
Power Transmission EBIT Gross R&D Selling Administrative Others EBIT
Two-Wheelers Q1 2018 Profit expenses expenses expenses Q1 2019
Wind
Industrial Automation
Aerospace EBIT margin development2
Offroad
11.2% +1.4%-pts -0.2%-pts -0.2%-pts -0.4%-pts -1.2%-pts 10.6%
Industrial Distribution
-5% 5% 15% 25% 1 FX-adjusted | 2 Before special items | 3 Includes positive FX effects of EUR 11 mn
203 Financial Results Q1 2019
4 Net income1 Q1 2019 EUR 137 mn – EPS Q1 2019 at EUR 0.21 (PY: EUR 0.36)
Net income1 | in EUR mn Key aspects
u Net income decreased to EUR 137 mn (Q1’18: EUR 238 mn)
-42.4%
u Decrease driven by lower EBIT
u EPS decreased to EUR 0.21 (Q1’18: EUR 0.36)
238 268 256 119 137
Q1 18 Q2 18 Q3 18 Q4 18 Q1 19 Schaeffler Value Added3 | in EUR mn
881 23.7% 23.1% 22.3%
19.9% 16.7%
15.0%
EPS2 | in EUR
0.36 0.41 0.38 0.18 0.21 902 952 939 787 556 421
1.33 2014 2015 2016 2017 2018 Q1 2019
(LTM)
ROCE before special items
1 Attributable to the shareholders of the parent company | 2 Earnings per common non-voting share 3 Defined as EBIT before special items minus Cost of Capital (10% × Ø Capital Employed)
213 Financial Results Q1 2019
5 Free Cash Flow before M&A1 FY at EUR -235 mn (PY: EUR -69 mn) – Capex Ratio Q1 19 at 10.3%
Free Cash Flow before M&A1 | in EUR mn Key aspects
-166 mn u FCF before M&A decreased to EUR -235mn (PY: EUR -69mn)
u Lower profitability and higher Capex
u FCF before M&A impacted by strategic investments, e.g. AKO Europe –
Underlying FCF before M&A at EUR -173 mn
201 257
-69 -5 -235
Q1 18 Q2 18 Q3 18 Q4 18 Q1 19 FCF Details | in EUR mn
Q1 Q1 ∆ Q1
FCF reported 2018 2019 18/19
-71 -5 202 96 -300 FCF as reported (71) (300) (229)
Non recurring items4 33 11 (22)
FCF Conversion ratio2
Investments5 19 51 32
24% 22% 17% 17% 10% M&A 2 65 63
Capex ratio3 Receivable Sale Program 0 0 0
(17) (173) (156)
8.6% 7.9% 7.4% 10.6% 10.3%
1 Before cash in- and outflows for M&A activities 4 Including payments for legal cases and restructuring measures | 5 Capex in major strategic projects,
2 LTM FCF before M&A divided by EBITDA before special items | 3 Capex in % of sales e.g. Agenda 4 plus One (AKO Europe, EDC, Focus)
223 Financial Results Q1 2019
6 Working Capital ratio 18.0% – Capex ratio 10.3% in Q1
Working capital1 | in EUR mn Capex3 | in EUR mn
2,575 2,737 2,672 2,219 2,579 306 289 262 375 373
Q1 18 Q2 18 Q3 18 Q4 18 Q1 19 Q1 18 Q2 18 Q3 18 Q4 18 Q1 19
1,232
in % of sales (LTM) in % of sales
18.4% 19.3% 18.7% 15.6%2 18.0% 8.6% 7.9% 7.4% 10.6% 10.3%
15.6%2 8.7%
1 According to balance sheet; figures as per the end of period
2 At December 31st, 2018, trade receivables with a carrying amount of EUR 166 mn
(net of retained default risks had been sold under the ABCP program 3 Cash view
233 Financial Results Q1 2019
7 Net debt of EUR 2,805 mn – Gearing ratio1 at 89%
Net financial debt and Gearing ratio | in EUR mn Key aspects
u Net debt increased slightly to EUR 2,805 mn (FY’18: EUR 2,547 mn) due
to seasonally negative FCF; Net leverage ratio2 at 1.3x
u Successful placement of Investment Grade bonds to refinance existing
indebtedness
u Early Repayment of the three Schaeffler Finance B.V. bonds scheduled
for May 15, 2019
2,439 2,833 2,644 2,547 2,805
Q1 18 Q2 18 Q3 18 Q4 18 Q1 19 Net debt development | in EUR mn
Gross debt 2.6
3,111 3,340 3,375 3,348 4,876
2.1
1.1 1.0 1.2 1.3
Cash & cash equivalents
672 507 731 801 2,071 5,778 4,889 2,636 2,370 2,547 2,805
Gearing ratio1
88% 106% 90% 83% 89% 2014 2015 2016 2017 2018 Q1 2019
Leverage Ratio2
1 Gearing ratio: Ratio of net financial debt to equity incl. non-controlling interests in % 2 Leverage Ratio: Net financial debt to EBITDA ratio before special items
244 Outlook
Guidance 2019 confirmed on Group and divisional level
Group Guidance Divisional Guidance
Actuals Guidance Automotive Automotive
Industrial
OEM Aftermarket
Q1 2019 FY 2019
Actuals Guidance Actuals Guidance Actuals Guidance
Q1 2019 FY 2019 Q1 2019 FY 2019 Q1 2019 FY 2019
Sales growth1 +0.4% 1 - 3%
-1.7% 1 - 3% -1.1% 1 - 3% +6.9% 1 - 3%
5.0% 6 - 7% 14.4% 15 - 16% 10.6% 10 - 11%
EBIT margin2 7.5% 8 - 9%
Market assumptions 2019
u Automotive OEM: Decrease of global passenger car production
Free Cash Flow3 EUR -235 mn ~ EUR 400 mn
of around minus 1%
u Automotive Aftermarket: Slower growth in the global vehicle population
and a nearly unchanged average vehicle age
u Industrial: Growth of industrial production of approximately 2%
1 FX-adjusted | 2 Before special items (Prior4: 2.6%)
3 Before cash in- and outflows for M&A activities 4 At March 6th 2019
254 Outlook
Conclusion & Outlook – Full focus on cost and capex discipline, cash generation and transformation
Q1 sales development impacted by subdued market conditions, better second
1
half expected in the Automotive divisions, but visibility remains low
Automotive OEM: Program RACE on track, on top, additional measures to reduce
2
production costs
Adapting execution
Automotive Aftermarket: SG&A efficiency measures to compensate for
3
headwinds
to a more complex
market environment
Industrial: Gross margin increased in Q1, program FIT to support earnings quality
4
going forward
Capex budgets further reduced in non-strategic areas, hurdle rates tightened,
5
stricter approval levels. Overhead cost discipline enforced across the board
264 Outlook
Financial calendar 2019 – CMD 2019 moved to September 11th, 2019
Roadshows Regular capital market communication
May 9th London May 8th Q1 2019 Earnings Release
May 10th Frankfurt Aug 6th Q2 2019 Earnings Release
Capital Markets Day 2019, Deutsche Bank IAA
May 16th Paris Sep 11th
Conference
May 23rd Toronto Nov 5th Q3 2019 Earnings Release
27IR Contact Investor Relations Phone: + 49 9132 82 4440 Email: ir@schaeffler.com Web: www.schaeffler.com/ir
Appendix

           A1   Business and Strategic Update

           A2   Automotive OEM

           A3   Automotive Aftermarket

           A4   Industrial

           A5   Backup

                                                29
A1: Business and Strategic Update
Transformation continues – Environment to remain challenging
Today 1u Environment remains challenging
w Subdued growth, low visibility
w Macroeconomic and geopolitical risks
w Technological changes
2u We concentrate on our strengths
Mobility for w Automotive and Industrial supplier with global
tomorrow
New strategy cycle customer base
w Technology & Industrialization excellence
“One Schaeffler” “Agenda 4 plus One” 2016 – 2020
w Strong balance sheet
BCT1
Vision 3u We take action
IPO Mission
Values w Executing existing efficiency initiatives / Agenda 4 plus
One
2012 – 2016 2016 – 2020 2021 and beyond
w New program RACE in Automotive OEM
1 Bearing & Components Technologies
w Increased cost and Capex discipline
30A1: Business and Strategic Update
Agenda 4 plus One – Progressing on schedule with completion ratio of 60%
Ø 60%
10% 25% 95% 100%
Initiate Plan Implement Close
Initiatives
►1 Customer Excellence 70%
►2 E-Mobility 60%
►3 Industry 4.0 60%
►4 Quality for Tomorrow 50%
►5 Global Footprint 65%
►6 Factory for Tomorrow 60%
►7 Shared Services 60%
►8 Process Excellence 40%
►9 Working Capital 100%
10
► Leadership & Corp. Values 65%
11
► Qualification for Tomorrow 60%
12
► New Work 75%
1
13
► Program CORE 100%
14
► Digital Agenda 40%
15
► IT 2020 25%
16
► Global Branding 70%
17
► Global Supply Chain 40%
18
► Auto. Kitting Operations 55%
19
► Global Reporting 50%
20
► Focus 40%
31A1: Business and Strategic Update
A Drive continuous improvement – Execution of efficiency initiatives progressing
Overview initiatives
Cost HCO1 Full
Start Efficiency Reduction Restructuring Financial Completion Completion
Date Target Target Cost Impact Focus Ratio at CMD2 Ratio now
CORE I 10/2015 ~ EUR 40 mn ~ 500 EUR 36 mn3 12/2018 Industrial 100% 100%
CORE II 10/2016 ~ EUR 90 mn ~ 400 EUR 45 mn4 12/2019 Industrial >50% 100%
Shared Services 10/2017 ~ EUR 25 mn ~ 100 EUR 39 mn5 12/2022 Group 35% 55%
Auto OEM/
BCT6 5/2018 ~ EUR 60 mn ~ 950 EUR 26 mn7 12/2021 5% 20%
Industrial
+
New program RACE in Automotive OEM
1 HCO = Headcount | 2 20th of September 2018 | 3 Booked in 2015 | 4 Booked in 2016 | 5 Booked in 2017 | 6 Bearing & Components Technologies | 7 Booked in 2018
32A1: Business and Strategic Update
B Enhance competitiveness in Auto OEM – RACE program
1 An Efficiency and Portfolio optimization program
2 Led by Matthias Zink, CEO Automotive OEM, started end of 2018
Aimed at structurally improving competitiveness of the Automotive OEM division
3
in three waves
Program
RACE1 is 4
Focusing on 6 key levers – Plant Footprint in Europe, Portfolio alignment,
Overhead cost, R&D prioritisation, Capital Efficiency, Order Intake
Starting with a first wave targeting an EBIT-Margin improvement of around
5 100 bps or EUR 90 mn2 in 2021/2022 out of one-time restructuring costs of
around EUR 60 mn3 in 2019
Designed to create long-term value and secure a high single-digit EBIT margin
6
1 RACE = Regroup Automotive for higher Margin and Capital Efficiency in the mid-term
2 Full run-rate | 3 First indication
33A1: Business and Strategic Update
B Efficiency and Portfolio Optimization – Execution in three waves
Business portfolio | Automotive OEM Execution | Program RACE
Growth Impact
New business
Wave 3
+
Wave 2
Core business
Wave 1
Capital 2019 2020 2021 2022 2023 Mid-
Efficiency and beyond term
Time
34A1: Business and Strategic Update
B RACE Wave 1 – 100 bps EBIT margin improvement
Wave 1 – Levers and Targets Financial impact | in EUR mn
Footprint EUR 90 mn2
1 Consolidate up to five Automotive plant locations in Europe
Europe
Cost
2 Reduce around 900 jobs, thereof around 700 in Germany
efficiency
Divest/exit selected non-core businesses in particular within
Portfolio
3 business divisions Engine/ Transmission systems and reinvest
adjustment
proceeds in strategic growth areas 90%4 100%4
R&D/sales ratio for Automotive OEM to be restricted to
R&D priori- EUR -60 mn3
4 8.0% - 8.5% in 2019 and 2020 with ongoing shift towards
tisation 2019 2020 2021 2022
strategic growth areas
Capital Reduce Capex to below EUR 900 mn1 p.a. for Automotive OEM
5 Key assumptions
efficiency and strengthen capital discipline
u Continuation of volatile and uncertain environment
Order Increase order intake in E-Mobility and Chassis Mechatronics by
6 u Neither severe recession nor strong recovery
intake EUR 1.5 - 2.0 bn p.a. in the next 3 years
1 Including allocated Capex | 2 Full run rate | 3 First indication to be further validated
u Measures aligned in consultation with workers’
4 Percentage of full financial impact achieved councils
35A1: Business and Strategic Update
B Program RACE – Growth prospects, order intake and outperformance
Vision Powertrain World Light Vehicle Production in mn Key aspects
117
110 u Technological competence and innovative strength complemented via
102
30% Electric Vehicle bolt-on acquisitions
Hybrid Electric
u High Potential in E-mobility from Electrification / Hybridization and in Chassis
40% Vehicle Mechatronics
Combustion Engine
u Continuously improving Order Intake (2018: EUR 12.6 bn vs. EUR 11.3 bn 2017)
30%
and Book-to-Bill Ratio (1.4x in 2018 vs 1.3x in 2017)
2020 2025 2030
u Long-term outperformance of the market by around 4%-pts
Vision Chassis1 World Light Vehicle Production in mn
117 117
110
9% L5 Autonomous
13%
18% L4 Fully automated
14% L3 Highly automated
96% 81% ≤ L2
59% Partially automated
or less
2025 2030 2035
1 Source: IHS Autonomy and McKinsey / Values based on Light Vehicles < 6 tons only
36A1: Business and Strategic Update
C We take action – Improve cost and Capex discipline, optimize portfolio
Cost discipline Capex discipline
u Overhead cost to be harmonized with sales growth development u Capex to sales ratio limited to 6-8% of sales, stricter allocation to
growth areas (“earn the right to grow”-logic)
u Hiring freeze1 for all overhead and indirect functions u Capex Committee strengthened, hurdle rates (Gross Profit, NPV, IRR)
tightened
u Additional measures to be introduced to improve productivity in plants u Strict target set for the Short Term Bonus (20% share) to incentivize
more proactive cashflow management (zero bonus in case target
1 Except for high growth areas is missed)
Acquisitions/Divestments 2016 - 2018 Portfolio optimization Acquisitions/Divestments/Exits going forward
Elmotec Statomat 2018
Technology-oriented,
in Schaeffler Paravan JV 2018 in bolt-on acquisitions
EUR 100 - 500 mn
Compact Dynamics 2017
2016 Schaeffler Motorenelemente Assets under review,
out Non strategic business within out
2016 Schaeffler Suisse – Hydrel Engine/Transmission
M&A radar with 7 search fields
37A2: Automotive OEM
Automotive OEM – FY 2018 overview
Sales by business division | in EUR mn EBIT2 2017 vs. 2018 | in EUR mn
FY 2017 FY 2018 ∆1
Engine Systems 2,786 2,783 +2.1%
Transmission Systems 4,204 4,170 +1.4%
E-Mobility 416 486 +18.1%
-2583 6 -14 -30 16
Chassis Systems 1,585 1,558 +0.1%
Total 8,991 8,997 +2.1%
Automotive OEM sales and market development 2018
973 693
+5.6%
+0.9% +1.2% +2.3%
+1.0% EBIT Gross R&D Selling Administrative Others EBIT
FY 2017 Profit expenses expenses expenses FY 2018
-0.5% -0.1%
-3.8%
Europe Americas Greater China Asia/Pacific EBIT margin development2
World production: -1.1%
10.8% -2.9%-pts +0.1%-pts -0.1%-pts -0.4%-pts +0.2%-pts 7.7%
Production of light vehicles 2018 vs. 2017 (IHS)
Schaeffler Automotive OEM: +2.1%1
Sales growth Schaeffler Automotive OEM 2018 vs. 2017 1 FX-adjusted | 2 Before special items | 3 Includes negative FX effects of EUR -64 mn
38A2: Automotive OEM
Product portfolio – Broad drivetrain know-how
Engine systems Transmission systems
31% 46%
of Automotive OEM sales in 2018 of Automotive OEM sales in 2018
u Valve train components & u Clutch systems, E-clutches
systems
u Damping technology
u Variable camshaft timer (e.g. dual mass flywheels)
u Belt & chain drive systems u Double-clutch transmissions
u Thermal management u Torque converter
modules
E-Mobility Chassis systems
5% 17%
of Automotive OEM sales in 2018 of Automotive OEM sales in 2018
u Hybrid modules u Chassis bearings
u E-Axles u Wheel bearings
u Actuators, CVT technologies u Ball screw drives for steering
systems
u Wet double clutches
u Active mechatronic roll control
39A2: Automotive OEM
Vision Powertrain – Market moving towards the accelerated scenario
Accelerated Scenario Regionalized Accelerated Scenario 2030
ICE HEV BEV ICE HEV BEV
Global vehicle production (in mn units) Global vehicle production (in mn units)
38
CAGR 2010/2030 120
111 29
101 37%
2% 30%
15%
89 13% 36%
20
74
35%
24%
40% 43%
9
45% 35%
97% 85% 5 3% 4 9 6
99% 2% 22%
50% 22% 28% 9%
2% 52%
30% 41% 57% 33%
20% 75%
19% 96%
15% 58%
26%
2010 2015 2020e 2025e 2030e EMEA North South Greater India Korea Japan SEA
Source: IHS and Schaeffler Assumptions / Values based on Light Vehicles < 6 tons only, ICE = America America China
Internal Combustion Engine; HEV = Hybrid Electric Vehicles ranging from 48V Mild Hybrid to PHEV,
BEV = Battery Electric Vehicles (incl. Fuel Cell Electric Vehicles)
40A2: Automotive OEM
Vision Chassis – Market shifting towards autonomy
Vision Chassis Steer-By-Wire Systems
≤L2 L3 L4 L5
Global vehicle production (in mn units) Key growth technology for automated vehicles
by allowing the steering wheel to disappear
117 117 conditionally or being eliminated entirely
110 4% 9%
102 Fitment rate
13% Definition
18% Steer-by-Wire
14% L5 Autonomous 100 %
100% 96%
Automation Level
81%
59% Fully
L4 20 - 30%
automated
Highly
2020 e 2025 e 2030 e 2035 e L3 20 - 30%
automated
Source: IHS Autonomy and McKinsey / Values based on Light Vehicles < 6 tons only
L0 = No Automation, L1 = Driver Assistance, L2 = Partial Automation, L3 = Conditional Automation, L4 = High Automation, L5 = Full Automation
41A2: Automotive OEM
E-Mobility – Content per vehicle
excl. Aftermarket, Heavy
Duty & Motorcycles
Content per Vehicle1 2 HEV
1 ICE 3 BEV
in EUR
x 1.5 x 2.5
~150 x 4.0
~125
~100
~90
~60
~25
2016 2025 2016 2025 2016 2025
No. of light vehicles2 90 mn 56 mn 3 mn 39 mn 0.5 mn 16 mn
Average Content per Vehicle 2025
~EUR 130 2
~6% CAGR 3
1 Average Schaeffler Content per light vehicles produced world wide (excluding Aftermarket, Heavy Duty & Motorcycles content) | 2 according to Schaeffler Accelerated Scenario
3 Market Growth 2016-2025: 1.8% (Source: IHS; July 2017) + Content per Vehicle growth ~4%
42A2: Automotive OEM
Schaeffler e-Axle transmission is driving the brand new Audi eTron Quattro
E-Axle subsystems 2018 Schaeffler‘s new Lightweight E-Axle Transmissions for the Audi eTron Quattro
SOP Q3/2018 u Schaeffler supplies both E-Axle
Power Electronics Transmissions for the new Audi eTron
Quattro
u Both E-Axles are based on Schaeffler‘s
E-Machines patented Lightweight Differential
technology
u The rear axle is build in coaxial design and
Rear:
Coaxial design sets a new benchmark in power density
E-Axle Transmission
1-speed E-Axle (230 Nm/kg).
Transmission u The front axle is build in parallel design
and includes a parking lock with electro-
Front:
Actuators Parallel design 1- mechanical actuator
speed E-Axle
Transmission with Best-in class
integrated electr. power density for
mech. parking lock E-Axle transmissions:
Software 230 Nm/kg
43A2: Automotive OEM
E-Mobility – Production technology gap closed
Stator Manufacturing Processes
in series production at Schaeffler today
Rotor Manufacturing Processes
prototyping machines available at Schaeffler
ext. supplier technology as of today
Production Technology Elmotec Statomat
with wave-winding technology
E-Motor
Schaeffler already covered the majority of the E-Motor production processes
With this acquisition we are closing now the last remaining production technology gap
Ready to produce by 2020
44A3: Automotive Aftermarket
Automotive Aftermarket – FY 2018 overview
Sales by region | y-o-y growth EBIT4 2017 vs. 2018 | in EUR mn
FY 2017 FY 2018 ∆1
Europe 1,375 1,393 +2.5% -325
0 -19
Americas 403 340 -5.2% -6 15
Greater China 57 76 +36.5%
Asia/Pacific 45 50 +12.5%
Total 1,880 1,859 +2.2%
Automotive Aftermarket sales growth by channel 20181
358 316
IAM2
OES3 EBIT Gross R&D Selling Administrative Others EBIT
FY 2017 Profit expenses expenses expenses FY 2018
Total
EBIT margin development4
-15% -10% -5% 0% 5% 10% 15% 20%
19.0% -1.4-pts 0%-pts -1.1%-pts -0.3%-pts +0.8%-pts 17.0%
FY 2017 FY 2018
1 FX-adjusted | 2 Independent Aftermarket | 3 Original Equipment Service 4 Before special items | 5 Includes negative FX effects of EUR -27 mn
45A3: Automotive Aftermarket
Business in 2025 is shaped by today's registrations – 20+ years lifecycle
6 – 8 years OE lifecycle followed by 20+ years in the Aftermarket Key aspects
Annual Volumes
u Lifetime revenue potential in Independent
Aftermarket typically near half of revenues
OE Independent in OE lifecycle – for applicable product
Aftermarket groups
OES
u Change in powertrain technology has only
limited impact on global car fleet or
0 10 20 years Aftermarket revenues potential in the short-
SOP EOP
With respect to Schaeffler product portfolio and mid-term (20+ years lifecycle)
u Our best-selling product currently is our
Example – VW Golf RepSet Dual Mass Flywheel for VW Golf
SOP 2003 – EOP 2008
produced in 2003-2008
u Short- and mid-term growth will come from
increased need for repair/maintenance
solutions due to more and ageing vehicles
46A3: Automotive Aftermarket
Our markets continue to grow – Great potential in China
Vehicle population 1.3 1.6 bn Key growth drivers
Million units (PC/LCV)
2017 2023 u Global vehicle fleet will grow at 3.2% CAGR
619.7
531.2 2017-2023
453.3
420.2 u Vehicle age will continue to grow, especially in
331.4 China
200.3 175.9 196.9
u Total aftermarket revenues globally will grow
from EUR 803 bn to EUR 1,196 bn (+3.1% CAGR
2017/2030)
Europe Americas Greater China AsiaPacific Source: IHS; Feb 19
Vehicle age
Average age in years (PC/LCV)
9.7 10.0 years Total aftermarket revenues
in EUR bn
2017 2023
11.5 12.0
Global +3.1%
10.2 10.4
9.0 CAGR
8.5
1,196 China +7.5%
6.5 803 CAGR
5.2
91 233
2017 2030 2017 2030
Europe Americas Greater China AsiaPacific Source: IHS; Feb 19 Source: McKinsey “Ready for Inspection - the Automotive Aftermarket in 2030” - Jul 18
47A3: Automotive Aftermarket
Growth drivers in the Independent Aftermarket – Components and Solutions
Components Solutions Outlook
u Traditional business with replacements parts u Complete sets and kits for u Trends in OEM business fuel future
u Growing with global vehicle fleet plug n' play repair solutions Aftermarket potential
u Growing with average vehicle age u Increasing vehicle complexity leads to u Repair solutions will remain core growth
increasing need for information driver going forward
on workshop level u Additional aftermarket potential from
u Total repair costs are dominated intelligent repair solutions
by labour costs, driving more and more for E-axles and hybrid modules
comprehensive, all-in-one quality repairs
48A4: Industrial
Industrial – FY 2018 overview
Sales by region | y-o-y growth EBIT2 2017 vs. 2018 | in EUR mn
FY 2017 FY 2018 ∆1
-7 -1 -9 9
Europe 1,804 1,906 +7.3%
Americas 575 596 +9.7%
Greater China 472 575 +25.4% 1273
Asia/Pacific 299 308 +5.6%
Total 3,150 3,385 +10.1%
Industrial sales growth by sector cluster 20181
253 372
Raw Materials
Railway
Power Transmission EBIT Gross R&D Selling Administrative Others EBIT
Two-Wheelers FY 2017 Profit expenses expenses expenses FY 2018
Wind
Industrial Automation
Aerospace EBIT margin development2
Offroad
8.0% +1.8%-pts +0.1%-pts +0.9%-pts -0.1%-pts +0.3%-pts 11.0%
Industrial Distribution
0% 10% 20% 30% 1 FX-adjusted | 2 Before special items | 3 Includes negative FX effects of EUR -42 mn
49A4: Industrial
Industrial portfolio – Broad range of standard and customized products
Standard product business
Ball Bearings Cylindrical Spherical Tapered Needle Roller Linear Plain bearings Mechatronics Systems
Roller Bearings Roller Bearings Roller Bearings Bearings Technology
Ball bearing Cylindrical roller Spherical roller Tapered roller Needle roller Linear guides Plain bearing VarioSense Housing
(DGBB) bearing (CRB) bearing (SRB) bearing (TRB) bearing (NRB) and SmartCheck
Customized product business
Cronitect-hybrid Heavy duty CRB – Coated SRB – Wheelset bearing – "Slimline" drawn cup Six-row linear Spherical plain Sensorized rotary Linear System –
bearing – Bicycle Construction Machin. Windpower rotor Highspeed trains NRB – Gearbox recirculating ball bearing with special table bearing & Industrial
bearing bearing – coating - Marine sensorized linear guide Automation
Machine Tool RUE 4.0 – Machine Tool
50A4: Industrial
Portfolio evolution – From components to Industry 4.0
Portfolio Region Sector split Channel
Wind
Raw
Materials
Europe
Aerospace
OEM & MRO
Railway
Offroad
Two
Wheelers
Americas
Power
Transmission
Greater
Distribution
China Industrial
Automation
Asia Pacific
51A5: Backup
Key figures by Group and division
Adjusted comparative
figures 2018
Group | in EUR mn Automotive Aftermarket | in EUR mn
Q1’18 Q2’18 Q3’18 Q4’18 Q1’19 Q1’18 Q2’18 Q3’18 Q4’18 Q1’19
Sales 3,551 3,642 3,521 3,527 3,622 Sales 447 480 476 459 441
Sales Growth1 +3.9% +7.9% +3.7% +0.3% +0.4% Sales Growth1 -4.4% +12.3% -3.0% +5.0% -1.1%
EBIT Reported 391 382 376 205 230 EBIT Reported 81 96 88 76 64
EBIT bsi 391 404 355 231 272 EBIT bsi 81 96 85 76 64
EBIT bsi margin 11.0% 11.1% 10.1% 6.5% 7.5% EBIT bsi margin 18.1% 20.0% 17.9% 16.6% 14.4%
Automotive OEM | in EUR mn Industrial | in EUR mn
Q1’18 Q2’18 Q3’18 Q4’18 Q1’19 Q1’18 Q2’18 Q3’18 Q4’18 Q1’19
Sales 2,280 2,307 2,191 2,218 2,286 Sales 824 855 854 850 895
Sales Growth1 +3.2% +6.5% +3.2% -4.2% -1.7% Sales Growth1 +10.8% +9.3% +9.4% +11.0% +6.9%
EBIT Reported 218 193 181 70 59 EBIT Reported 92 93 107 59 108
EBIT bsi 218 203 168 84 113 EBIT bsi 92 105 102 71 95
EBIT bsi margin 9.6% 8.8% 7.7% 3.8% 5.0% EBIT bsi margin 11.2% 12.3% 11.9% 8.4% 10.6%
1 FX-adjusted
52A5: Backup
Automotive OEM Outperformance by quarters
FY 19 (YTD) Q1 19
Outperformance: +5.0pp
Outper-
IHS1 Auto OEM2 formance
World -6.7% -1.7% +5.0pp
Americas -2.7% +12.4% +15.1pp
Europe -7.0% -3.3% +3.7pp
Greater China -13.7% -14.5% -0.8pp
Asia/Pacific -0.1% +2.4% +2.5pp
FY 18 Q1 18 Q2 18 Q3 18 Q4 18
Outperformance: +3.1pp
Outper- Outper- Outper- Outper-
IHS1 Auto OEM2 formance IHS1 Auto OEM2 formance IHS1 Auto OEM2 formance IHS1 Auto OEM2 formance
World -0.1% +3.2% +3.3pp +4.7% +6.5% +1.8pp -2.7% +3.2% +5.9pp -5.6% -4.2% +1.4pp
Americas -1.4% +3.7% +5.1pp -0.7% +3.7% +4.4pp +1.9% +9.9% +8.0pp +1.0% +5.1% +4.1pp
Europe +2.4% +0.4% -2.0pp +6.6% +4.6% -2.0pp -4.0% +1.6% +5.6pp -6.7% -2.7% +4.0pp
Greater China -1.6% +12.4% +14.0pp +10.5% +14.5% +4.0pp -4.5% +2.5% +7.0pp -15.5% -17.4% -1.9pp
Asia/Pacific -0.7% +0.5% +1.2pp -0.4% +7.6% +8.0pp -3.0% -0.7% +2.3pp +8.0% +2.1% -5.9pp
1 LVP Growth according to IHS Markit (April 2019) | 2 FX-adjusted Sales Growth Automotive OEM division
53A5: Backup
Impact of IFRS 16 accounting standard
IFRS 16 Definition of Free cash flow (FCF) after IFRS 16
u IFRS 16 – Leases is a new financial reporting standard u Modification of FCF definition to keep comparability to FCF used
for the accounting of lease agreements under IFRS 15 and before
u As of January 1st, 2019, Schaeffler has to capitalize u New definition includes principal portion of the lease liabilities
all affected monthly lease payments from Cash flows now used in financing activities
u Examples of relevant contracts are all rental agreements Before IFRS 16 IFRS 16
for buildings, lease agreements for cars, lease contracts for Cash flows from Cash flows from
transportation equipment and other miscellaneous equipment operating activities operating activities
Implications for Schaeffler Incl. lease expenses
+
u Visible impact on the balance sheet due to the initial recognition + Cash flows used in
of the right of use assets and lease liabilities
Cash flows used in investing activities
u Lease expenses will be shown as depreciation and interest. investing activities
Overall very limited impact on income statement +
u Visible impact on the cash flow statement due to the shift
= Principal portion of the lease liability cash flows
of the lease expenses from the cash flows of operating activities
to the cash flows used in financing activities (IAS 7, IFRS 16)
Free cash flow =
u No impact on Net debt Free cash flow
54A5: Backup
Overview Corporate and Financing Structure
Corporate structure (simplified) | as of March 31, 2019 Financing structure | as of March 31, 2019
INA-Holding Schaeffler A IHO Verwaltungs GmbH Nominal Nominal Rating
GmbH & Co. KG Debt instrument (USD mn) (EUR1 mn) Interest Maturity (Fitch/Moody’s/S&P)
Loans Term loan (EUR) - 750 E+2.25% Dec-22 Not rated
100% RCF (EUR 250 mn) - 8 E+2.25% Dec-22 Not rated
Bonds 2.75% SSNs 2021 (EUR) - 750 2.75% Sep-21 BB+/Ba1/BB+
IHO Beteiligungs GmbH 4.125% SSNs 2021 (USD) 500 437 4.125% Sep-21 BB+/Ba1/BB+
3.25% SSNs 2023 (EUR) - 750 3.25% Sep-23 BB+/Ba1/BB+
4.50% SSNs 2023 (USD) 500 437 4.50% Sep-23 BB+/Ba1/BB+
100%
3.75% SSNs 2026 (EUR) - 750 3.75% Sep-26 BB+/Ba1/BB+
4.75% SSNs 2026 (USD) 500 437 4.75% Sep-26 BB+/Ba1/BB+
A IHO Verwaltungs GmbH Total IHO Verwaltungs GmbH 4,318 Ø 3.49%2
B Schaeffler AG Nominal Nominal Rating
Free Free
Debt instrument (USD mn) (EUR1 mn) Interest Maturity (Fitch/Moody’s/S&P)
float float
Loans Term loan (EUR) - 500 E+0.80% Sep-23 Not rated
RCF (EUR 1,500 mn) - - E+0.50% Sep-23 Not rated
Investment Facility (EUR 250 mn) - 184 E+1.00% Dec-22 Not rated
Bonds 2.50% SNs 2020 (EUR) - SFBV3 - 400 2.50% May-20 4 BBB-/Baa3/BBB-
24.9% 75.1% 36.0% 10.0% 54.0%
3.50% SNs 2022 (EUR) - SFBV3 - 500 3.50% May-22 4 BBB-/Baa3/BBB-
4.75% SNs 2023 (USD) - SFBV3 600 534 4.75% May-23 4 BBB-/Baa3/BBB-
1.125% SNs 2022 (EUR) - 750 1.125% Mar-22 BBB-/Baa3/BBB-
B Schaeffler AG Continental AG 1.875% SNs 2024 (EUR) - 800 1.875% Mar-24 BBB-/Baa3/BBB-
3.25% SNs 2025 (EUR) - SFBV3 - 600 3.25% May-25 BBB-/Baa3/BBB-
1 EUR/USD = 1.1235 | After redemption of called bonds: 2.02%; incl. commitment and utilization fees
2 2.875% SNs 2027 (EUR) - 650 2.875% Mar-27 BBB-/Baa3/BBB-
3 Bonds issued by Schaeffler Finance B.V., guaranteed by Schaeffler AG Total Schaeffler Group 4,918 Ø 2.50%2
4 Bonds have been called for redemption and will be redeemed in full on 15th May 2019
55You can also read