FIRST-HALF 2019 RESULTS PRESENTATION - "A WORLD OF NICHE MARKET LEADERS" - Chargeurs
←
→
Page content transcription
If your browser does not render page correctly, please read the page content below

FIRST-HALF 2019 RESULTS PRESENTATION
"A WORLD OF NICHE MARKET LEADERS"

Ramp-up of the Group’s transformation process to
accelerate its upscaling

Michaël FRIBOURG
Chairman & Chief Executive Officer

Olivier BUQUEN
Chief Financial Officer               September 12, 2019

SUMMARY

Chargeurs – First-Half 2019 Results – September 12, 2019             ―2

Chargeurs is standing firmly by its strategic growth targets in a
                               more volatile environment                                   (1/3)

                                                           Creating global champions in niche markets with a high value-added, low capital intensity and
                                                           strong growth potential
                 Our core business                            ➔ In the space of 4 years, the Group has become no. 1 worldwide in each of its businesses

                                                           Over 90% of revenue generated
                                                           outside France
                                                                                                     Full-year revenue                Growth track for target of €1bn in revenue and an
                                                           Higher profitability                                                                  operating margin of >10%
                                                                                                         (€ million)
                                                           A growth plan that is regularly
                                                           reinforced
                                                           Confirmation of our revenue targets:                                                                                         1,000

                   Our aims and                                  > €750m by 2020,
                                                                                                           620
                                                                 including future acquisitions
                   objectives                                    > €1bn by the end of 2021 in              ROP                                                                          ROP
                                                                                                                                                                                        >10%
                                                                                                          > 8.5%
                                                                 full year
                                                                                                           2018          Organic growth   Arbitrage on low-profit   External growth   End of 2021
                                                                 Diversified sources of growth:                                                  revenue                               (Full year)

                                                                 like-for-like and acquisition-led

Chargeurs – First-Half 2019 Results – September 12, 2019                                                                                                                                             ―3
Chargeurs is standing firmly by its strategic growth targets in a
                               more volatile environment                                   (2/3)

                                                           ⚫   Increasing operating margins over the long term in all of our businesses by constantly keeping
                                                               them on a tight rein
                                                           ⚫   Putting in place a strong strategy aimed at:
                                                               ▪ Evenly weighting our worldwide coverage
                                                                 ➔ Ultimate objective: 1/3 Europe, 1/3 Americas, 1/3 Asia

                         Our strategic                         ▪ Evenly weighting the contribution from our various businesses
                                                                 ➔ Ultimate objective: 40% materials, 30% textiles and 30% new businesses (CTS)
                         approach,                             ▪ Reinventing low-profit businesses to boost performance, and investing in high-potential
                         underpinned by                          businesses
                                                                 ➔ Example: Creation within CTS of Chargeurs Creative Collection, a leader in materials and
                         the Game                                services for museums
                         Changer plan                      ⚫   Acquisitions of high value-added companies
                                                               ▪ International champions bought for a good price and well integrated

Chargeurs – First-Half 2019 Results – September 12, 2019                                                                                                        ―4
Chargeurs is standing firmly by its strategic growth targets in a
                               more volatile environment                                  (3/3)

                                                           ⚫   Heavy investments to futureproof the Group:
                                                               ▪ TSC1, acquisitions of PCC and Leach in 2018
                   Our                                     ⚫   Regular dividend payments to our shareholders since 2015
                   achievements                            ⚫   Strategy of capturing growth and remaining resilient in a difficult operating environment
                                                           ⚫   €19m increase in annual recurring operating profit since 2015

                                                               A stronger capital base for our reference shareholder ➔ Confidence in our future
         Our commitment                                        Significant financial flexibility and low debt: no leverage covenant, long-term financing
                                                               (> 7 years)

                                                               €1bn in revenue
        Our success
                                                               Recurring operating margin > 10%
        indicators for 2022
                                                               Solid cash generation

Chargeurs – First-Half 2019 Results – September 12, 2019                                                                                                   ―5
H1 2019 – one of the Group’s best-ever first-half performances despite the
                               economic environment and a peak in opex and capex                     (1/2)

                                                           ⚫   H1 2019: revenue up 13.6%, EBITDA up 6.2% and cash flow up 5.1%; return to like-for-like growth in Q2 2019
                                                           ⚫   H1 2019 recurring operating profit of €22.7m – one of the Group’s best-ever first-half performances, despite:
                                                               ▪ An exceptionally high basis of comparison
                                                               ▪ The impact of the unfavorable economic context on Chargeurs Protective Films
         Resilience                                            ▪ The peak in opex and capex under the Game Changer plan
                                                           ⚫   A more balanced weighting of regions and businesses, limiting the temporary adverse effect of the economic
                                                               environment

                                                           ⚫   Management teams strengthened in our businesses for acquisitions and integrations
     Ongoing expenditure to                                ⚫   Higher expenditure on training, innovation and marketing ➔ better long-term mix
     futureproof the Group                                 ⚫   Cost-savings plan stepped up
     and productivity plan
     stepped up

                                                           ⚫   Recurring operating margin: 2018 = 8.5% ➔ 2022 target > 10%
                                                           ⚫   To reach the 2022 target, Chargeurs:
        Work on long-term                                      ▪ Will leverage synergies from its acquisitions: €2.5m per year expected as from 2020 -> 2/3 CFT-PCC and 1/3 CTS

        margins                                                ▪ Is increasing its production capacity for highly technical products: 4.0 coating line at CPF, Sublimis at CTS
                                                               ▪ Is focusing its innovation efforts on “green” products
                                                               ▪ Is intensifying its sales presence in growth markets
Chargeurs – First-Half 2019 Results – September 12, 2019                                                                                                                          ―6
H1 2019 – one of the Group’s best-ever first-half performances despite the
                               economic environment and a peak in opex and capex                     (2/2)
                                                           ⚫   9 first-rate acquisitions including Main Tape, CPSM (Asidium, Omma,                     Game Changer: sequence of investments and
                Ongoing                                        Walco), Leach, PCC and the 3 global champions making up the               2,5%
                                                                                                                                                           their impact on operating margin

                acquisitions                                   Chargeurs Creative Collection network
                                                                                                                                         2,0%
                strategy                                   ⚫   Solid pipeline of high profit potential acquisitions
                                                                                                                                         1,5%

                                                               ⚫   Majority of capex already underway                                    1,0%
     Reinforcement of                                          ⚫   Streamlining of structures and securing of new contracts and new
     businesses in a volatile
                                                                                                                                         0,5%
                                                                   market share
     economic environment                                      ⚫   Priority to cash flow generation and the optimization of WCR          0,0%
                                                                                                                                             2017        2018         2019        2020             2021
                                                                                                                                                    Game Changer Opex    Improvement in margin
Growth track for end-2021 confirmed (subject to macro-economic conditions remaining constant)
 Full-year revenue                             Growth track for target of €1bn in revenue
     (€ million)                                   and an operating margin of >10%
                                                                                                                ➔ ROP 2019 > ROP 2017
                                                                                           >1,000
                                                                   750        internal
                                                                    -         growth,
                                                                                                                ➔ Targets confirmed:
                             620          internal growth,                                                          • €1bn in revenue by 2021
         533                                  targeted
                                                                   800          new
                                                                             targeted                               • >10% normative operating margin from 2022
          ROP                ROP            acquisitions                                     ROP
                                                                            acquisitions
          8.3%               8.5%            underway                                      > 10.0%
      2017              2018                         2020 *                          end-2021
* Target of full-year revenue of €750m to €800m in 2020 including future acquisitions

                                                                                                                                                                                                     ―7
Chargeurs – First-Half 2019 Results – September 12, 2019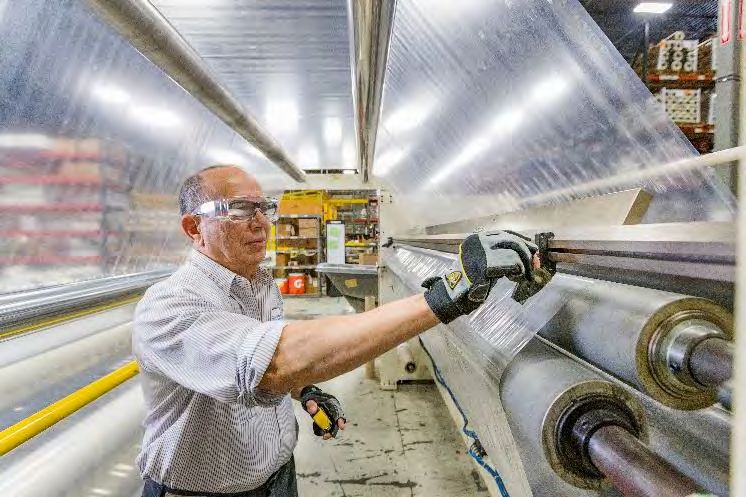
CONTENTS

                                                   1. Strategic review:
                                                      Well on track to meet our €1bn revenue target by 2021

                                                   2. Business and financial review

                                                   3. Outlook and opportunities

Chargeurs – First-Half 2019 Results – September 12, 2019                                                      ―8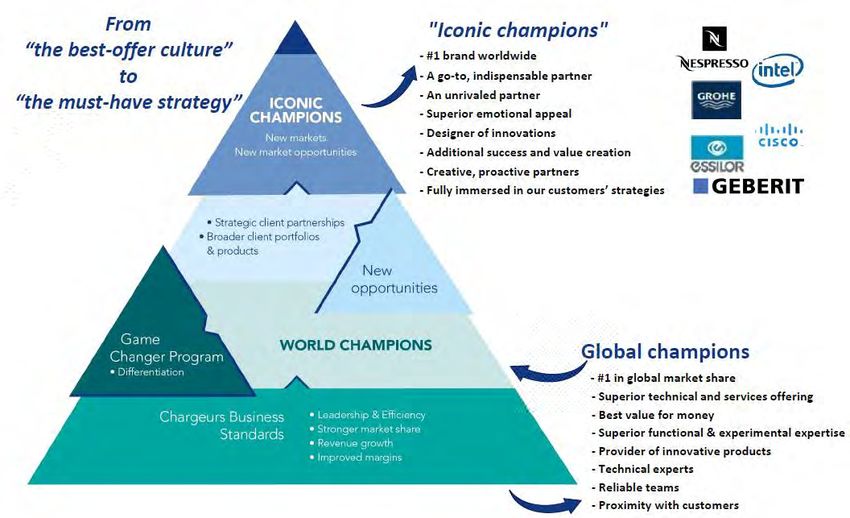
Chargeurs, a world leader in high value -added niche markets:
robust growth and well on track to meet its revenue target
AMERICAS EUROPE ASIA
WORLDWIDE
Leadership positions Industrial
IN NICHE MARKETS
excellence
OF LTM OF LTM OF LTM
SERVING OVER REVENUE REVENUE REVENUE
90
AT JUNE 30, 2019 AT JUNE 30, 2019 AT JUNE 30, 2019
CHARGEURS Surface quality
PROTECTIVE protection films
COUNTRIES
6 7 4
FILMS No. 1 worldwide
OVER 90% OF REVENUE
GENERATED IN
CHARGEURS INTERNATIONAL MARKETS
PLANTS PLANTS PLANTS
Technical textiles for the
PCC FASHION luxury and fashion
TECHNOLOGIES industries
A fast-growing Group
No. 1 worldwide
A SOLID
well on track to meet its revenue target
CHARGEURS
TECHNICAL
SUBSTRATES
Visual communications
and museum heritage
management and visitor
17 Full-year revenue
(€ million)
Growth track for target of €1bn revenue and
10% operating margin
Balance sheet
Signature of a
experience services PLANTS game-changing
No. 1 worldwide €230 million
>1,000
syndicated credit
16
800
CHARGEURS High-quality -
internal
agreement in
growth,
LUXURY combed wool 533
620 internal growth,
850 new December 2018, with
targeted
MATERIALS No. 1 worldwide ROP ROP acquisitions
targeted
ROP excellent financial
R&D AND QUALITY acquisitions
underway
LABORATORIES
8.3% 8.5% > 10.0%
terms and
2017 2018 2020 *
* Target of full-year revenue of €800m in 2020 including future acquisitions
end-2021
conditions
Chargeurs – First-Half 2019 Results – September 12, 2019 ―9
STRATEGIC REVIEW:
                                 1                         WELL ON THE WAY TO MEETING OUR €1BN REVENUE TARGET BY
                                                           2021

Chargeurs – First-Half 2019 Results – September 12, 2019                                                           ― 10
High strategic potential in all of our businesses
Sub-segments with high potential for growth and value creation
Leadership positions
IN NICHE MARKETS Sub-segments with
Growth
high potential for
sub-segments
value creation
CHARGEURS Surface quality ▪ Stainless steel
PROTECTIVE protection films
▪ Laminates and PMMA
FILMS ▪ Glass market
No. 1 worldwide ▪ Aluminum
▪ Pre-coated metals
CHARGEURS ▪ Ladieswear & Menswear ▪ Digital Brands
Technical textiles for the
PCC FASHION luxury and fashion ▪ Formal/Casual ▪ Childrenswear
TECHNOLOGIES industries ▪ Luxury Fast Fashion brands ▪ Uniforms and intimate
No. 1 worldwide
CHARGEURS Visual communications and ▪ Technical textile advertising ▪ Technical textiles
TECHNICAL
museum heritage ▪ Interior design ▪ Interior decoration
management and visitor
SUBSTRATES experience services
▪ Museum scenography ▪ Museum: Middle East, China
European leader
▪ Major Projects
CHARGEURS High-quality ▪ Fast Fashion brands
LUXURY combed wool ▪ Luxury fabrics
▪ Sportswear ▪ Uniforms
MATERIALS No. 1 worldwide ▪ Industrial application
Chargeurs – First-Half 2019 Results – September 12, 2019 ― 11Structural strengths reinforced in a volatile operating
environment
◼ 4 world leaders in niche industrial markets with high ◼ A strategy of targeted, value-creating acquisitions made
value added and low capital intensity possible thanks to a solid, flexible and low-cost financial
All of the Group’s businesses are under constant pressure to structure built up over the past 3 years
innovate, upscale, push their boundaries and enhance their The focus is on carrying out acquisitions when the underlying
financial profile business sector experiences a downturn, to make the most of
advantageous purchase conditions
◼ A rebalanced business portfolio to protect the Group
Recurring operating profit Recurring operating profit ◼ After a peak in capex in 2018/2019, the coming years
by division by division will be a “capex holiday” period
(LTM June 2017) (LTM June 2019)
CLM CLM
CTS 6% CTS 6%
8% 7%
CFT-PCC
16% CPF CFT-PCC CPF Clear revenue and margin targets that we are well on
70% 32% 55%
the way to meeting:
▪ €1bn in revenue by 2021
▪ > 10% normative operating margin as from 2022
Protecting the Group against the specific risks of each of its
businesses
Chargeurs - 2018 Annual Results Presentation - March 12, 2019 ― 12Successful upscaling since 2015, achieved thanks to a strict
model of operational excellence
Chargeurs is reaping the rewards of a committed and long-term strategy of excellence
A clear vision, Ongoing and tightly-controlled Quantitative & qualitative
with new management systems implementation value creation
Ensure the Sell more
Group’s lasting & better
management
strength
• A new management team Targeted and In-depth
Talent
• Hands-on management accretive segmentation of
markets served
• More international teams acquisitions and
and expansion to
diversification
• Promoting talent and encouraging mobility strategy new niche Focus on
sectors high-potential
Low net debt
major and
and LT resources
emerging clients Strong like-for-like
Systematic excellence growth
Vision methods +
Improving margins
• Effective • “Performance, Discipline,
Benchmark and stable Ongoing Product referrals by our +
shareholder structure
segmentation Ambitions” plan – a new committed over the very optimization clients and new market Healthy cash flow
based on niche momentum with very long term share
markets
of Chargeurs +
tight operational
discipline Unique culture of innovation Business Global expansion of our Acquisitions
• Leadership goals for a new generation of commercial, industrial and
in each of these • Game Changer plan – products and services Standards logistics reach -------------------------
niche markets pushing our own = Increase in the pace of
boundaries value creation
Ongoing Reengineering
deployment of and ramp-up of
resources
•
Financial
New ownership structure Chargeurs production and
logistics sites
• Stronger balance sheet Innovate and Business Systematic Improve
Unique strategy
• Launch of acquisition strategy make a difference
Standards
for lasting
programs
production
for productivity
• Higher visibility for shares in all of the Group’s competitiveness
and cost savings & customer
businesses service
Chargeurs – First-Half 2019 Results – September 12, 2019 ― 13A strategy underpinned by a stronger financial structure
Groupe ◼ Groupe Familial Fribourg significantly raised its investment in Chargeurs’ capital base in
Familial Fribourg
H1 2019 by becoming the controlling shareholder of Colombus Holding
controlling stake ⚫ Groupama – a blue chip, long-term investor – became a shareholder of Colombus Holding
Colombus ⚫ CM-CIC Investissement and BNP Paribas Développement reinvested in the capital of Groupe Familial
Holding Fribourg and retained their interest in Colombus Holding
27.60% ➔ This demonstrates a high level of confidence in Chargeurs’ ability to create strong
industrial and shareholder value over the long term
◼ Considerable increase in the Group’s financial flexibility over the last 12 months
⚫ December 2018: €120m in new money available after setting up a flexible and innovative syndicated loan
⚫ H1 2019: 2016 and 2017 Euro PP notes renegotiated better financial conditions and longer
maturities
▪ Leverage covenant removed
▪ Gearing requirement reduced to 1.2x
▪ Maturity extended by three years for Euro PP notes originally maturing in 2023
➔Average life of Group debt now 5.3 years
Chargeurs – First-Half 2019 Results – September 12, 2019 ― 14Game Changer: the Group’s performance acceleration plan (1/3)
SMART AND
ADVANCED
MANUFACTURING
Improving the performance of
Objective: our production assets
Reducing our production costs
• €1bn in revenue by 2021 Reducing our
TALENT
MANAGEMENT
non-quality
• > 10% normative operating margin as from 2022 SALES &
costs Implementing the
Excellence Training Program
MARKETING
Accelerating our Young
Developing the “soft skills” and Executive Program
of our sales teams
Optimizing our
Improving our customer organizational
→ Aimed at speeding up the Group's growth and intimacy structure
Developing new
profitability, designed in collaboration with all of marketing tools INNOVATION
Chargeurs' teams worldwide and focused on four Reviewing our addressable
adjacent markets
key areas Accelerating the development
of break-through innovations
Upscaling our innovation
capabilities, footprint
and network
Chargeurs – First-Half 2019 Results – September 12, 2019 ― 15Game Changer: a premiumization strategy underpinned by
measures to step up the plan (2/3)
Game Changer: an operating performance acceleration plan that advocates daily discipline in the creation of
long-term value and that is based on four key areas:
Sales and Marketing Smart & Advanced Innovation
Talent Management
Manufacturing
Chargeurs: A designer of leaders recognized in their niche markets whose operations are shaped according to four core
principles:
CUTTING-EDGE OPTIMIZED GLOBAL CUSTOMER-CENTRIC GLOBALLY-RECOGNIZED
TECHNICAL EXPERTISE SUPPLY CHAIN AND SERVICE- B2B BRANDS
MANAGEMENT ORIENTED
• Moving up the value chain
• Industry 4.0 • A global presence • Integrated solutions • Direct links with decision-makers
• Product innovation • Customer proximity • Service provider • Creation of recognized brands
• Technical know-how • Technical advice
Chargeurs – First-Half 2019 Results – September 12, 2019 ― 16Game Changer: a premiumization strategy underpinned by
measures to step up the plan (3/3)
Chargeurs – First-Half 2019 Results – September 12, 2019 ― 14A much larger geographic footprint since 2015 and strong growth
potential in the Americas and Asia
Key
Revenue A larger international
Production units footprint
Distribution units In 2015, Chargeurs generated over
Offices 90% of its revenue in international
Employees markets, with some 1,500
employees based in 32 countries.
45%
In 2019, Chargeurs will generate
over 94% of its revenue in
international markets, with more
24% 31% than 2,000 employees based in 45
countries.
Americas
+ 3% since 2015 (*)
4 to 6
7 to 10
2: unchanged Asia
251 to 303 Europe + 59% since 2015 (*)
+ 16% since 2015 (*) 3 to 4
4 to 7 12: unchanged
(*) Difference between LTM revenue at 15 to 14 4: unchanged
June 30, 2019 and annual revenue for 9: unchanged 498 to 764
2015
763 to 1,005
Chargeurs – First-Half 2019 Results – September 12, 2019 ― 18Cementing leadership positions at a faster pace thanks to carefully -purchased and
well-integrated acquisitions in high -potential segments (1/5)
Guided by the Chargeurs Business Standards, since 2015 Chargeurs has carried out targeted acquisitions, creating champions
in high value-added niche markets.
An ongoing and value-
creating acquisition strategy
Still to come:
> Game-changing “bolt-on”
acquisitions
€25m in revenue
> Pioneering international growth > Acquisitions to move up
> An exhaustive offer in museum the value chain
heritage and conservation
$80m in revenue > Acquisition of a new
operating segment
- Creation of an innovative
global champion
£10m in revenue > Strengthening service
> Disruptive vertical capacities
integration
€8m in revenue > Offering end-to-end
> Moving up the value chain solutions
> Offering integrated solutions
$27m in revenue
> Strengthening leadership in
the United States
> Adding production capacity
in the USD zone
Reinforcing and accelerating the Group’s leadership in all of its businesses
Chargeurs – First-Half 2019 Results – September 12, 2019 ― 19Cementing leadership positions at a faster pace thanks to carefully -purchased and
well-integrated acquisitions in high -potential segments (2/5)
⚫ PCC: $80m in revenue, of which more than 90% generated in Asia
⚫ 300 employees in a dozen countries, primarily in Asia and the United States
⚫ Leader in nomination
Specialist in ✓ 30 years of business growth
✓ 30 years of business growth
nomination ✓ Top 5 worldwide interlinings manufacturer
✓✓
TopLeading
5 leadingplayer
interlinings manufacturers
in women’s fashion
✓ Leading player in women’s fashion
Key player Powerful ✓ Decision-making at the heart of the Asian fashion industry, with Hong
✓ Decision-making
Kong-basedatheadquarters
the heart of the Asian fashion industry, with Hong Kong-based
in Asia brand headquarters
✓ Sales operations in more than 20 countries, mainly in Asia
✓ Sales operations in more than 20 countries, mainly in Asia
✓ An international player with a local approach
✓ Anand sales teams
international player close
with a to itsapproach
local major customers
and sales teams close to its major
Customer-centric ✓ A streamlined global sourcing strategy
customers
Agile
approach built on long-term
✓ A streamlined partnerships
global sourcing strategy builtwith qualified
on long-term supplierswith qualified
partnerships
model
suppliers
✓ An innovative business model
✓ Anin a constantly evolving
model in fashion industry
2 Guaranteed levels of
quality innovative business a constantly evolving fashion industry
✓ A consumer-centric sales strategy
Garment ✓ A consumer-centric sales strategy creating comprehensive solutions
Interlinings
makers
Brands Consumers creating comprehensive solutions
✓ Optimized response times to manage market expectations
✓ Optimized response times
1 Direct lines of to manage market expectations
communication
Chargeurs – First-Half 2019 Results – September 12, 2019 ― 20Cementing leadership positions at a faster pace thanks to carefully -purchased and
well-integrated acquisitions in high -potential segments (3/5)
One year on: PCC is successfully integrated
◼ Rebranding & integration
⚫ New name: ChargeursPCC Fashion Technologies
⚫ Offices and warehouses streamlined in Asia and Europe
⚫ Sales teams grouped together
⚫ World-class purchasing team set up
◼ Innovation
⚫ Product development center optimized
⚫ R&D work carried out in ultra-modern plants in Europe and Asia
⚫ Launch in 2020: Future of Fashion Gallery: a space devoted to innovation
◼ Sustainable development
⚫ Upcoming launch of a full range of interlinings made of eco-responsible materials
⚫ Even stronger world-leading position in sustainable development
◼ Training and skills-building
⚫ New training programs set up with ESMT and Harvard Business School
⚫ Greater diversity and more women members in management
➔ Chargeurs PCC Fashion Technologies is an iconic,
global, disruptive and premium brand, which has built
up a solid international leadership position
Chargeurs – First-Half 2019 Results – September 12, 2019 ― 21Cementing leadership positions at a faster pace thanks to carefully -purchased and
well-integrated acquisitions in high -potential segments (4/5)
A global benchmark for museum heritage
management and visitor experience services
Founded in the UK in 1891 Based in London
• Pioneer in large format graphic displays • Major player in project management for museums
• High-end visual communication solutions • Service offering ranging from concept design through to maintenance
for extremely prestigious international organizations • Working primarily with customers located in the Middle East and in direct
• Winner of the 2008 Queen’s Award for Enterprise, contact with international decision-makers
in recognition of over a century of pioneering and disruptive innovation
Founded in the Netherlands in 1910 Founded in London in 1982 and now present on four continents
• Strong international brand recognition, particularly in the Middle East • Solid experience in managing iconic international projects
• Turnkey solutions for exhibition installations and global experiential design
• Many prestigious international customers in some 50 countries
• Production insourced thanks to a new production site
• Winner of several design awards
1
9
Chargeurs – First-Half 2019 Results – September 12, 2019 ― 22Cementing leadership positions at a faster pace thanks to carefully -purchased and
well-integrated acquisitions in high -potential segments (5/5)
Chargeurs Technical Substrates: Leach is successfully integrated
◼ Development & integration
⚫ New panel of sales aids: website and promotional video and brochures
⚫ Reorganization of sales forces to boost customer proximity
⚫ Creation of Chargeurs Creative Collection, a new global champion in museum heritage
management and visitor experience services
⚫ Launch of a social media communications strategy
◼ Prestigious partnerships
⚫ The Brooklyn Museum:
▪ “Frida Kahlo: Appearances Can Be Deceiving”
▪ “Pierre Cardin: Future Fashion” exhibition
⚫ The Louvre: Partnership with Société des Amis du Louvre
◼ Sustainable development
⚫ Addition of upcycling offers to give printing media a second life
⚫ Launch of the LeachBox, a lightbox made with fully recyclable textile and which reduces
energy emissions by 30%
⚫ First-time use of blockchain technology, providing traceability for substrates right up to the
end-user
◼ Training and skills-building
⚫ Launch of an integration seminar for all CTS entities ➔ Leach is an iconic, global, disruptive and premium
⚫ New training programs set up with ESMT and Harvard Business School brand, which has built a solid international
leadership position
Chargeurs – First-Half 2019 Results – September 12, 2019 ― 23Launch of the Iconic Champions plan:
premiumization pursued
Chargeurs – First-Half 2019 Results – September 12, 2019 ― 24Premiumization accompanied by a high -potential marketing
strategy: High Emotion Technologies ®
This global marketing approach is designed to drive the upscaling of the Group and its businesses
A solid industrial heritage... ...Underpinning 3 fundamentals focused on ...which are drivers of accelerated
customer experience and product sublimation... growth
Unique Technology •Winning new market share
know-how Performance
• Highly profitable products
High-level •Premium brand positioning
technical Emotion Marketing •BtoB and BtoBtoC marketing
skills
• Stronger pricing power
• A powerful employer brand
Premium
customer • Internal performance driver
Appeal
service •Reinforced customer
High dialogue
Disruptive
Creation of “Intel Inside” effects, which go hand-in- • Customer-centric innovation
focused on service and
innovation hand with the premiumization of the Group’s Innovation customer experience
different businesses and will make dialogue •Supply chain excellence
between provider and end-user more successful
Chargeurs – First-Half 2019 Results – September 12, 2019
than ever. ― 252 BUSINESS AND FINANCIAL REVIEW
Resilient performances despite a less favorable environment
and the Group’s strategic decision to intensify capex and opex
Chargeurs – First-Half 2019 Results – September 12, 2019 ― 26H1 2019 down year on year on a like -for-like basis but still one of the Group’s
best first-half performances, and capex remaining high
Ramp-up of the Group’s transformation process to accelerate its upscaling
H1 2019
◼ Reported revenue increase fueled by acquisition-led growth in
an unfavorable economic context
Revenue €326.1m + 13.6%
◼ Return to growth in Q2 2019 after a contraction in Q1
EBITDA €32.5m 10.0% of revenue
Depreciation and ◼ Asset light model after a capex peak
amortization €9.8m 3.0% of revenue ◼ Game Changer rollout intensified with the launch of “green”
Recurring innovations and successful commissioning of the 4.0 production
unit
operating profit €22.7m 7.0% of revenue
◼ €0.20 interim dividend for 2019
Profit for
the period €8.3m 2.5% of revenue ◼ Solid financial structure and more financial flexibility
Cash flow €22.8m 7.0% of revenue ◼ On track to meet targets:
Gearing 0.5 x ⚫ €1bn in revenue by end-2021
⚫ > 10% normative operating margin as from 2022
Capex €16.3m 5.0% of revenue
Chargeurs – First-Half 2019 Results – September 12, 2019 ― 27Half-year performances since 2015
Revenue EBITDA Recurring operating profit
+27% since 2015 +57% since 2015 +47% since 2015
326.1
32.5
30.6 24.8
29.1 23.5
22.7
287.1
281.8
20.3
25.3
256.6 253.5
20.7 15.6
6.1% 8.0% 8.3% 8.6% 7.0%
8.1% 10.0% 10.3% 10.7% 10.0%
€m €m €m
H1 2015 H1 2016 H1 2017 H1 2018 H1 2019 H1 2015 H1 2016 H1 2017 H1 2018 H1 2019 H1 2015 H1 2016 H1 2017 H1 2018 H1 2019
Attributable net profit Cash generated by operations ◼ Upscaled since 2015
recurring dividend strategy +48% since 2015 ◼ Increasingly solid fundamentals
22.8
15.3 21.5 21.7 ◼ Ever-stronger global leadership in all of our
13.1 13.9 19.4
businesses
15.5
8.0 8.3
➔ Well on the way to meeting our targets of €1bn
€m
in revenue by end-2021 and a normative operating
€m
margin of over 10% as from 2022
H1 2015 H1 2016 H1 2017 H1 2018 H1 2019 H1 2015 H1 2016 H1 2017 H1 2018 H1 2019
Chargeurs – First-Half 2019 Results – September 12, 2019 ― 28H1 2019: revenue up by more than 13% compared with the record
high of H1 2018 and despite an unfavorable operating context
Strong revenue growth in all regions fueled by recent acquisitions
First half Change 19/18
(1)
In euro millions 2019 2018 Reported lfl
Europe 151.3 146.6 +3.2% +0.6%
Americas 77.2 71.3 +8.3% +1.1%
Asia 97.6 69.2 +41.0% -10.4%
Chargeurs 326.1 287.1 +13.6% -1.9%
(1) like-for-like: based on a comparable scope of consolidation and at constant exchange rates
◼ Revenue up 13.6% year on year in H1 2019
⚫ Europe: 3.2% revenue growth, led by:
▪ Strong sales momentum for Chargeurs Technical Substrates, with the acquisition of Leach in May 2018
▪ New strategic industrial partnerships at Chargeurs Luxury Materials
These two effects partly offset lower business volumes for Chargeurs Protective Films in Germany
⚫ Americas: a solid 8.3% revenue rise, underpinned by:
▪ The successful integration of PCC Interlining into Chargeurs Fashion Technologies
▪ A positive currency effect from the US dollar
⚫ Asia: a 41.0% revenue hike as reported, mainly thanks to the strategic integration of PCC Interlining. The 10.4% like-for-like revenue decline
was due to lower business volumes for Chargeurs Protective Films in China
Chargeurs – First-Half 2019 Results – September 12, 2019 ― 29First-half 2019 key figures
Another strong increase in results
Group Protective Films Fashion Technologies Technical Substrates Luxury Materials
Intensified opex drive Change in scale Creation of a global Premiumization
326.1
champion
281.8 287.1
256.6 253.5
143.3 150.0 142.1 107.7
113.6 120.5
79.7
68.9 67.8 68.8
18.0 53.5 52.5 58.2 53.5 58.2
Revenue 12.5
14.8
9.8 11.6
(€m)
H1 H1 H1 H1 H1 H1 H1 H1 H1 H1 H1 H1 H1 H1 H1 H1 H1 H1 H1 H1 H1 H1 H1 H1 H1
2015 2016 2017 2018 2019 2015 2016 2017 2018 2019 2015 2016 2017 2018 2019 2015 2016 2017 2018 2019 2015 2016 2017 2018 2019
32.5
29.1 30.6
25.3 11.4
21.4 21.6
20.7 19.2
EBITDA 13.5
16.5
6.5
7.7
5.8
€m 8.1% 10.0% 10.3% 10.7% 10.0%
11.9% 13.7% 14.9% 14.4% 13.5%
5.0
1.8
2.3 2.3 2.6 2.3 1.5 1.8 1.7
1.5
9.4% 11.2% 10.6% 1.0
(% of 6.3% 8.6%
18.4% 19.8% 18.4% 17.6% 12.8%
2.8% 3.4% 2.9% 1.9% 2.6%
revenue) +14,6%
H1 H1 H1 H1 H1 H1 H1 H1 H1 H1 H1 H1 H1 H1 H1
H1 H1 H1 H1 H1 H1 H1 H1 H1 H1
2015 2016 2017 2018 2019 2015 2016 2017 2018 2019 2015 2016 2017 2018 2019 2015 2016 2017 2018 2019 2015 2016 2017 2018 2019
23.5 24.8 22.7
ROP 20.3 18.2 18.2 8.1
15.6 14.0 14.1
€m 8.0% 8.3% 8.6% 7.0%
11.0 4.5 4.0
6.0
6.1%
(% of 9.7% 11.6% 12.7% 12.1% 9.9% 2.8 1.5 1.8 1.8 1.9 1.5 1.8 1.7 1.5
5.9% 8.7% 7.5% 1.4 1.0
3.5% 6.5%
revenue) 15.3% 15.5% 14.4% 12.8% 7.8% 2.8% 3.4% 2.9% 1.9% 2.6%
H1 H1 H1 H1 H1 H1 H1 H1 H1 H1 H1 H1 H1 H1 H1 H1 H1 H1 H1 H1 H1 H1 H1 H1 H1
2015 2016 2017 2018 2019 2015 2016 2017 2018 2019 2015 2016 2017 2018 2019 2015 2016 2017 2018 2019 2015 2016 2017 2018 2019
Chargeurs – First-Half 2019 Results – September 12, 2019 ― 30June 2019
Chargeurs Protective Films
From New York Penn to Boston, stations
under renovation
Chargeurs - Résultats
Chargeurs semestriels
- Résultats 20192019
semestriels - 12 septembre 2019 2019
- 12 septembre ― 31CPF CHARGEURS PROTECTIVE FILMS
"THE LEADING INNOVATIVE COATING SOLUTIONS"
First-Half 2019 Highlights
◼ Premium production unit successfully brought into service
◼ A difficult Q1 2019 in Germany and China but much better
momentum in Q2 with a stronger order book
◼ Faster deployment of disruptive innovations: “green” products
and glass protection solutions
Chargeurs – First-Half 2019 Results – September 12, 2019 ― 32Chargeurs
Protective
Films Key figures
Return to growth in Q2 2019 after a contraction in Q1. Stronger order book
H1 2019 Q2 2019 Q1 2019
H1 2019 H1 2018 vs vs vs
In euro millions H1 2018 Q2 2018 Q1 2018
Revenue 142.1 150.0 -5.3% -3.2% -7.4%
(1)
like-for-like -7.1% -4.6% -9.5%
EBITDA (2) 19.2 21.7 -11.5%
as a % of revenue 13.5% 14.5%
Recurring operating profit 14.1 18.2 -22.5%
as a % of revenue 9.9% 12.1%
(1) like-for-like: based on a comparable scope of consolidation and at constant exchange rates
(2) The impact of IFRS 16 is presented in the simplified financial report
◼ Q2 2019: a better quarter for sales and orders
⚫ Up by more than 5% on Q1 2019, making it one of CPF’s best Q2 performances
➔ Very good product mix and higher number of orders
◼ H1 2019: Recurring operating profit of €14.1m – one of CPF’s top performances for a first half
⚫ Compared with the record high achieved in H1 2018 when the operating environment was much more favorable, with orders peaking in June
⚫ Reflecting a difficult Q1 2019 in terms of volumes in China and Germany, followed by a much better Q2
⚫ Including the additional costs related to the launch of the new premium production line in Italy
➔ A nonetheless outstanding performance, which also includes the effects of stepping up the Game Changer plan
Chargeurs – First-Half 2019 Results – September 12, 2019 ― 33Accelerating the premiumization of CPF’s offering, with the
launch of its first techno-smart production line
Industrial prowess Premiumization
Launch of the new production line six months Faster production of highly engineered, high value-
ahead of the initial schedule added films
Technological edge sustainably sharpened
Disruptive functions Wider manufacturing and sales coverage
3D modeling and process automation Strategically located in Sessa Arunca (Italy)
Big data management Optimizing CPF’s international footprint
Reducing our environmental footprint
Profitable growth
Faster like-for-like growth
Target of an extra €35 million in revenue by 2021
SUCCESSFUL DEPLOYMENT OF THE GAME CHANGER INDUSTRIAL TRANSFORMATION STRATEGY
• An industrial transformation project with a record-short time frame
• A global ecosystem to accelerate profitable growth
• Confirmation of the target of €35 million in additional revenue by 2021, with higher margins than generated on
the business line’s current revenue
Chargeurs – First-Half 2019 Results – September 12, 2019 ― 342019,
Chargeurs Fashion Technologies
From the Fendi Show
to the New York Marathon
Chargeurs - Résultats semestriels 2019 - 12 septembre 2019 ― 35CFT CHARGEURSPCC FASHION TECHNOLOGIES
“CREATING THE NEW WORLDWIDE LEADER”
First-Half 2019 Highlights
◼ PCC Interlining successfully integrated
◼ Products developed from recycled fibers and faster deployment
of eco-responsible products
◼ Launch of strategic partnerships, such as with the Fashion
Institute of Technology of New York (FIT), the Brooklyn Museum
and the Pierre Cardin foundation.
Chargeurs – First-Half 2019 Results – September 12, 2019 ― 36Chargeurs
PCC Fashion
Technologies Key figures
Sharp growth in operating performance, driven by the successful integration of PCC
H1 2019 Q2 2019 Q1 2019
H1 2019 H1 2018 vs vs vs
In euro millions H1 2018 Q2 2018 Q1 2018
Revenue 107.7 68.8 +56.5% +56.3% +56.8%
(1)
like-for-like 2.3% +2.3% +2.4%
(2) 11.4 7.6 +50.0%
EBITDA
as a % of revenue 10.6% 11.0%
Recurring operating profit 8.1 6.0 +35.0%
as a % of revenue 7.5% 8.7%
(1) like-for-like: based on a comparable scope of consolidation and at constant exchange rates
(2) The impact of IFRS 16 is presented in the simplified financial report
◼ Revenue up 56.5% – excellent momentum in a competitive market, led by:
⚫ The acquisition of PCC in 2018
⚫ A customer-centric strategy
⚫ Upscaling the business’s range of product and service solutions and leveraging new synergies
◼ H1 2019: Recurring operating profit of €8.1m, up 35.0%
⚫ Further growth opex to continue upscaling the business
⚫ Unfavorable basis of comparison due to the devaluation of the Argentine peso in H1 2018
Chargeurs – First-Half 2019 Results – September 12, 2019 ― 372019,
Chargeurs Technical Substrates
From the Louvre
to the Brooklyn Museum
Chargeurs - Résultats
Chargeurs semestriels
- Résultats 20192019
semestriels - 12 septembre 2019 2019
- 12 septembre ― 38CTS CHARGEURS TECHNICAL SUBSTRATES
THE CREATION OF A NEW GLOBAL CHAMPION IN MUSEUM EXPERIENCE
First-Half 2019 Highlights
◼ Creation of Chargeurs Creative Collection,
a global benchmark in services for museums
o Acquisition of majority stakes in 3 global champions with very high value
added: MET, Design PM, Hypsos
o €60m in additional full-year revenue
◼ Q2 2019: faster like-for-like growth, at 5.9%
o Strong momentum thanks to the energization of new teams
◼ Continued development of overseas export services
o Growth driver, which, over time, will help make sales less seasonal
Chargeurs – First-Half 2019 Results – September 12, 2019 ― 39Chargeurs
Technical
Substrates Key figures
Creation of a global champion in museum heritage management and visitor experience services: €60m in additional full-year revenue
H1 2019 Q2 2019 Q1 2019
H1 2019 H1 2018 vs vs vs
In euro millions H1 2018 Q2 2018 Q1 2018
Revenue 18.0 14.8 +21.6% +16.5% +28.6%
(1)
like-for-like -2.0% +5.9% -12.7%
EBITDA (2) 2.3 2.6 -11.5%
as a % of revenue 12.8% 17.6%
Recurring operating profit 1.4 1.9 -26.3%
as a % of revenue 7.8% 12.8%
(1) like-for-like: based on a comparable scope of consolidation and at constant exchange rates
(2) The impact of IFRS 16 is presented in the simplified financial report
◼ 21.6% revenue growth, spurred by the acquisition of Leach in 2018
◼ Launch of new products in Q2 2019: increase in the consumption of raw materials and in machine time -> decrease in margins
◼ Change of management, with the appointment of Sampiero Lanfranchi:
⚫ Internal growth up sharply to 5.9% in Q2 2019
⚫ Higher external growth thanks to the acquisition of 3 global champions: Design PM (UK), MET Studio (UK), and Hypsos (NL)
◼ Formation of Chargeurs Creative Collection, made up of 4 recently-acquired, creating a new global benchmark for museum services
◼ Well on the way to meeting its target:
⚫ €100m in annual revenue by end-2021
⚫ 14% operating margin in the medium term
Chargeurs – First-Half 2019 Results – September 12, 2019 ― 402019,
Chargeurs Luxury Materials
From the Sheep
to the Shop
Chargeurs - Résultats semestriels 2019 - 12 septembre 2019 ― 41CHARGEURS LUXURY MATERIALS
CLM "FROM THE SHEEP TO THE SHOP"
First-Half 2019 Highlights
◼ Organica Precious Fiber eco-traceable wool label listed by
Kering
◼ New strategic partnerships signed with major well-known
brands, focused on developing premium, traceable and
sustainable products
◼ H1 2019: initial positive effects of growth opex projects
carried out in prior periods
Chargeurs – First-Half 2019 Results – September 12, 2019 ― 42Chargeurs
Luxury
Materials Key figures
CLM is starting to reap the benefits of the opex projects carried out to help upscale its products
H1 2019 Q2 2019 Q1 2019
H1 2019 H1 2018 vs vs vs
In euro millions H1 2018 Q2 2018 Q1 2018
Revenue 58.2 53.5 +8.8% +16.2% +3.0%
(1)
like-for-like 7.5% +15.3% +1.3%
(2) 1.5 1.0 +50.0%
EBITDA
as a % of revenue 2.6% 1.9%
Recurring operating profit 1.5 1.0 +50.0%
as a % of revenue 2.6% 1.9%
(1) like-for-like: based on a comparable scope of consolidation and at constant exchange rates
(2) The impact of IFRS 16 is presented in the simplified financial report
◼ Revenue up 7.5% like for like, driven by the premiumization strategy and measures to gradually sophisticate the supply chain
◼ Recurring operating profit up 50%, thanks to growth opex incurred since end-2015
◼ Ongoing development of high quality, more profitable products, which can be sold at a premium to major customers in the
luxury and sportswear markets worldwide
Chargeurs – First-Half 2019 Results – September 12, 2019 ― 43FINANCIAL REVIEW Chargeurs – First-Half 2019 Results – September 12, 2019 ― 44
Consolidated Income Statement
    Recurring operating profit once again high despite a more volatile operating environment and high levels of capex

  In euro millions                                         H1 2019 H1 2018      Change            Comments
  Revenue                                                    326.1   287.1       +39.0        -1.9% like-for-like against a record figure in H1 2018; internal growth of 0.8 % in Q2 2019
                                                                                         +13.6%
  Gross profit                                                85.0    75.8        +9.2 +12.1%
                                                                                              Persistently high gross profit as a result of the premiumization of the offering
  as a % of revenue                                           26.1%     26.4%
  EBITDA                                                      32.5      30.6      +1.9    +6.2%Impact of the productivity plan (€3.5m), the application of IFRS 16 (€3.3m), the integration of PCC and
  as a % of revenue                                           10.0%     10.7%                  Leach, the ramp-up in growth opex and the economic slowdown in Germany and Asia
  Depreciation and amortization                               (9.8)     (5.8)     -4.0    +69% Continued investment strategy: €(0.9)m including 4.0 coating line at CPF, impact of IFRS 16: €(3.1)m
  Recurring operating profit                                  22.7      24.8      -2.1         More volatile climate in Germany and China, ramp-up in growth opex -> 4.0 coating line at CPF;
  as a % of revenue                                            7.0%      8.6%                  compared with a record H1 2018
  Amort. intangible assets linked to PPAs                     (1.2)      0.0      -1.2         Amort. of brands and customer relations in acquisitions: PCC €(1.1)m and Leach €(0.1)m
                                                                                                  o/w: €(1.9)m in costs linked to acquisitions made, €(1.1)m in reorganization costs and €(0.7)m in costs linked
  Non-recurring items                                         (4.2)     (0.1)     -4.1
                                                                                                  to acquisitions underway;
  Operating profit                                            17.3      24.7      -7.4            o/w: €(4.1)m linked to non-recurring items and €(1.2)m to intangible assets linked to PPAs
     Finance costs, net                                     (4.7)     (4.5)     -0.2               Renegotiation of the Euro PPs issued in 2016 and 2017: longer maturity and staggering of debt
     Other financial income and expense                     (1.1)     (0.9)     -0.2               €0.4m negative impact of IFRS 16
  Net financial expense                                       (5.8)     (5.4)     -0.4
  Income tax (expense)/benefit                                (3.2)     (4.1)     +0.9
  Investments in equity accounted investees                    0.0       0.1      -0.1
  Profit for the period                                        8.3      15.3      -7.0            Drop in operating profit, financial expenses maintained

Chargeurs – First-Half 2019 Results – September 12, 2019                                                                                                                                                           ― 45
Revenue and recurring operating profit bridges
Revenue bridge (in €m) Recurring operating profit bridge (in €m)
42.9 1.6 3.0 326.1
287.1 -8.5
-1.9% organic
3.5 0.4 22.7
24.8 0.6
-5.5
8.6% -1.1 7.0%
-24.2% organic
H1 2018 Scope Currency Volume Price/mix H1 2019 H1 2018 Scope Currency Volume Price/mix Other costs H1 2019
◼ Revenue ◼ Recurring operating profit
⚫ Scope: PCC and Leach ⚫ Scope: PCC and Leach
⚫ Currency: USD +3.5; ARS -2.6 and HKD +0.4 ⚫ Currency: USD
⚫ Volume: CLM → drop in volumes linked to the price of wool ⚫ Volume: CPF in Germany and China
CPF → decline in Germany and China ⚫ Price/mix: CPF → decline in high-margin markets
⚫ Prix/mix: CLM +€5.0m → increase in the price of wool
⚫ Other costs: controlled growth opex and productivity plan
CPF → decline in high-margin markets
Chargeurs – First-Half 2019 Results – September 12, 2019 ― 46Success of the Annual Productivity Plan
2019 target: €7.3m in cost savings for the full year
Cost savings generated by the annual
productivity plan Productivity plan
7.3 Savings on
production
costs Savings on
distribution
48% 31%
costs
2.2 2.1 9%
3.5 Savings on
administrative €3.5m in
€m and other fixed EBITDA gains
costs
2017 2018 2019 6% achieved in
H1 2019
◼ €3.5m in savings achieved in the six months
ended June 30, 2019, i.e. 48% of the €7.3m
target set for 2019
Savings on raw
◼ €18.2m in total savings material costs
achieved since end-2015 54%
Chargeurs – First-Half 2019 Results – September 12, 2019 ― 47Balance Sheet Analysis
A constantly robust balance sheet structure
In euro millions 06/30/19 12/31/18 Comments
Intangible assets 157.6 158.1
Right-of-use assets 27.7 0.0 Impact of the application of IFRS 16 including €11.2m in reclassification of finance leases
Property, plant and equipment 83.1 80.7 CPF Premium production plant and impact of IFRS 16
Investments in equity accounted investees 13.0 13.1
Net non-current assets 11.8 12.9
Working capital 84.4 64.6 Seasonal increase in orders in H1 (CPF and CTS); increase in the price of wool (CLM)
Total capital employed 377.6 329.4
Equity 234.6 237.2 Profit: €8.3m; Dividends: €(5.1)m; Share buybacks: €(4.5)m
Leases (27.8) 0.0 Impact of the first-time adoption of IFRS 16
Net debt/(net cash) (115.2) (92.2) Net cash from op. activities: €0.5m; capex: €(16.3)m; div.: €(5.1)m
Number of shares at June 30, 2019: 23,756,103
◼ Renegotiation of the financial conditions of the Euro PP notes issued in 2016 and 2017 to align them with those of the syndicated credit
facility set up in December 2018
⚫ Leverage covenant removed (net debt/EBITDA)
⚫ Gearing requirement changed to 1.2x from the previously applicable 0.85x
⚫ Maturity extended by three years for Euro PP notes originally maturing in 2023
Chargeurs – First-Half 2019 Results – September 12, 2019 ― 48Statement of cash flows In euro millions H1 2019 H1 2018 Comments EBITDA 32.5 30.6 Up 6.2%: impact of IFRS 16 (€3.3m), growth opex and annual productivity plan Non-recurring – cash (4.2) (2.0) Acquisition-related expenses Finance costs – cash (5.3) (4.5) Strengthening of financial resources and extended maturity of borrowings Income tax – cash (0.4) (2.4) Other 0.2 0.0 Cash generated by operations 22.8 21.7 Up 5.1%: robust cash generated by operations Change in working capital (at constant exchange rates) (22.3) (16.4) Rise in WCR linked to orders at CPF and CTS; increase in the price of wool at CLM Net cash from operating activities 0.5 5.3 Cash: increase in WCR absorbed by cash generated by operations Purchases of PPE and intangible assets (16.3) (9.1) Principally linked to the 4.0 production line at Chargeurs Protective Films Acquisitions 0.0 (14.2) May 2018: acquisition of Leach Dividends (5.1) (4.4) Balance of the dividend paid for the previous year Currency (0.5) (0.1) Other (1.6) (0.1) o/w €(4.5)m linked to the repurchase of shares; €3.9m linked to the first-time adoption of IFRS 16 in H1 2019 Total (23.0) (22.6) Negative impact over the period principally as a result of a sustained investment policy Debt (-)/cash (+) at opening (12/31/y-1) (92.2) 8.9 Debt (-)/cash (+) at closing (06/30/y) (115.2) (13.7) Chargeurs – First-Half 2019 Results – September 12, 2019 ― 49
3                          OUTLOOK AND OPPORTUNITIES

Chargeurs – First-Half 2019 Results – September 12, 2019                               ― 50
Building a long-term model of quality and excellence

 Reasonable but essential levels of capex for transforming a high-potential industrial group
 into the world champion in high value-added niche markets that it has become today

                                                                                           A solid model built on 3 pillars
                                                           ⚫   Game Changer plan
                                                           ⚫   No more low-margin sales
        Premiumizing our                                   ⚫   Customer-centric strategy and disruptive innovation
        businesses                                         ⚫   Focus on “green” products

                                                           ⚫   New production capacities
    Reinforcing our niche                                  ⚫   Winning new markets
    strategy                                               ⚫   A stronger distribution network

                                                           ⚫   Solid financial resources
      Ensuring financial                                   ⚫   Longer average maturity of borrowings
      flexibility                                          ⚫   Leverage covenant removed for Euro PP notes

Chargeurs – First-Half 2019 Results – September 12, 2019                                                                      ― 51
Pursuing our acquisition strategy
Distinctive Create global champions in high value-added niche markets
vision
Focus on accretive businesses
Vertical acquisitions to move up the
Game-changing bolt-on acquisitions Acquisitions in new businesses with high
Disruption & value chain and offer end-to-end
closely in line with our strategy growth potential
Growth solutions
Market analysis Target analysis Evaluation Integration
✓ Structural growth ✓ Strong competitive positioning ✓ Priority given to return on capital ✓ In-depth pre-acquisition work
✓ Opportunities in fragmented ✓ Strong, well-known employed ✓ Intense focus on integrating
Strict markets brands ✓ Sustainable revenues teams and leveraging synergies
methodology ✓ Strong technical features ✓ Repeat business ✓ Accretive value ✓ Rigorous monitoring of
✓ Opportunities for synergies and a solid customer base implemented measures
✓ High growth in EBITDA and cash
✓ Accretive margins flow
✓ Smooth cultural fit
Chargeurs – First-Half 2019 Results – September 12, 2019 ― 52Ambitious and achievable medium- and long-term objectives
Target for end-2021 confirmed: €1bn in profitable revenue
(subject to macro-economic conditions remaining constant) Steadily rising margins thanks to the
product mix and economies of scale
Full-year revenue Growth track for target of €1bn in revenue
(€ million) and an operating margin of >10% Premiumization and higher
margins
>1,000 1,000
750 internal
- growth,
620 internal growth,
533 targeted
800 new 620
targeted
ROP ROP acquisitions ROP Higher barriers to entry
acquisitions
8.3% 8.5% underway > 10.0%
2017 2018 2020 * end-2021
* Target of full-year revenue of €750m to €800m in 2020 including future acquisitions 2018 2021
◼ Pursuing our acquisition strategy
⚫ 9 major acquisitions already carried out: Main Tape, CPSM (Asidium,
➔ ROP 2019 > ROP 2017
Omma, Walco), Leach, PCC and Chargeurs Creative Collection’s 3
international champions ➔ Well on track to meet targets:
⚫ A solid pipeline of acquisitions with high earnings potential • €1bn in revenue by 2021
◼ Strengthening our businesses in a volatile operating context • > 10% normative operating margin as from 2022
⚫ Majority of required capex already incurred
⚫ Optimizing structures and conquering new markets
⚫ Focus on cash generation and optimizing WCR
Chargeurs – First-Half 2019 Results – September 12, 2019 ― 53Maximizing shareholder value creation
Shareholder value creation strategy Ownership structure at July 31, 2019: 23 756 103 shares
Ownership structure at May 31, 2019:
Share performance since the change in Chargeurs' governance structure
( CAC 40 and SBF 120 adjusted in line with Chargeurs' share price)
23,756,103 shares
Treasury
+ 104 % stock Colombus
3.8% Holding SAS
27.6%
€30 Sycomore
€25
10.5%
€20 Other
shareholders
€15
58.1%
€10
€5
12/31/15 12/31/16 12/31/17 12/31/18 31/08/19
Chargeurs CAC 40 adjusted SBF 120 adjusted
A share performance that is now covered by 6 analysts Dividend per share
Dividend per share since 2015
+123% since 2015
€0.60 €0.67
€0.55
€0.30 € 0.35 € 0.37
€ 0.35
€0.20 €0.25 €0.30
€0.20
2015 2016 2017 2018 2019
Interim dividend
Chargeurs – First-Half 2019 Results – September 12, 2019 ― 54APPENDICES Chargeurs – First-Half 2019 Results – September 12, 2019 ― 55
Glossary
 Glossary

 ◼ Change based on a comparable scope of consolidation and at constant exchange rates (like-for-like), organic change or internal change for year Y compared with
   year Y-1 is calculated:
   ⚫ applying the average exchange rates for year Y-1 to the period concerned (year, half-year, quarter); and
   ⚫ using the scope of consolidation for year Y-1.

 ◼ EBITDA corresponds to the businesses operating profit (as defined below) restated for the amortization of property, plant and equipment and intangible assets.

 ◼ Recurring operating profit corresponds to gross profit after distribution costs, administrative expenses and research and development costs. It is calculated:
   ⚫ before amortization of intangible assets resulting from acquisitions, and
   ⚫ before other operating income and expense, which correspond to non-recurring items that represent material amounts, are unusual in nature and occur
     infrequently, and therefore distort assessments of the Group's underlying performance.

 ◼ Recurring operating margin is recurring operating profit as a % of revenue.

Chargeurs – First-Half 2019 Results – September 12, 2019
                                                                                                                                                                    ― 56
Disclaimer
This presentation may contain forward-looking statements relating to the business, results and financial
position of the Chargeurs Group.
Such forward-looking statements are based on assumptions that are currently considered reasonable but
which are dependent on external factors such as changes and developments in:
⚫ Commodity prices.
⚫ Exchange rates.
⚫ General economic conditions.
⚫ Demand in the Group’s main markets.
⚫ New product launches by competitors.
In view of these uncertainties, the Chargeurs Group may not be held liable for any differences between its
forward-looking statements and actual results which arise due to new facts or circumstances or
unforeseeable developments.
The factors that could significantly influence the Group’s financial performance are set out in the Registration
Document, which is filed with the AMF on an annual basis.
Chargeurs – First-Half 2019 Results – September 12, 2019 ― 572019 INVESTOR CALENDAR Thursday, November 14, 2019 Third-quarter 2019 financial information (after the close of trading) Chargeurs 112, avenue Kléber 75 116 Paris +33 1 47 04 13 40 comfin@chargeurs.com www.chargeurs.com
You can also read