Retail Bond Presentation - Summerset
←
→
Page content transcription
If your browser does not render page correctly, please read the page content below
Retail Bond
                      Presentation
                      Summerset Group Holdings Limited
                             10 September 2018

Joint Lead Managers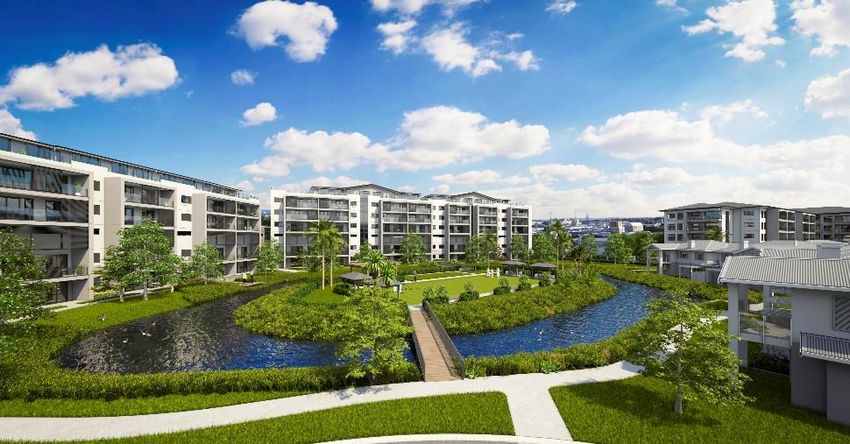
Disclaimer
Please read carefully before the rest of the presentation
This presentation has been prepared by Summerset Group Holdings Limited (SGHL or the Issuer) in               The information in this document is given in good faith and has been obtained from sources believed to
relation to the offer of bonds described in this presentation (Bonds). The offer of the Bonds is made in      be reliable and accurate at the date of preparation, but its accuracy, correctness and completeness
reliance upon the exclusion in Clause 19 of schedule 1 of the Financial Market Conduct Act 2013               cannot be guaranteed.
(FMCA). The offer of SGHL’s unsubordinated, guaranteed, secured, fixed rate bonds have identical
rights, privileges, limitations and conditions (except for the interest rate and maturity date) as SGHL’s     None of the Arranger, the Joint Lead Managers or Bond Supervisor nor any of their respective directors,
bonds maturing on 11 July 2023, which have a fixed rate of 4.78 percent per annum and are currently           officers, employees and agents: (a) accept any responsibility or liability whatsoever for any loss arising
quoted on the NZX Debt Market under the ticker code SUM010 (the Existing Bonds).                              from this presentation or its contents or otherwise arising in connection with the offer of Bonds; (b)
                                                                                                              authorised or caused the issue of, or made any statement in, any part of this presentation; and (c) make
SGHL is subject to a disclosure obligation that requires it to notify certain material information to NZX     any representation, recommendation or warranty, express or implied regarding the origin, validity,
Limited (“NZX”) for the purpose of that information being made available to participants in the market.       accuracy, adequacy, reasonableness or completeness of, or any errors or omissions in, any
That information can be found by visiting www.nzx.com/companies/SUM. The Existing Bonds are the               information, statement or opinion contained in this presentation and accept no liability (except to the
only debt securities of SGHL that are currently quoted and in the same class as the Bonds. Investors          extent such liability is found by a court to arise under the Financial Markets Conduct Act 2013 or cannot
should look to the market price of the Existing Bonds to find out how the market assesses the returns         be disclaimed as a matter of law).
and risk premium for those bonds.
                                                                                                              The offer of Bonds is being made only in New Zealand. The distribution of this presentation, and the
The information in this presentation is of general nature and does not constitute financial product advice,   offer or sale of the Bonds, may be restricted by law in certain jurisdictions. Persons who receive this
investment advice or any recommendation by the Issuer, the Bond Supervisor, the Arranger, the                 presentation outside New Zealand must inform themselves about and observe all such restrictions.
Organising Participant, the Joint Lead Managers, or any of their respective directors, officers,              Nothing in this presentation is to be construed as authorising its distribution, or the offer or sale of the
employees, affiliates, agents or advisers to subscribe for, or purchase, any of the Bonds. Nothing in this    Bonds, in any jurisdiction other than New Zealand and the Issuer accepts no liability in that regard. The
presentation constitutes legal, financial, tax or other advice.                                               Bonds may not be offered or sold directly or indirectly, and neither this presentation nor any other
                                                                                                              offering material may be distributed or published, in any jurisdiction other than New Zealand.
The information in this presentation does not take into account the particular investment objectives,
financial situation, taxation position or needs of any person. You should make your own assessment of         Application has been made to NZX for permission to quote the Bonds on the NZX Debt Market and all
an investment in the Issuer and should not rely on this presentation. In all cases, you should conduct        the requirements of NZX relating thereto that can be complied with on or before the distribution of the
your own research on the Issuer and analysis of any offer, the financial condition, assets and liabilities,   Terms Sheet have been duly complied with. However, NZX accepts no responsibility for any statement
financial position and performance, profits and losses, prospects and business affairs of the Issuer, and     in this document. NZX is a licensed market operator, and the NZX Debt Market is a licensed market
the contents of this presentation.                                                                            under the FMCA.

This presentation contains certain forward-looking statements with respect to the Issuer. All of these        Certain financial information contained in this presentation is prepared on a non-GAAP basis.
forward-looking statements are based on estimates, projections and assumptions made by the Issuer             “Underlying profit” differs from IFRS net profit after tax. The audited underlying profit measure is
about circumstances and events that have not yet occurred. Although the Issuer believes these                 intended to assist readers in determining the realised and non-realised components of fair value
estimates, projections and assumptions to be reasonable, they are inherently uncertain. Therefore,            movement of investment property and tax expense in the Summerset Group’s income statement. The
reliance should not be placed upon these estimates or forward-looking statements and they should not          measure is used internally in conjunction with other measures to monitor performance and make
be regarded as a representation or warranty by the Issuer, the directors of the Issuer or any other           investment decisions. Underlying profit is a measure which the Summerset Group uses consistently
person that those forward-looking statements will be achieved or that the assumptions underlying the          across reporting periods.
forward-looking statements will in fact be correct. It is likely that actual results will vary from those
contemplated by these forward-looking statements and such variations may be material.                         Refer to slide 22 for a reconciliation of non-GAAP underlying profit to GAAP net profit after tax.

                                                                                                                                                                                  Retail bond presentation                   2
Contents
1   Business overview

2   Funding and security structure

3   Financial performance

4   Offer terms and timetable

5   Appendices

                                     Retail bond presentation   3
Offer highlights
Bond offer further diversifies funding sources and provides tenor
Total bank debt facilities of $500m and total retail bonds of $100m before the offer
Net debt of $365m as at 30 June 2018
This bond will be used to repay a portion of existing drawn bank debt and for general corporate purposes, and provide diversification of
funding sources and tenor
Retail bond offer Details
Issuer Summerset Group Holdings Limited (listed on the NZX and ASX)
Bonds Unsubordinated, guaranteed, secured, fixed rate bonds of the Issuer
Provided by Summerset and each of the other Guarantors
Guarantee and security
Equal ranking with Summerset’s banks and existing bondholders
Issue size Up to $75m with up to $25m oversubscriptions
Maturity 7 year bonds maturing Wednesday 24 September 2025
Rating Not rated
Quotation Application to quote the bonds on NZX Debt Market (NZDX) has been made
Joint Lead Managers ANZ, FNZC, Forsyth Barr and Hobson Wealth Partners
Retail bond presentation 4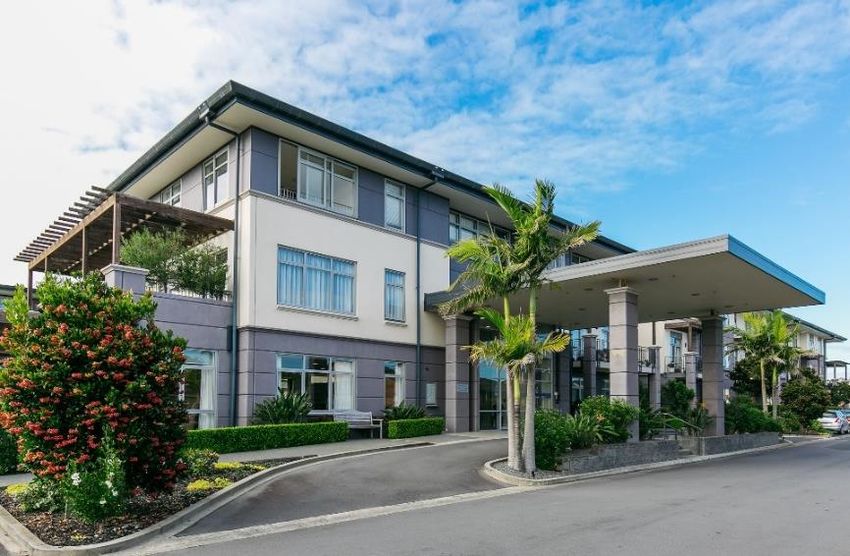
Business
overview
Summerset snapshot
Third largest retirement village operator

 * Includes acquisition of new land in New Plymouth post 30 June 2018 half year balance date   Information as at 30 June 2018 unless otherwise stated

                                                                                                            Retail bond presentation              6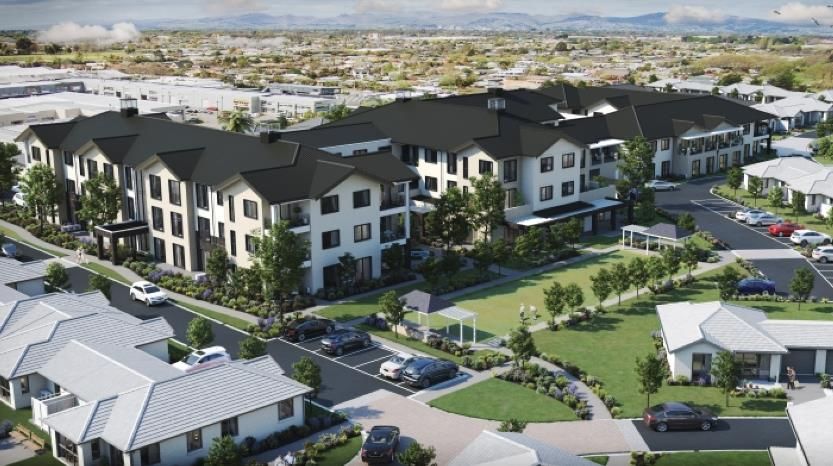
Summerset background
Second largest retirement village developer in New Zealand
Listed on the NZX in 2011, and the ASX in 2013 Summerset Provides a Comprehensive Continuum of Care
Nationwide provider
Villa
23 operating villages completed or under development Independent
Living Units
Eight greenfield sites at Avonhead, Kenepuru, Lower Hutt, Parnell, Independent
Richmond, St Johns, Te Awa, and our recently announced acquisition in Apartment
New Plymouth
Assisted Serviced
Focus on continuum of care model Living Apartment
High quality care and facilities across all villages
Rest Home
Care
Villages designed to integrate into local communities
Internal development and construction model Specialised Memory
Care Care
Customer centric philosophy – bringing the best of life
Continuing our investigation into possible Australian expansion. We Hospital
Care
have established an office in Melbourne with a dedicated team focused
on working through the appropriate diligence required before we make a
Services
decision on whether we enter this market
Accommodation
Retail bond presentation 7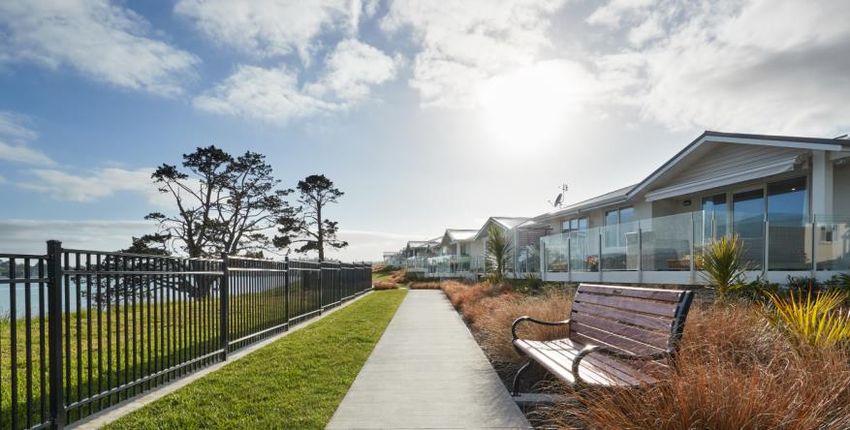
Operational overview
              Operations                                                   Cash flows
              Provision of care in serviced apartments,                    ■ Rest home, hospital and memory care fees
              memory care apartments, rest home, hospital and
1.                                                                         ■ Stable cash flows
              memory care facilities
Aged care                                                                  ■ Includes government funding for specified contracted
              ■ Provide a high standard of quality aged                      services
services        care services

              Daily operation of integrated retirement and aged            ■ Deferred Management Fees (DMF) – primary source of
              care communities                                               income for established villages
2.            ■ Manage a portfolio of tenanted assets                      ■ Gains on resale of Occupation Rights
Asset         ■ Manage ongoing sales of Occupation Rights                  ■ Weekly resident levies and village service
management                                                                   fees – stable cash flows, contribute to operational costs
              ■ Refurbish periodically to maintain
                economic value

              Design and construction of integrated retirement             ■ Occupation Right sales
              and aged care communities
                                                                           ■ Development margin
3.            ■ Cost efficient quality construction of villages designed
Retirement      for older New Zealanders
village       ■ Build villages that integrate into the local
development     environment, providing residents with warm,
                welcome and vibrant communities

                                                                                                            Retail bond presentation     8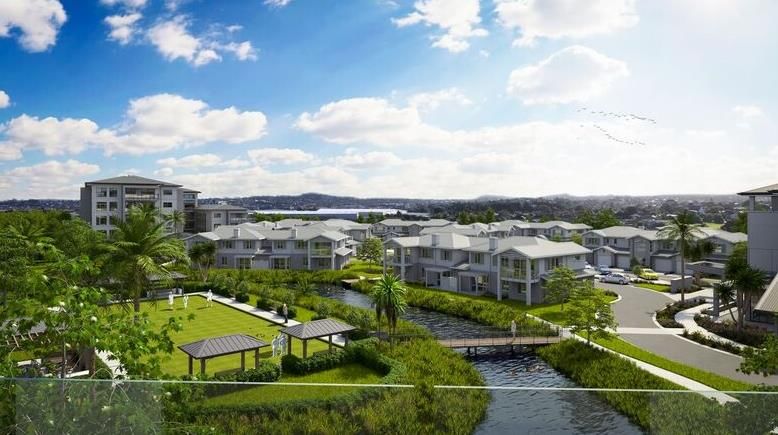
Summerset growth
21 years of consistent delivery and growth

                                                                                        Summerset build rate
                    4,000

                                                                                                                                                                                            3,443
                    3,500
                                                                                                                                                                                    3,278
                                                                                                                                                                                             165

                                                                                                                                                                                     450
                    3,000                                                                                                                                                   2,828

                                                                                                                                                                    2,419    409
                    2,500
 Retirement units

                                                                                                                                                            2,116    303

                    2,000                                                                                                                           1,855    261
                                                                                                                                            1,646
                                                                                                                                                     209
                                                                                                                                    1,486                                                   3,278
                                                                                                                            1,352            160
                    1,500                                                                                           1,272            122                                            2,828
                                                                                                            1,109            80
                                                                                                                     163                                                    2,419
                                                                                                      983
                                                                                               921           126                                                    2,116
                    1,000                                                             795             62
                                                                              732                                                                           1,855
                                                                       652                     126                                                  1,646
                                                                                       63                                                   1,486
                                                                528            80                                                   1,364
                                                         470           124                                                  1,272
                                                  407                                                               1,109
                     500                                 63
                                                                58                                    921    983
                                           219                                        732      795
                                    129           188                         652
                                                                470    528
                                            90           407
                                    129    129    219
                       0     -
                            1997   1998   1999   2000   2001   2002   2003   2004    2005     2006   2007   2008    2009    2010    2011    2012    2013    2014    2015    2016    2017     1H
                                                                                                                                                                                            2018

                                                                             Existing units      New retirement units delivered

                                                                                                                                                               Retail bond presentation             9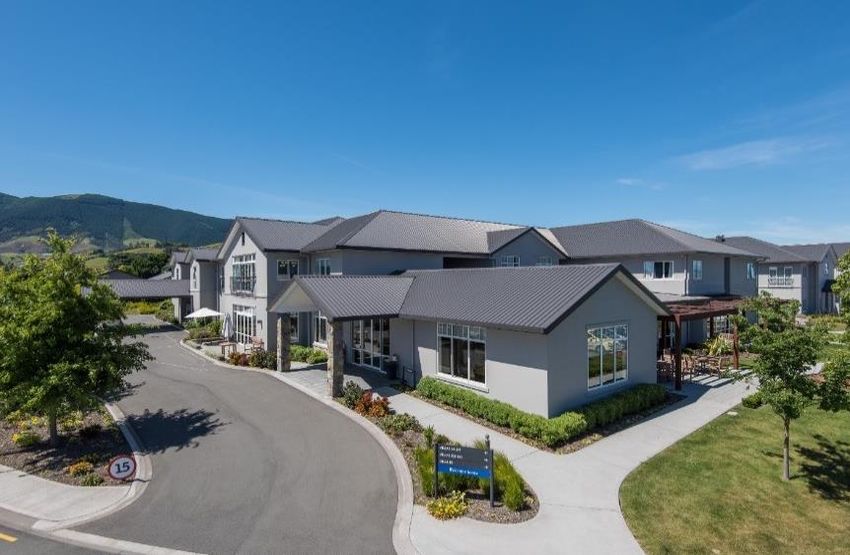
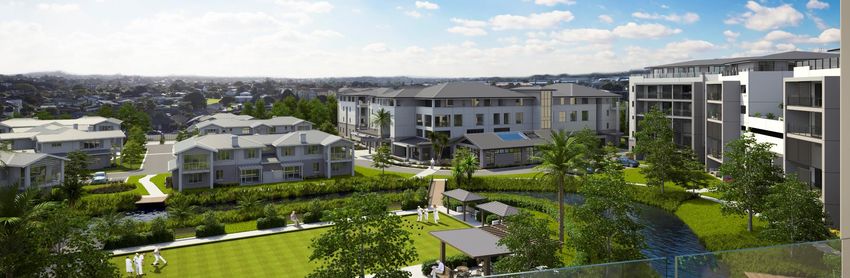
Our product

                 Ellerslie              Casebrook

              Hobsonville                   Katikati

                             Retail bond presentation   10
Funding and security structure
Purpose of debt
Debt is used to develop Summerset villages across New Zealand
Summerset uses debt to fund the acquisition of land for future development, and the development of land into villages
The proposed bond issue will provide further diversification of funding sources and tenor. Summerset has a $500m bank facility limit available
and a $100m existing retail bond
All debt is associated with development activities
Debt will fluctuate depending upon the level of acquisition and development activities
Debt is typically 100% recycled out of completed village developments, into new developments, as Occupation Right Agreement (ORA) sales
occur. Development debt is progressively repaid as ORA sales occur and typically fully repaid by the time all ORAs in the village have been
sold for the first time
If Summerset stops development activities, based on current cash flows and debt levels, debt could be repaid over a short period of time
Retail bond presentation 12Village development cash flows
Village developments are cash flow positive
Debt is principally used as working capital to build new Summerset cash flow example
villages (retirement village and care centre)
As debt is repaid for a village build, it is redrawn for new Land acquisition, design, consenting, Deliver village main building and remaining
village builds civil and infrastructure works, deliver retirement units within village, sell down
first retirement units within village ORAs on retirement units
Each village project is expected to be cash flow positive
Surplus cash
From the time construction of a village starts through to the
last retirement unit being delivered takes, on average, around
four to six years
Summerset has a robust process in place for tendering
projects and selecting skilled and qualified contractors, to
mitigate construction and development risk
Breakeven
Year 0 Year 1 Year 2 Year 3 Year 4 Year 5 Year 6 Year 7 Year 8 Year 9
Internal property development team allows Summerset to
exercise control over the development and construction
Drawn debt
phase
Retirement units delivered New sale settlements Cumulative net cash flows
Retail bond presentation 13Composition of drawn debt
All debt is associated with development activities – development assets
exceed the value of net debt
Net debt to underlying assets - 1H18
Development projects are debt funded. Development assets
Net debt Undeveloped land Development WIP Unsold stock
exceeded the value of net debt by $113m as at 30 June 2018
$600m $113m excess assets
Development assets at the point of the first retail bond issue $500m $477m
exceeded net debt by $42m (based on 31 December 2016 balance $400m $365m $135m
sheet) $300m
$209m
$200m
All debt is associated with development activities $100m
$133m
$-
Development assets could be realised to reduce debt over a short Net debt 1H18 Underlying assets 1H18
period of time
Net debt reconciliation (NZ$m) 1H18*
Net debt 364.5
Debt holders have benefit of core earning generation from the Cash and cash equivalents 14.7
business in addition to development asset backing Capitalised & amortised bond issue costs and fair
0.4
value movement on hedged borrowings
Interest-bearing loans and borrowings (per
379.7
financial statements)
Reverse out capitalised & amortised bond issue
costs and fair value movement on hedged (0.4)
borrowings
* Amounts rounded to nearest $100k
Other unsubordinated liabilities** 12.3
** Includes interest rate swaps and accrued interest Total bank and bond debt 391.6
Retail bond presentation 14The issuer & guaranteeing group
Listed entity Summerset Group Holdings Limited is the issuer
Summerset Group Holdings Limited (SGHL) currently owns Summerset Group Syndicated Lending Structure Simplified – as at 10 September 2018
all companies within the Summerset Group Bond Supervisor Summerset Group
Banks Total Assets Total asset values as at
30 June 2018
Summerset Holdings Limited (SHL), which is a 100% owned $2,420m
100%
subsidiary of SGHL, is the borrower under bank facilities Staff Share
Security Trustee Summerset Scheme
Group Holdings
100%
SGHL is listed on the NZX and ASX, and is the company Listed Bond Issuer
Total Assets: in each
Other
Summerset
issuing these bonds $2m Entities
100%
The equity and debt issued by SGHL will be overseen by the Summerset
same Board of Directors Holdings
Bank Debt Borrower
Total Assets:
Total assets of the Guarantors must be at least 90% of $10m
Summerset Group’s assets and EBITDA of the Guarantors 100%
in each
100%
in each
100%
in each
must be at least 90% of the EBITDA of the Summerset Statutory
Other Summerset 8 Non-Village 23 Village
Group Entities Registered Registered
Supervisor
Companies Companies First ranking
(land bank sites to be mortgage and
developed) rights to other
Total Assets: Total Assets: Total Assets: security proceeds
$31m $143m $2,234m
Listed Bond Issuer
and Debtor Assets secured by Assets secured by Second
Bank Debt First Registered Registered Mortgages behind
Mortgages: $119m Statutory Supervisor, second
Borrower and
Debtor equal with banks: $2,192m,
Other Assets: $24m and $1,155m after deducting
Retirement Village loans to residents secured by
Debtor the Statutory Supervisor
Debtor Guaranteeing Group Other Assets: $42m
Retail bond presentation 15Security
Assets of $1.4b available as security as at 30 June 2018 excluding residents’
loans
Total assets as at 30 June 2018 of $2.4b Summerset Group - 1H18 balance sheet
$3.0b
Assets of $1.4b after payments made to the residents of a
Registered Retirement Village supporting net debt of $365m as
at 30 June 2018 $2.5b $2.4b $0.0b
$1.0b
Investment property value of $2.2b across Auckland (38%), the Manager’s interest in retirement
villages, care centres, and other
Central North Island (31%), the Wellington Region (15%), and $2.0b
assets
the South Island (16%)***
ANZ is Security Trustee for both the bonds and the bank debt $1.5b $1.4b $0.4b
The New Zealand Guardian Trust Company Limited is the Bond
$0.1b
Supervisor $1.0b
$0.8b
$0.5b
$-
Total assets Liabilities Residents' Assets Banks and Other Total equity
preferred by Loans remaining Bondholders liabilities**
law*
* Liabilities preferred by law include employee entitlements and Inland Revenue
** Other liabilities include trade and other payables, revenue received in advance, deferred tax liabilities
*** Percentages based on investment property value excluding the value of non-land capital work in progress
Retail bond presentation 16Security
Bondholders on an equal ranking security basis with bank lenders
The bonds share the security provided by the Guaranteeing Group on an equal ranking basis with Summerset’s bank lenders as per the
Security Trust Deed
The bonds and bank lenders have a first ranking mortgage over undeveloped land and land under development owned by Non-Village
Registered Companies. The bonds and bank lenders are second ranking security holders on land and permanent buildings held by Village
Registered Companies, and have second ranking rights to security proceeds from other assets of Village Registered Companies to which
the Security Trustee is entitled
In the event of financial difficulties, Summerset can:
Reduce debt by slowing development
Rely on core earnings. The business currently carries no core debt
Sell undeveloped land
Sell villages as a going concern - debt holders have first ranking security over the shares of all Village Registered Companies (sale
must be to a party with requisite management skills pursuant to Statutory Supervisor approval requirements)
The Statutory Supervisor has first ranking security over each Village Registered Company’s land and permanent buildings. This is for the
protection of residents’ rights and does not give the Statutory Supervisor discretion to demand repayment of residents’ loans
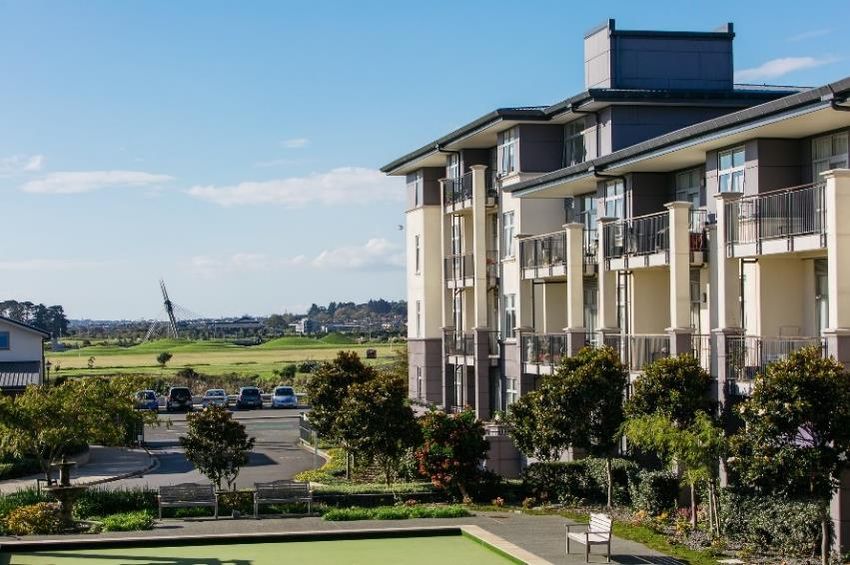
Retail bond presentation 17The ORA and resident protections
Resident rights protected by a statutory supervisor
Resident purchases an Occupation Right Agreement (ORA) by providing a
non-demand repayable, interest free loan
Residents’ loans have no set term, are repayable on resale of an ORA
(using proceeds received from the new resident), and are non-interest
bearing
The rights of the retirement village resident under an ORA are protected by
the Statutory Supervisor
This ensures that if a Registered Retirement Village had financial problems
the residents’ right to continue to occupy their retirement unit is protected, Ellerslie
and the residents’ right to receive their repayment sum on receipt of funds
from a new resident is protected
The protection of residents’ rights does not give the Statutory Supervisor
discretion to demand repayment of residents’ loans
Hobsonville
Retail bond presentation 18Loan to value ratio covenant
Significant headroom on loan to value ratio (LVR) covenant
Key terms of bond LVR covenant:
Loan to value ratio
LVR must not exceed 50% 50%
Covenant level
Reported breach of LVR on a Test Date is an Event of Review
If the Event of Review occurs, Summerset will have 90 days
to put a remediation plan in place then a further 180 days to
remedy the breach. If not remedied this will result in an Event
40%
of Default
During any Event of Review or Event of Default, Guarantors
are not permitted to make any distributions to non-Guarantors 34.0%
There are cross acceleration provisions with any debt 31.4% 31.6%
acceleration >$10m triggering a bond Event of Default 30%
Bond LVR covenant is calculated in the same way and has the same
limit as the bank LVR covenant. Banks have a more detailed
covenant package including a minimum Interest Cover Ratio
Bondholders benefit from cross acceleration provisions
20%
FY16 FY17 1H18
All covenants are well within bank and bond requirements
Retail bond presentation 19Financial performance
Financial performance overview
Strong financial performance over last five years
Net operating cash flow Underlying profit* New sales of occupation rights
1H 2H 1H 2H 1H 2H
$250m $100m 500
$200m $80m 400
$150m $121m $60m $46m 300 231
203
$108m
173
$100m $77m $40m $32m 200 181
$74m $21m
$50m $20m $45m 100
$84m $86m $93m $15m $36m 160 183 179
$64m $25m 145
$37m $17m 105
$9m
$0m $0m 0
2014 2015 2016 2017 2018 2014 2015 2016 2017 2018 2014 2015 2016 2017 2018
Total assets IFRS profit Resales of occupation rights
1H 2H 1H 2H 1H 2H
$3,000m $250m 400
$2,500m $200m
300
$2,000m $133m
$150m
156
$2,420m
$1,500m 200
$2,216m
135 121
$100m
$1,707m
$95m
$1,364m
$1,000m 82
$1,043m
$49m 100
$500m $50m $90m $82m 144 154
$39m 110 123
$51m 90
$36m
$0m $0m $15m 0
2014 2015 2016 2017 2018 2014 2015 2016 2017 2018 2014 2015 2016 2017 2018
* Underlying profit differs from NZ IFRS reported profit after tax. Refer to disclaimer on slide 2
Retail bond presentation 21Income statement
Profit growth driven via increasing portfolio
IFRS NPAT of $82m in 1H18 IFRS profit (NZ$m) 1H18* FY17* FY16*
Total revenue 65.7 110.5 86.1
Underlying profit of $45m in 1H18
Fair value movement of investment property 78.3 218.0 143.5
Underlying profit up 27% and IFRS NPAT down 9% half- Reversal of impairment on land - 0.0 -
on-half Total income 144.0 328.5 229.5
Total expenses 52.9 88.6 71.1
IFRS NPAT down due to one off investment property
valuation assumption change. Excluding this change IFRS Depreciation & amortisation 2.9 4.6 3.7
NPAT was flat half-on-half Finance costs 5.4 11.5 9.1
Net profit before tax 82.8 223.7 145.6
IFRS NPAT is up 68% on a cumulative average growth
Less income tax expense (0.8) (0.3) (0.2)
rate over the last seven years**
Net profit after tax 82.0 223.4 145.5
Underlying profit is up 41% on a cumulative average Reconciliation of underlying profit (NZ$m) 1H18* FY17* FY16*
growth rate over the last seven years**
Net profit after tax 82.0 223.4 145.5
Underlying profit differs from IFRS net profit after tax*** Less fair value movement of investment
(78.3) (218.0) (143.5)
property
Less reversal of impairment on land - (0.0) -
Add realised gain on resales 14.9 24.9 15.4
* Amounts rounded to nearest $100k
** Compound annual growth rate. Annualised 1H18 result compared to FY11
Add realised development margin 25.8 51.0 39.0
*** The Directors have provided an underlying profit measure to assist readers in determining Add income tax expense 0.8 0.3 0.2
the realised and non-realised components of fair value movement of investment property and
tax expense. EY review half year results and audits full year results. Refer to slide 2 for further Underlying profit 45.2 81.7 56.6
information on underlying profit
Retail bond presentation 22Cash flows
Strong operating cash flows
Significant net operating cash flows of $93m for 1H18 and $208m Cash flows (NZ$m) 1H18* FY17* FY16*
for FY17 Net operating business cash
17.1 26.1 15.7
flow****
Net operating cash flows are up 23% on a cumulative average Receipts for residents' loans -
75.7 181.6 176.9
growth rate over the last seven years** new sales
Net operating cash flow 92.8 207.7 192.6
Investing cash flows of $102m at 1H18 relative to debt of
$379m*** Purchase of land (2.0) (27.8) (18.5)
Construction of new IP & care
If investment was halted then debt levels could be paid down facilities
(89.1) (213.1) (168.1)
within a short period of time Refurb of existing IP & care
(2.6) (4.7) (3.3)
facilities
Dividend policy is to pay 30% to 50% of underlying profit. This has
Other investing cash flows (4.1) (6.1) (5.0)
typically been paid at the lower end of the range
Capitalised interest paid (4.0) (5.8) (5.0)
Net investing cash flow (101.8) (257.5) (199.9)
Net proceeds from borrowings 31.4 73.9 25.8
Net dividends paid (9.9) (12.3) (8.9)
* Amounts rounded to nearest $100k
Other financing cash flows (5.4) (12.9) (7.6)
** Compound annual growth rate. Annualised 1H18 result compared to FY11
*** Face value of drawn bank debt and retail bonds. Excludes capitalised and amortised bond
Net financing cash flow 16.2 48.7 9.2
issue costs, and fair value movement on hedged borrowings
**** Net operating business cash flow is equal to net operating cash flow less receipts for
residents’ loans - new sales
Retail bond presentation 23Balance sheet
Total assets of $2.4b with $1.4b assets available as security excluding
residents’ loans
Total assets of $2.4b, principally from 23 villages Summerset has Balance sheet (NZ$m) 1H18* FY17* FY16*
built or is building
Investment property 2,241 2,058 1,591
Net assets of $841m and retained earnings of $559m as at 30 June Other assets 178.8 158.2 115.4
2018
Total assets 2,420 2,216 1,707
Total net debt of $365m as at 30 June 2018
Residents' loans 1,037 966.6 801.3
Total current bank debt facilities of $500m Face value of bank loans &
379.3 347.8 274.0
bonds**
$185m of bank facilities mature in August 2020 and $315m in March Other liabilities 162.5 132.6 85.9
2022
Total liabilities 1,579 1,447 1,161
Total retail bonds (SUM010) of $100m with maturity in July 2023 Net assets*** 840.5 769.3 545.6
Residents’ loans reflect net payments by residents to occupy the
residences they live in while living in a Summerset village. Once Embedded value**** 535.4 497.1 322.6
residents terminate their occupancy the receipts from a new resident NTA (cents per share) 377.9 347.6 249.9
are used to repay the outgoing resident
* Amounts rounded to nearest $100k
Investment property is revalued on a semi-annual basis, and care ** Face value of drawn bank debt and retail bonds. Excludes capitalised and amortised bond
assets every three years issue costs, and fair value movement on hedged borrowings
*** Net assets includes share capital, reserves, and retained earnings
**** Embedded value is the quantum of contractually accrued deferred management fees and
other unrealised gains that would be received in cash if all Summerset’s ORAs were
terminated, resold and settled
Retail bond presentation 24Offer terms and timetable
Key terms of the offer
Summary                               Detail
Issuer                                Summerset Group Holdings Limited

                                      Guaranteed, secured, unsubordinated, fixed rate bonds
                                      Bondholders share the benefit of the same security package as bank lenders. The Statutory Supervisor has first rights to the
                                      proceeds of security enforcement against all assets of the Village Registered Companies, and the bank lenders and bondholders
Instrument
                                      share the remaining proceeds of the Village Registered Companies to which the Security Trustee is entitled on a pro rata basis
                                      Bank lenders and bondholders have a first ranking mortgage over all land and permanent buildings owned (or leased under a
                                      registered lease) by Guarantors that are Non-Village Registered Companies

                                      Guaranteed by the Guaranteeing Group, consistent with bank lenders and existing bonds. Total assets of the Guarantors must be at
Guarantee                             least 90% of Summerset Group’s assets and EBITDA of the Guarantors must be at least 90% of the EBITDA of the Summerset
                                      Group

Tenor and Maturity Date               7 years, maturing 24 September 2025

Offer Amount                          Up to $75,000,000, with the ability to accept oversubscriptions of up to $25,000,000 at the discretion of the Issuer
Credit rating                         Unrated

                                      Sum of the Issue Margin and the Base Rate, but in any case will be no less than the minimum Interest Rate. The Interest Rate will be
Interest rate
                                      announced by Summerset via NZX on or shortly after the Rate Set Date

Interest payment                      Quarterly in arrear in four equal payments

                                      Neither Holders nor Summerset are able to redeem the Bonds before the Maturity Date. However, Summerset may be required to
Early redemption
                                      repay the Bonds early if there is an Event of Default

                                      Summerset to ensure the LVR* covenant: Total Debt of the Summerset Group / Property Value of the Summerset Group is
Key dates of the offer
Offer open 10 September to 14 September 2018
Retail bond offer Date
Opening Date 10 September 2018
Firm bids due Friday, 14 September 2018, 12pm
Closing Date and Rate Set Date 14 September 2018
Issue Date and Allotment Date 24 September 2018
Expected date of initial quotation on the NZX Debt Market 25 September 2018
Interest Payment Dates 24 March, 24 June, 24 September, 24 December
First Interest Payment Date 24 December 2018
Maturity Date 24 September 2025
Retail bond presentation 27Investment highlights
Compelling fundamentals in the retirement village and aged care sector, driven by an ageing population
1.
and increasing market penetration
Second largest developer of new retirement units, with a successful track record of delivering new
2.
retirement units and care beds
Strong cash flow, financial performance, and earnings growth potential from a maturing village profile,
3.
growing aged care contribution, development pipeline and development efficiencies
4. Strong balance sheet with quality assets and a conservative capital structure
Funding is used only as working capital to fund developments through their lifecycle, with debt repaid in
5.
full as villages are built and sold down
Industry diversification for bond holders, with Summerset being the only listed NZ retirement village
6.
operator with bonds available for retail investors
Retail bond presentation 28Questions?
Manukau Wigram
Nelson Manukau
Retail bond presentation 29Appendices
Board of directors
  ROB CAMPBELL            JAMES OGDEN                 DR MARIE BISMARK               ANNE URLWIN                 GRÁINNE TROUTE                  DR ANDREW WONG
     Independent             Non-executive                 Non-executive               Non-executive                   Non-executive                 Non-executive
       Chairman               Independent                   Independent                 Independent                     Independent                   Independent

■ Over 30 years’          ■ Chair of the              ■ Dually trained as a       ■ Professional director with   ■ Many years’ experience in     ■ Currently Managing
  experience as a           Investment Committee        lawyer and doctor           experience in a diverse        senior executive roles with     Director of
  director and investor     of Pencarrow Private                                    range of sectors including     Coopers and Lybrand             MercyAscot Hospital
                                                      ■ Divides her time
                            Equity and MMC                                          construction, health,          (now PwC), McDonald’s           Group and Healthcare
■ Chair, WEL Group Ltd,                                 between Australia and       infrastructure, financial
                            Limited                                                                                Restaurants NZ, HR              Holdings Limited
  Tourism                                               New Zealand                 services and                   Consultancy Right
  Holdings Ltd, and       ■ Director, Vista Group                                   telecommunications                                           ■ Also a director of a
                                                      ■ Worked in the health                                       Management and most
  SKYCITY                   International and                                                                                                      number of medical
                                                        sector for many years;                                     recently as General
  Entertainment Group       Foundation Life (NZ)                                  ■ Deputy Chair, Southern                                         organisations. These
                                                        her areas of expertise                                     Manager Corporate
                                                                                    Response Earthquake                                            cover a diverse range
■ Director, Precinct      ■ Former Country              include patient safety      Services Ltd
                                                                                                                   Services at SKYCITY
                                                                                                                                                   of areas such as
  Properties New            Manager, Macquarie          and healthcare                                             Entertainment Group
                                                                                                                                                   surgical hospitals, day
  Zealand Ltd               Bank and former             complaints resolution     ■ Director, Steel and Tube
                                                                                                                ■ Director, Tourism Holdings       surgeries, diagnostic
                            Director, Credit Suisse                                 Holdings Ltd, Chorus Ltd,
■ Holds a Bachelor of                                 ■ Associate Professor at      and Tilt Renewables Ltd
                                                                                                                  Ltd, Evolve Education            radiology and cancer
                            First Boston
  Arts with First Class                                 the University of                                         Group Ltd, and Investore         care
  Honours in Economic     ■ Holds a Bachelor of         Melbourne                 ■ Other directorships include   Property Ltd
  History and Political     Commerce and                                            City Rail Link Ltd and ANZ
                                                      ■ Director, GMHBA Health                                  ■ Spent many years as a
  Science and a Masters     Administration with                                     Bank subsidiary OnePath
                                                        Insurance and Veterans’     Life (NZ) Ltd
                                                                                                                  trustee and chair in the
  of Philosophy in          First Class Honours
                                                        Health Advisory Panel                                     not-for-profit sector,
  Economics                 and is a Chartered
                                                                                  ■ Chartered Accountant with     including as Chair of
                            Fellow of the Institute
                                                                                    experience in senior          Ronald McDonald House
                            of Directors and a
                                                                                    finance management roles      Charities NZ for five years
                            Fellow of the
                                                                                    in addition to her
                            Chartered Accountants
                                                                                    governance roles
                            of Australia and New
                            Zealand

                                                                                                                                        Retail bond presentation       31
Highly experienced management
JULIAN COOK SCOTT SCOULLAR FAY FRENCH PAUL MORRIS AARON SMAIL DEAN TALLENTIRE ELEANOR YOUNG
Chief Executive Deputy Chief Executive General General Manager General General General Manager
Officer Officer and Chief Manager Sales Development Manager Manager Operations and
Financial Officer Australia Development Construction Customer Experience
■ Overall responsibility ■ Overall responsibility for ■ Leads our national ■ Leads Summerset’s ■ Leads ■ Dean is in his 4th year ■ Oversees the
for the company, its the financial management sales team investigation of Summerset’s with Summerset and operational performance
operations and of the company development development team leads the construction across all Summerset
strategy ■ Fay has a breadth of opportunities in the in New Zealand, team villages ensuring
■ Also leads the Corporate experience across Australian market which covers Summerset residents
■ In his previous role as Services area at sales, hospitality and identifying and ■ Responsibility includes
receive the highest-
Chief Financial Officer, Summerset which the health sector ■ Paul has been with purchasing new design management,
quality service and care
Julian oversaw includes the Finance, Summerset since sites, project building consenting,
Summerset as it Legal, Human Resources, ■ Prior to joining early 2000 feasibilities, tenders, commercial ■ Joined Summerset in
became a publicly Property, Marketing and IT Summerset in 2015, management, project
consents, master 2016
listed company, first on teams she held a sales ■ Commenced in the delivery teams, quality
planning and
the NZX in November leadership role at a GM Development assurance and ■ Eleanor has held senior
■ Before joining the leading New Zealand Australia role in design standards
2011, and then the supporting teams roles in Inland Revenue,
company in 2014, Scott e-commerce platform 2018 having for villages
Australian Securities including four years as
Exchange (ASX) in held CFO roles at Housing where she was previously been GM ■ Previous roles in ■ He has extensive the Group Manager of
July 2013 New Zealand and Inland responsible for Development New his 25+ years of experience across Customer Services,
Revenue leading a team of Zealand since 2003 property and property, development managing services to
■ Prior to joining business development and construction with customers with around
Summerset, Julian ■ Recipient of NZICA’s development over 20 years experience
experience include 2,000 staff
spent 11 years in the Public Sector CFO of the managers in both the UK and New
senior positions at
investment sector, Year Award 2011 Zealand ■ Background in Human
■ A registered nurse, Todd Property
which included a Resources within both
■ Special commendation at Fay has worked in Group and Kiwi ■ Prior to joining
significant amount of the public and private
the 2012 New Zealand various nursing roles Property Summerset Dean had 14
work with retirement sector working in
CFO Summit Awards and medical sales for years at Fletcher Building
village and aged-care ■ Aaron has been managerial roles for the
companies ■ Fellow of CPA Australia Roche with Summerset within commercial and Ministry of Social
and a CPA New Zealand Pharmaceuticals since 2015 residential markets Development, Mighty
Council Board member across public and private River Power, and Air
sectors New Zealand
Retail bond presentation
32Demographics – market share
Aged care and retirement village market share
Market share - care beds Market share - retirement units
Summerset 2%
Summerset 9%
Bupa 10%
Other operators
Other operators 48%
66%
Ryman 9% Ryman 17%
Oceania 7%
Arvida 5%
Metlifecare 1%
Metlifecare 12%
Arvida 5%
Bupa 4%
Oceania 4%
Source: CBRE as at May 2018
Retail bond presentation 33Demographics - population
Population over 75 years forecast to grow 245% from 2018 to 2068
Population growth 75 years and over Per annum population growth 75 years and over
1,200,000 18% 25,000
16%
1,000,000
20,000
14%
800,000 12%
15,000
10%
600,000
8%
10,000
400,000 6%
4%
5,000
200,000
2%
0 0% 0
1997-2002
2002-2007
2007-2012
2012-2017
2017-2022
2022-2027
2027-2032
2032-2037
2037-2042
2042-2047
2047-2052
2052-2057
2057-2062
2062-2067
1997
2002
2007
2012
2017
2022
2027
2032
2037
2042
2047
2052
2057
2062
2067
NZ population 75+ (left hand axis) % population 75+ (right hand axis)
Source: Statistics New Zealand – National Population Projections
Retail bond presentation 34ORA overview
How an occupation right agreement (ORA) works
Residents moving into a retirement village enter into an ORA
How an Occupation Right Agreement works:
Example of a single retirement unit over one ownership cycle*
An ORA grants the resident the right to occupy a retirement unit in
exchange for a lump sum payment to the operator (residents’ 500
475 475
loans on the balance sheet) e.g. 2.5% Gain on
400 (nominal) p.a. resale
400
Legal ownership of the retirement unit remains with the retirement
village operator DMF
Cash flows ($000)
300
A deferred management fee (DMF) is accrued over a resident’s
tenure and realised on the resale of their ORA. For Summerset,
this is typically a maximum of 25% of the ORA price 200 ORA purchase price
Returned
When Summerset sells an ORA on a retirement unit previously to
resident
occupied, the lump sum payment from the previous resident, less 100
the DMF, is repaid to the previous resident using proceeds from
the incoming resident
0
Year 0 Year 1 Year 2 Year 3 Year 4 Year 5 Year 6 Year 7 Year 7
* This is an illustrative example of a $400k ORA with a 25% deferred management fee charge and
a duration of 7 years. The example assumes 2.5% nominal growth per annum in the market price
of the ORA and is shown for illustrative purposes only
Retail bond presentation 35Portfolio as at 30 June 2018
3,443 retirement units and 858 care beds
Existing portfolio - as at 30 June 2018
Total Total
Village Villas Apartments Serviced apartments Memory care apartments
retirement units care beds
Ellerslie 34 23 57 - 114 58
Hobsonville 115 37 29 - 181 52
Karaka 143 - 59 - 202 50
Manukau 89 67 27 - 183 54
Warkworth 164 2 44 - 210 41
Auckland 545 129 216 - 890 255
Hamilton 183 - 50 - 233 49
Rototuna 14 - - - 14 -
Taupo 94 34 18 - 146 -
Waikato 291 34 68 - 393 49
Katikati 140 - 20 - 160 49
Bay of Plenty 140 - 20 - 160 49
Hastings 146 5 - - 151 -
Havelock North 94 28 - - 122 45
Napier 94 26 20 - 140 48
Hawke's Bay 334 59 20 - 413 93
New Plymouth 108 - 40 - 148 52
Taranaki 108 - 40 - 148 52
Levin 64 22 - 10 96 41
Palmerston North 90 12 - - 102 44
Wanganui 70 18 12 - 100 37
Manawatu-Wanganui 224 52 12 10 298 122
Aotea 96 33 38 - 167 -
Paraparaumu 92 22 - - 114 44
Trentham 231 12 20 - 263 44
Wellington 419 67 58 - 544 88
Nelson 214 - 55 - 269 59
Nelson-Tasman 214 - 55 - 269 59
Casebrook 31 - - - 31 -
Wigram 143 - 53 - 196 49
Christchurch 174 - 53 - 227 49
Dunedin 61 20 20 - 101 42
Otago 61 20 20 - 101 42
Total 2,510 361 562 10 3,443 858
Retail bond presentation 36Land bank as at 30 June 2018*
Land bank* of 3,333 retirement units and 368 care beds
Land bank - as at 30 June 2018*
Serviced & memory care Total Total
Village Villas Apartments
apartments retirement units care beds
Ellerslie 8 196 0 204 0
Hobsonville 10 36 23 69 0
Karaka 39 0 0 39 0
Parnell 0 264 76 340 48
St Johns 0 236 76 312 32
Warkworth 38 0 0 38 0
Auckland 95 732 175 1,002 80
Rototuna 174 0 76 250 43
Waikato 174 0 76 250 43
Katikati 16 0 0 16 0
Bay of Plenty 16 0 0 16 0
Te Awa 252 0 76 328 43
Hawke's Bay 252 0 76 328 43
New Plymouth 216 0 76 292 43
Taranaki 216 0 76 292 43
Kenepuru 100 93 106 299 43
Lower Hutt 42 109 66 217 30
Trentham 0 0 20 20 0
Wellington 142 202 192 536 73
Richmond 234 0 76 310 43
Nelson 234 0 76 310 43
Avonhead 156 12 98 266 43
Casebrook 229 12 76 317 43
Wigram 16 0 0 16 0
Christchurch 401 24 174 599 86
Total 1,530 958 845 3,333 411
* Land bank reflects current intentions as at June 2018 and includes acquisition of new land in New Plymouth post 30 June 2018 half year balance date
Retail bond presentation 377 year metrics summary
Underlying profit 7 year CAGR of 41%
Half Year Results 7 Year CAGR* 1H18 2H17 1H17 2H16 1H16 2H15 1H15 FY11
New sales of occupation rights 15% 145 203 179 231 183 173 160 108
Resales of occupation rights 14% 154 156 144 121 123 135 110 123
Operational
Total sales 15% 299 359 323 352 306 308 270 231
New retirement units delivered 15% 165 279 171 219 190 162 141 122
Retirement units in portfolio 14% 3,443 3,278 2,999 2828 2609 2419 2257 1,486
Care beds in portfolio 16% 858 806 748 748 621 616 523 327
Total revenue ($m) 21% 65.7 59.8 50.7 46.0 40.0 36.2 32.6 33.7
Net profit after tax ($m) 68% 82.0 133.2 90.3 94.9 50.6 48.5 35.7 4.3
Underlying profit** ($m) 41% 45.2 46.0 35.7 31.9 24.7 20.7 17.1 8.1
Net operating cash flow ($m) 23% 92.8 121.3 86.4 108.2 84.4 76.7 63.6 43.7
Financial (NZ$m)
Total assets ($m) 22% 2,419.6 2,216.3 1,932.1 1,706.8 1,521.4 1,363.5 1,161.3 616.9
Total equity ($m) 20% 840.5 769.3 627.6 545.6 448.7 409.8 363.7 233.4
Interest bearing loans and borrowings ($m) 28% 379.7 347.2 315.3 274.0 262.7 248.2 160.9 69.1
Cash and cash equivalents ($m) 7% 14.7 7.6 13.1 8.7 9.4 6.7 6.5 9.0
Gearing ratio (Net D/ Net D+E) 6% 30.3% 30.7% 32.5% 32.7% 36.1% 37.1% 29.8% 20.5%
EPS (cents) (IFRS profit) 63% 37.22 60.86 41.37 43.6 23.3 22.4 16.5 2.39
NTA (cents) 19% 377.85 347.56 285.72 249.9 206.1 188.5 167.5 109.33
Development margin (%) 27% 33.0% 26.9% 28.0% 23.6% 20.3% 21.4% 18.4% 6.2%
* Compound annual growth rate. Annualised 1H18 result compared to FY11
** Refer to slide 2 for further information on underlying profit
Retail bond presentation 38You can also read