INVESTMENT COMMUNITY PRESENTATION - Results for the 12 months ended 30 June 2018 - Imperial Logistics
←
→
Page content transcription
If your browser does not render page correctly, please read the page content below
INVESTMENT COMMUNITY
PRESENTATION
Results for the 12 months ended
30 June 2018
Agenda

     OVERVIEW   CONTEXT   OPERATIONS   FINANCIAL     PATH TO     LOOKING
                            REVIEW      REVIEW     SEPARATION   FORWARD

                                                                           2
Agenda

    OVERVIEW   CONTEXT   OPERATIONS   FINANCIAL     PATH TO     LOOKING
                           REVIEW      REVIEW     SEPARATION   FORWARD

                                                                          3
Overview
  › Solid results & improvement in all key financial metrics
  › Good performance from Motus, enhanced by a gain in market share in South Africa & acquisitions
  › Imperial Logistics performed satisfactorily in mixed trading conditions
  › Free cash flow up 17% to R5.0 billion
  › Significant progress made on the proposed unbundling of Motus

                                                                                                     4
Group highlights
RECORD GROUP REVENUE OPERATING PROFIT HEPS*
11% 6% 27%
R128 683 million R6 406 million 1 570 cents
per share
EPS* NET DEBT : EQUITY RATIO FINAL DIVIDEND
38% Improved significantly to 50% 17% to 387 cps
1 681 cents (incl pref shares as debt)
2017: 74% H1 2018: 84%)
(45% of HEPS)
per share
ROIC OF 12.9% (2017 11.3%) VS WACC OF 9.7% ROE OF 15.0% (2017: 12.7%)
Note: ROE, ROIC & WACC are calculated on a rolling 12 month basis
* Excluding Regent 5
Growth trend in operations outside South Africa

                                REVENUE                                                      OPERATING PROFIT
                                                                  58 950                                                 2 385
                                    Rm                                                              Rm
    4 year                                                                 4 year                 2 169         2 240
    CAGR=                          49 728         48 917                   CAGR=
     14%                                                                    13%     1 854
                    40 352
     34 471                                                                1 493

     Jun 14         Jun 15         Jun 16         Jun 17          Jun 18   Jun 14   Jun 15        Jun 16        Jun 17   Jun 18

› Foreign revenue up 21% to R59.0 billion (45% of group)
› Foreign operating profit up 6% to R2.4 billion (37% of group)

 Growth in operations outside South Africa to offset the limited growth opportunities dictated by Imperial’s position
 as a South African market leader in logistics & motor vehicles
                                                                                                                                  6
Agenda

     OVERVIEW   CONTEXT   OPERATIONS   FINANCIAL     PATH TO     LOOKING
                            REVIEW      REVIEW     SEPARATION   FORWARD

                                                                           7
Operating context – Imperial regions

South Africa (55% revenue; 63% operating profit)
›   Despite improved sentiment the economy contracted sharply in H2 F2018
›   Consumer affordability remains under pressure despite some monetary easing
›   Depressed volumes & competitive pressures in logistics
›   Highly competitive vehicle market
    • NAAMSA national vehicle unit sales increased by 2%
Rest of Africa (9% revenue; 13% operating profit)
› Recovery in commodity prices, gradually improving domestic demand & some policy reforms improved economic
  prospects in most countries in sub-Saharan Africa
› Imperial’s performance in the Rest of Africa (predominantly logistics) was negatively impacted by:
    •   political instability in Kenya;
    •   recessionary conditions in Namibia;
    •   increased competition & subdued demand from key aid & relief markets; &
    •   the R/US$ exchange rate strengthening by 5% on average during the year

                                                                                                              8
Operating context – Imperial regions

Eurozone, UK & Australia (36% revenue; 24% operating profit)
› Economic conditions in Europe were positive
   • the continuing economic expansion in Europe has resulted in unemployment improving
   • certain sectors in which we operate remain under pressure, e.g. steel
› Our German shipping operations were negatively impacted by low water levels on the River Rhine
  in H1 F2018; hot weather conditions since July 2018 has again resulted in low water levels
› Palletways’ performance was hindered by toughening economic conditions in the UK
› Economic growth & the passenger vehicle market in the UK are being depressed by the uncertainties arising
  from Brexit & consumers switching from diesel vehicles to petrol vehicles
› The Australian vehicle market recorded growth despite being fragmented & highly competitive, but margins
  on new vehicles remain under pressure
› New EU emissions regulation stipulating lower emission thresholds & process for approval, will lead to OEMs
  reducing vehicle production volumes in H1 F2019, & negatively impact sales of vehicles manufactured in
  Europe

                                                                                                              9
Agenda

     OVERVIEW   CONTEXT   OPERATIONS   FINANCIAL     PATH TO     LOOKING
                            REVIEW      REVIEW     SEPARATION   FORWARD

                                                                           10
Imperial’s divisions
IMPERIAL LOGISTICS MOTUS
Revenue Operating profit Revenue Operating profit
3% 3% 17% 9%
R51.4 billion R2.9 billion R77.7 billion R3.6 billion
40% contribution* 44% contribution* 60% contribution* 56% contribution*
4 YEAR CAGR 6% 4 YEAR CAGR 6% 4 YEAR CAGR 6% 4 YEAR CAGR 0%
* Excludes head office & eliminations 11Imperial’s divisions
Performance Acquisitions
› Growth in revenue & operating profit, supported by: › 70% of Surgipharm in Kenya for
• solid performances from Eco Health in Nigeria & CIC USD35 million (R485 million), effective
in Mozambique; 1 July 2017
• acquisition of Surgipharm; • performed slightly below
• excellent results from the international shipping expectation due to political
& automotive segments in Logistics International; & uncertainty & disruptive elections
• disposal & closures of non-strategic businesses in Kenya, but still contributed
› Performance was negatively impacted by: positively
• lower volumes & contract renewals at lower margins
in South Africa; Disposals
Revenue • reduced operating profit from Imres & loss of a large › Schirm GmbH & related property
3% public healthcare contract in African Regions; & transactions for €134 million
R51.4 billion • disappointing performances in the European inland
shipping, retail & industrial businesses
(R2.0 billion) in January 2018;
› 6 non-strategic properties for
40% contribution* › Excluding businesses held for sale, revenue & operating R367 million;
4 YEAR CAGR 6% profit increased by 8% & 5% respectively
› Transport Holdings in Botswana which
› The net debt to equity ratio at 50% (2017: 122%) improved
Operating profit significantly due to:
released capital of R200 million;
› Laabs GmbH for €2 million (R32 million)
3% • sale of non-core or underperforming businesses & in October 2017; and
R2.9 billion non-strategic properties; &
• recapitalisation of African Regions
› Interests in smaller entities amounting
44% contribution* to ~R55 million
4 YEAR CAGR 6%
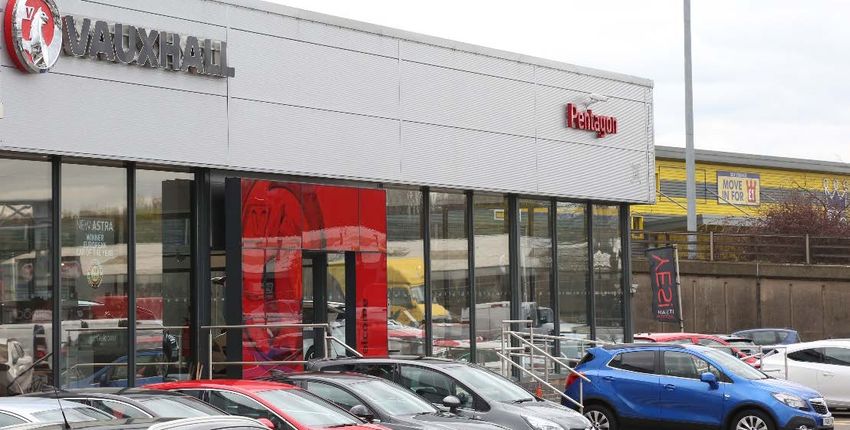
* Excludes head office & eliminations 12Divisional overview – Imperial Logistics
Imperial Logistics is an integrated outsourced logistics service provider with a diversified presence across Africa & Europe. With its strong
regional growth platforms, specialist capabilities customised to serve multi-national clients in attractive industry verticals, & “asset-right”
business model, Imperial Logistics is expected to deliver sustainable revenue growth, enhanced profitability & a stable dividend
IMPERIAL LOGISTICS
South Africa African Regions International
› Leading end-to-end capabilities to provide outsourced › Leading distributor of pharmaceuticals & consumer › Asset right transportation management (shipping/road)
services to extensive client base across verticals packaged goods in Southern, East & West Africa › Leading capabilities in chemical & automotive verticals
› Integrated offerings evolving to enhance value › Managed Solutions being expanded across the region › Specialised express distribution capabilities
› Revenue 1%; Operating profit 4% › Revenue 9%; Operating profit 3% › Revenue 4%; Operating profit 3%
› Operating margin 5.8% (2017: 5.6%) › Operating margin 7.0% (2017: 7.4%) › Operating margin 4.7% (2017: 4.7%)
› 33% Logistics revenue › 20% Logistics revenue › 47% Logistics revenue
› 34% Logistics operating profit › 26% Logistics operating profit › 40% Logistics operating profit
› ROIC of 13.7% vs WACC of 11.0% › ROIC of 17.5% vs WACC of 11.1% › ROIC of 9.6% vs WACC of 6.3%
› Debt to Equity: 64% (2017: 40%) › Debt to Equity: 23% (2017: >150%) › Debt to Equity: 56% (2017: 128%)
Note: Based on external revenue, excluding businesses held for sale. ROIC & WACC are calculated on a rolling 12 month basis 13Imperial Logistics (total)
REVENUE OPERATING PROFIT
Rm Rm
4 year
CAGR= 68% foreign 4 year
CAGR= 67% foreign
+6% +6% 2 853
49 715 51 399 2 764
47 912 2 545 2 543
44 418 2 241
41 339
Jun 14 Jun 15 Jun 16 Jun 17 Jun 18 Jun 14 Jun 15 Jun 16 Jun 17 Jun 18
› Solid revenue & operating profit growth trends
› Comprised R51.4 billion (40% of group* revenue) – up 8% (excl. businesses held for sale)
› Comprised R2.9 billion (44% of group* operating profit) – up 5% (excl. businesses held for sale)
Discipline will be applied in pursuit of aggressive capital light, organic & acquisitive growth of integrated supply chain
& route-to-market solutions for global & national market leaders, in specific industries including healthcare, consumer
packaged-goods, manufacturing & mining, chemicals & energy, automotive & equipment, & agriculture
* Excludes head office & eliminations 14Imperial’s divisions
Performance Acquisitions
› All four sub-divisions recorded revenue & operating › Pentagon Motor Holdings for
profit growth £26 million (R479 million), effective
› Results were supported by: 1 September 2017
• strong improvement in SA entry level & smaller • operates 38 passenger & light
SUV sales; commercial vehicle franchises from
21 prime retail dealerships in the UK
• gain in market share in our importer brands in SA;
• performed satisfactorily
• benefits from consolidation of motor businesses; &
• the acquisitions of Pentagon (UK) & SWT (Australia) › 75% SWT Group Pty Ltd for
AUD24.2 million (R261 million),
Revenue contributed positively to revenue at lower margins
effective 1 October 2017
› Motus’ debt to equity ratio at 50% (2017: 46%)
17% increased marginally, mainly due to
• operates 16 dealerships in Australia
R77.7 billion • acquisitions; partly offset by
• performed in line with expectations
60% contribution* • disciplined working capital management; & › 60% of Arco Motor Industry Co Limited
4 YEAR CAGR 6% • proceeds received from the disposal of
for R185 million
non-strategic properties • distributor of motor vehicle engine
Operating profit parts based in Taiwan
› Between 70% & 80% of operating profit in Motus is not
9% vulnerable to new vehicle sales Disposals
R3.6 billion › At 31 July 2018 cover extends to February 2019
› Disposed of 32 non-strategic properties
56% contribution* at R12.89/$ and R15.60/€
for R1.3 billion
4 YEAR CAGR 0%
* Excludes head office & eliminations 15Divisional overview – Motus
Southern Africa’s largest vehicle group, operating across the motor value chain, importing, distributing, retailing & renting vehicles, & distributing
& retailing aftermarket parts, supported & augmented by motor related financial services
MOTUS
Vehicle import & distribution Vehicle retail & rental Aftermarket parts Motor-related financial services
› Exclusive RSA importer of Hyundai, Kia, › RSA: › Distributor, wholesaler & retailer of › Markets & administers service, maintenance &
Renault & Mitsubishi • Represents 23 OEMs through 356 vehicle accessories & parts for older vehicles through: warranty plans, & other value-added products
› Over 80 000 vehicles imported annually dealerships inc. 104 pre-owned, 232 • 35 owned branches (over 730 000 clients)
› Nissan distributorships in 4 African countries passenger dealerships & 20 commercial • 43 retailed owned stores › Develops & distributes innovative vehicle-
vehicle dealerships related financial products & services through
• network of 720 franchised outlets comprising
• 118 Europcar & Tempest car rental outlets in dealer & vehicle finance channels, online &
of both retail & specialist workshops
SA & 16 in Southern Africa a national call centre
› UK 84 commercial & 28 passenger dealerships › Provider of fleet management services
› Australia 30 passenger dealerships › Deploys an innovation hub
› Revenue 11%; Operating profit 8% › Revenue 18%; Operating profit 14% › Revenue 8%; Operating profit 10% › Revenue 6%; Operating profit 7%
› Operating margin 3.9% (2017: 4.0%) › Operating margin 2.7% (2017: 2.8%) › Operating margin 6.7% (2017: 6.6%) › Operating margin 41.0% (2017: 40.9%)
› 22% Motus revenue › 68% Motus revenue › 8% Motus revenue › 2% Motus revenue
› 21% Motus operating profit › 44% Motus operating profit › 12% Motus operating profit › 23% Motus operating profit
› ROIC of 12.7% vs WACC of 11.3% › ROIC of 9.4% vs WACC of 9.9% › ROIC of 18.3% vs WACC of 11.2% › ROIC of 69.5% vs WACC of 13.6%
› Debt:Equity: 37% (2017: 109%) › Debt to Equity: 62% (2017: 46%) › Debt:Equity: 91% (2017: 53%) › Debt:Equity: (136%)* (2017: 116%)
Note: Based on external revenue, excluding businesses held for sale. ROIC & WACC are calculated on a rolling 12 month basis 16
* Includes net cash of R1 426 millionMotus (total)
REVENUE OPERATING PROFIT
Rm Rm
4 year 4 year
CAGR=
+6% 31% foreign CAGR=
0% 14% foreign
77 659
68 479 3 554 3 402 3 593
66 413 66 540 3 257 3 310
62 263
Jun 14 Jun 15 Jun 16 Jun 17 Jun 18 Jun 14 Jun 15 Jun 16 Jun
Jun1717 Jun
Jun 18
18
› Comprised R77.7 billion (60% of group* revenue) – up 17% for the year
› Comprised R3.6 billion (56% of group* operating profit) – up 9% for the year
The assets & capabilities of Motus comprise the entire vehicle value chain from OEM to user. Its current structure & focus
will continue with high cash generation, returns & dividends, through greater value to clients & more disciplined
management of capital, operations & currency
* Excludes head office & eliminations 17Divisional statistics
OPERATING MARGIN RETURN ON INVESTED CAPITAL* WEIGHTED AVERAGE COST OF CAPITAL*
% % %
10.1%
10.4%
13.0%
11.3%
12.9%
11,5%
12,2%
11,8%
5,0%
5,6%
5,6%
5,0%
4,6%
5,2%
7,1%
8,5%
9,0%
9,7%
Logistics Motus Group Logistics Motus Group Logistics Motus Group
2017 2018 2017 2018 2017 2018
18Agenda
OVERVIEW CONTEXT OPERATIONS FINANCIAL PATH TO LOOKING
REVIEW REVIEW SEPARATION FORWARD
19Income statement
2018 2017
Rm Rm % CHANGE
Revenue 128 683 115 889 11
Revenue contribution
per division
(%)
2018 2017
2018 % 2017 %
LOGISTICS 40 43
MOTUS 60 57
20Income statement
2018 2017
Rm Rm % CHANGE
Revenue 128 683 115 889 11
Operating profit 6 406 6 049 6
Operating profit margin 5.0 5.2%
Operating profit contribution
per division
(%)
2018 2017
2018 % 2017 %
LOGISTICS 44 46
MOTUS 56 54
21Income statement
Jun 2018 Jun 2017
Rm Rm % CHANGE
Revenue 128 683 115 889 11
Operating profit 6 406 6 049 6
Amortisation of intangible assets arising on business combinations (note 1) (432) (521)
Profit on disposal of properties, net of impairments (note 2) 639 212
Impairments of goodwill & other assets (note 3) (273) (157)
Loss on sale of businesses (140) (88)
Foreign exchange gains / (loss) (note 4) (93) (619)
Re-measurement of contingent consideration, put option liabilities
62 (115)
& business acquisition costs
Other (7) 3
Profit before financing costs 6 162 4 764 29
1. Decreased by R89 million due to sale of Schirm & certain intangible assets being fully amortised in F2017
2. Increased by R427 million largely due to the sale of the property in Australia, which contributed R617 million
3. Largely due to a R173 million impairment on the sale of Jurgens is a once-off item that negatively impacted the HEPS performance in F2018
4. Foreign exchange losses decreased by R526 million to R93 million:
• in Imperial Logistics African Regions losses were contained to R50 million against R194 million in F2017 due to the stronger Rand; &
• in Motus, losses of R43 million compared to a loss of R425 million, due to the unwinding of uneconomical & excessive cover in the prior year
22Income statement
Jun 2018 Jun 2017
Rm Rm % CHANGE
Net financing costs (note 1) (1 386) (1 680) (18)
Income from associates 90 103
Tax (note 2) (1 458) (901)
Net profit for the year – before Regent in 2017 3 408 2 286 49
Regent 279
Attributable to minorities (note 3) (135) 36 >100
Attributable to Imperial shareholders 3 273 2 601 26
1. Decreased by R294 million due to significantly lower average debt levels and improved cash flow
2. Tax rate increased to 30.5% from 29.2% mainly due to losses on the sale of businesses being non-deductible
3. Increased due to:
• improved results from Renault & Eco Health;
• the acquisitions of Surgipharm, Itumele Bus Lines & SWT; &
• the prior year losses included Tata
23Financial position
Jun 2018 Jun 2017
Rm Rm % CHANGE
Property, plant & equipment (note 1) 9 829 10 371 (5)
Transport fleet (note 2) 5 358 5 560 (4)
Vehicles for hire 3 924 3 963 (1)
Goodwill & intangible assets (note 3) 9 805 9 529 3
Investments in associates, other investments & other financial assets 1 959 1 807 8
Net working capital (note 4) 8 761 8 956 (2)
Other assets (includes assets held for sale) 639 1 373
Total 40 275 41 559
1. Decreased by 5% mainly due to:
• PPE relating to the disposals of Schirm & Transport Holdings of R1.0 billion;
• R413 million increase due to the acquisitions of Surgipharm, Pentagon & SWT;
• currency adjustments which increased by R172 million; &
• impairments of R115 million
2. Decreased by 4% resulting from:
• disposal of assets through the disposal of Schirm & Transport Holdings; &
• the value of disposals & depreciation are higher than the capital expenditure
3. Increased by 3% mainly due to the acquisitions of R1.1 billion, the weakening of the Rand (R480 million), reduced by disposals (R754 million)
& amortization (R560 million)
24
4. Improved by 2% mainly due to a reduction in inventory & improved supplier credit terms in MotusFinancial position
Jun 2018 Jun 2017
Rm Rm % CHANGE
Total shareholders’ equity (note 1) 23 125 20 261
Net interest bearing borrowings (note 2) 11 566 15 088 (23)
Other liabilities 5 584 6 210
Liabilities directly associated with assets classified as held for sale -
Equity & liabilities 40 275 41 559
1. Impacted mainly by:
• the weakening of the Rand (closing) which resulted in an increase in the foreign currency translation reserve of R538 million;
• an increase in the hedging reserve of R184 million;
• capital raised of R223 million from non-controlling interests; &
• dividends paid (R1.5 billion)
2. Mainly impacted by:
• good cash generation from operations of R6.8 billion (F2017: R5.9 billion);
• disposal of businesses for R2.1 billion;
• properties sold for R1.7 billion;
• acquisitions (R1.2 billion); &
• capital expenditure excluding properties (R2.5 billion); &
• dividends paid (R1.5 billion)
25Cash flow – operating activities
Jun 2018 Jun 2017
Rm Rm % CHANGE
Cash generated by operations 8 721 8 388 4
Net working capital movements (excludes currency movements & net acquisitions) (note 1) 811 688
Interest & tax paid (note 2) (2 722) (3 190)
Cash flow from operating activities before rental assets capex 6 810 5 886 16
Capex: rental assets (note 3) (1 079) (1 709) (37)
Cash inflow / (outflow) from operating activities 5 731 4 177 37
1. Net working capital movements resulted in an inflow of R811 million, mainly due to a reduction in inventory & improved supplier credit terms in Motus
• We expect inventory levels to normalise in H1 F2019
2. Interest reduced due to lower debt levels
3. Reduced due to a lower investment in vehicles for hire by the Vehicle Import and Distribution sub division
26Cash flow summary
Jun 2018 Jun 2017
Rm Rm
Cash flow from operating activities 5 731 4 177
Investing activities: 890 (1 939)
Net disposals / (acquisitions) of subsidiaries & businesses (note 1) 859 (1 687)
Capital expenditure – non-rental assets (note 2) 240 (954)
Net movement in associates, investments, loans & other financial instruments (209) 326
Financing activities: (2 566) (1 801)
Dividends paid (1 478) (1 688)
Other financing activities (note 3) (1 088) (113)
Decrease in net borrowings (4 055) 437
Free cash flow – total operations 5 016 4 296
Free cash flow to headline earnings (times) 1.6 1.6
1. The main contributor was proceeds received on the disposal of Schirm, partially offset by the acquisitions of Pentagon, Surgipharm, SWT & Arco
2. Net inflow on non-rental capital expenditure mainly due to the benefit of property disposals of R1.7 billion
3. Other significant cash flow items included share buy backs, buy out of minorities & settlement of cross-currency swaps
27Gearing
NET DEBT TO EQUITY
› Significant improvement in net debt to equity
was supported by:
20 625
• cash proceeds from the sale of non-strategic
18 147
16 515
17 249 properties & businesses;
15 158 107% 15 088
14 325 • an improvement in working capital;
83% 86% 83% 84% 11 591 • a reduction in capital expenditure;
74% 74% • partially offset by the acquisitions of
Surgipharm, SWT, Pentagon, Arco & the
50%
increase in shareholding in Eco Health
› The Group has R13.9 billion unutilised funding
facilities (excluding asset backed finance
facilities)
H1 H2 H1 H2 H1 H2 H1 H2
2015 2016 2017 2018 › Mix of fixed & floating debt (52% fixed)
› Debt maturity profile: 80% long term (longer
Net interest-bearing debt (Rm) Net debt to equity than 12 months)
› Net debt to equity of 50% improved significantly from 74% in June 2017 & 84% in December 2017 › The Group’s international & national scale credit
› Below the target gearing range of 60% to 80% ratings by Moody’s are unchanged at Baa3 &
Aa1.za
› Lowest debt level in 5 years
› Net Debt/EBITDA = 1.3x (Logistics 1.4x; Motus 1.2x)
28Returns
ROE ROIC vs WACC
18,7 Rm %
16,8 14,8
15,3 15,0 13,8
12,7 12,8 12,9
11,3
9,7 9,7
9,5
9,0 9,0
2014 2015 2016 2017 2018 2014 2015 2016 2017
2017 2018
2018
ROIC WACC
ROE improved due to: ROIC improved due to:
› Higher attributable profit › Reduced invested capital from lower net asset levels
› Higher returns
Note: ROE, ROIC & WACC are calculated on a rolling 12 month basis, excluding Regent in F2017 & F2018 29Agenda
OVERVIEW CONTEXT OPERATIONS FINANCIAL PATH TO LOOKING
REVIEW REVIEW SEPARATION FORWARD
30PORTFOLIO PRE-2014
› Founded in 1948 as a motor dealership & listed on the JSE in 1987, Imperial evolved into one of
the country’s largest diversified conglomerates
› The Group adopted a federal business model which:
• facilitated & encouraged the acquisition, development & growth of large & small businesses; &
• sought to balance a strong entrepreneurial culture with appropriate financial control & sound governance
› The Group was invested in a vast portfolio of businesses & assets, some of which were stand-alone
or unrelated to the Group’s core capabilities:
• capital equipment and leasing, aviation, Imperial Bank, etc;
• chemical manufacturing;
• managing ports in Germany;
• owning properties (warehouses & dealerships) in non-strategic locations;
• non motor-related insurance (Regent); &
• industrial equipment (Goscor)
› The establishment of the African Regions business commenced in 2010 through the acquisition of CIC
31FUNDAMENTAL TRANSFORMATION SINCE 2014
› From late 2014 a fundamental transformation was initiated to unlock intrinsic value within the Group
› The changes sought to retain the entrepreneurial creativity & capital management excellence while
ensuring that the structure, strategies & value propositions of the Group’s divisions were clarified,
simplified & focused, for sustainable competitive advantage, growth & returns
› The transformation & development of Imperial was directed at value creation through:
• strategic clarity (portfolio rationalisation);
• managerial focus (organisation structure); &
• shareholder insight (disclosure)
32Portfolio rationalisation
› Substantial portfolio optimisation resulted in:
1. The disposal of assets that did not fit the Group & underlying business unit’s strategies & did not generate sufficient
returns on capital or executive effort
– 55 businesses & 90 properties that were under performing, of low return on effort or strategically incompatible,
which included buying out minorities
– generated revenues of R14.4 billion & operating profit of R1.1 billion, & employed R7.0 billion of capital at the time
of sale
2. Acquired strategically coherent, asset light and high-quality businesses
– investment of R5.7 billion to acquire 17 companies that generated revenue of R14.2 billion & operating profit of
R1.0 billion in their first full year of operation
– expected to deliver sustainable organic growth, & enhanced returns & cash flows in future
– grown Imperial Logistics African Regions footprint in SADC, East & West Africa to a ~R10 billion revenue business
› The rationalisation of the portfolio & the clarification of strategy resulted in Imperial’s activities being
consolidated into two large, self-sufficient divisions: Imperial Logistics & Motus, operating exclusively in the
logistics & automotive sectors respectively
› Proceeds from the sale of businesses & properties significantly reduced the Group’s net debt to equity ratio
• improved from 84% in December 2017 to 50%, excluding proceeds from the BBBEE deal in Logistics South Africa
33Organisation structure
› Since 1 July 2016, Imperial Logistics is being managed as one division
following the consolidation of the Africa & International businesses under
one CEO, significantly improving strategic coherence & capital discipline
› From 1 January 2017, Imperial's entire vehicle interests were consolidated
into one entity, Motus
› Imperial Logistics & Motus have since been operating as individual
entities, each with its own board, CEO, EXCO & increasingly self-sustaining
balance sheets
› Appropriate executive management changes were made to accommodate
the new structure & the succession of retiring executives, in a transition
to significantly younger leadership teams
› The functions of the Imperial head office were systematically devolved to
the two divisions
• From 1 July 2017, the Group’s EXCO was disbanded & its authorities
devolved to the divisional boards
34Disclosure
› From 1 July 2016, Imperial Logistics & Motus have been reported on separately, per sub-division, as part
of the segmental disclosure:
• Separate income statements, balance sheets & most recently ROICs & WACCs per each sub-division
› This increase in transparency & disclosure allows for each business to be valued & modelled separately
Note: Significant IT projects for Motus will be implemented in H2 2018 35Rationale for the proposed unbundling of Motus
› No operational synergies exist between Imperial Logistics & Motus
› Imperial Logistics & Motus operate independently in markets & geographies that are vastly different
› Both businesses have different strategic focuses & priorities
› With self-sustaining balance sheets achieved in each division, the Group’s balance sheet is no longer
necessary
› On 21 June 2018 the Imperial Board resolved to proceed with the steps required to implement the
unbundling of Motus, which will be underpinned by the following:
• Strategic focus & independence
• Improved operational efficiency mainly through the reduction in complexity & costs over time
• Focused capital & funding structures:
– provide respective management teams with direct access & accountability to the equity & debt capital markets, each with the
appropriate capital structure to support their strategies on a long term sustainable basis, & the ability to raise funding
independently
• Enhanced investor understanding & insight of each business & its sub-divisions
› The proposed unbundling will provide shareholders with the opportunity to participate directly in Imperial
Logistics &/or Motus
36Substantial progress
› Ensuring that the balance sheet of each division is self-sustaining, with an appropriate gearing level to enable
each to fund its own growth &strategic aspirations while continuing to pay a stable dividend
• Imperial Logistics & Motus have achieved appropriate, self-sufficient capital structures, each with net debt:equity
ratio of 50% at 30 June 2018; lower than the range of 55% to 65% that was originally communicated
› Negotiations with funders to secure appropriate debt facilities for each division
• the debt syndication process & refinancing of existing facilities are in process & on track
• sufficient commitments including an underwriting for the off-shore facilities have been secured for Imperial Logistics
& Motus to facilitate growth, provide flexibility & maintain strong liquidity at competitive pricing levels
› The bonds were redeemed by utilising existing banking facilities at market value on 6 August 2018
• no new bonds will be issued as all debt requirements will be arranged in the banking market
• as such, in the event of the unbundling, Imperial Logistics & Motus will not have formal credit ratings
37Substantial progress | continued
› An offer to acquire the preference shares was announced on 13 August 2018
• buyback to be implemented during October 2018
• the buyback is an efficient means for Imperial to simplify its capital structure & for preference shareholders to dispose
of the preference shares in an orderly & effective manner
› Ensuring that the appropriate legal structures for both entities have been finalised prior to the unbundling
• the appropriate legal structures for both entities have been finalised
• the transfer of the Group’s automotive interests to Motus Holdings Limited has been completed
› Obtaining the requisite regulatory approvals ie. JSE, SARB, TRP & US section 44
• progressing well
› Ukhamba BEE scheme
• to be replicated post the unbundling to ensure that all shareholders in Ukhamba Holdings retain the same economic
rights that they presently enjoy
› Active engagement with key stakeholders
38Next steps
› The unbundling of Motus & its separate listing on the main board of the JSE is still subject to approval by
shareholders & the fulfilment of requisite regulatory requirements
› Engagement with key investors commenced over a year ago
› A combined general meeting for preference shares and ordinary share holders will take place on 14 September 2018
re’ preference share scheme
› The debt syndication process is expected to be concluded during September 2018
› An Imperial circular & Motus pre-listing statement will be circulated to shareholders by 30 September 2018
› A general meeting for shareholder approval will take place on 30 October 2018
› On implementation of the unbundling, ‘Imperial Holdings’ will be renamed ‘Imperial Logistics’
It is anticipated that the unbundling will be implemented in Q4 of calendar 2018
39Imperial Logistics: Investment Proposition
Leading positions in regional markets provide platforms for sustainable growth: market leader in South Africa, a leader in selected industries
1 (Consumer Packaged Goods & Pharmaceuticals) in the African Regions & in certain specialised capabilities in Europe
Competitive differentiation centred on agility & customisation: specialised capabilities across the value chain enable customised &
2 integrated solutions, with service offerings & operating models tailored to client requirements & market maturity
Trusted partner to multinational clients: quality contract portfolio in high-growth & defensive industries, with partnerships demonstrating
3 reach, capabilities, assets, innovation & legitimacy
“Asset-right” business model underpins financial profile: more optimal asset mix & targeted returns on capital, support prospects for
4 sustainable revenue growth & enhanced profitability & cash generation
Vision to unlock benefits of ‘one Imperial Logistics’: strategy focused on sustainable revenue growth, enhanced returns & improved
5 competitiveness, with initiatives to drive substantial organic growth enabled by differentiated approach to digitalisation & innovation,
& enhanced financial flexibility supporting selective acquisitive growth
Track record for consistent growth: proven ability to acquire, develop & leverage specialist capabilities to establish growth platforms in
6 emerging & advanced markets
7 Strong & committed leadership: highly experienced, long-serving management team & a strong independent Board
40Motus: Investment Proposition
Unique fully integrated business model across the Automotive value chain: import & distribution, retail & rental, motor- related financial
1 services, & aftermarket parts supplier
Diversified service provider to the Automotive sector (non-manufacturing) with a leading position in South Africa & selected international
2 presence (UK & Australia)
Strong exposure to annuity income streams, sustainable free cash flow generation with best-in-class earnings, providing a platform for an
3 attractive dividend yield
Unrivalled scale underpinning a differentiated value proposition to OEMs, customers & business partners, providing multiple customer touch
4 points which supports resilience & customer loyalty through the entire vehicle ownership cycle
Defined organic growth trajectory through portfolio optimisation, continuous operational enhancements & innovation, with a selected
5 acquisition growth strategy outside South Africa
Highly experienced management team with deep industry knowledge of regional global markets, & a proven track record with years of
6 collective experience
41Agenda
OVERVIEW CONTEXT OPERATIONS FINANCIAL PATH TO LOOKING
REVIEW REVIEW SEPARATION FORWARD
42Prospects for F2019
We anticipate that both Imperial Logistics & Motus
will deliver solid operating & financial results in F2019,
subject to stable currencies in the economies in which each operates.
For the financial year to June 2019, we expect:
› Imperial Logistics & Motus will have appropriate capital structures, with minimal impact on funding & costs,
to enable each to fund its own growth & strategic aspirations while continuing to pay a stable dividend
(approximately 45% of HEPS)
› Imperial Logistics & Motus to record growth in revenues & operating profit
› Growth in headline earnings per share for Imperial Logistics & Motus, subject to any once-off costs relating to the
proposed unbundling
We thank all our stakeholders for their continued support.
43THANK YOU
ANNEXURES
Growth trend Logistics South Africa
REVENUE OPERATING PROFIT
Rm Rm
4 year -1% 4 year +4%
CAGR= CAGR=
1% 0%
16 498 16 310 939 952 919 952
15 755 15 372
14 447 828
Jun 14 Jun 15 Jun 16 Jun 17 Jun 18
Jun Jun 14 Jun 15 Jun 16 Jun 17 Jun 18
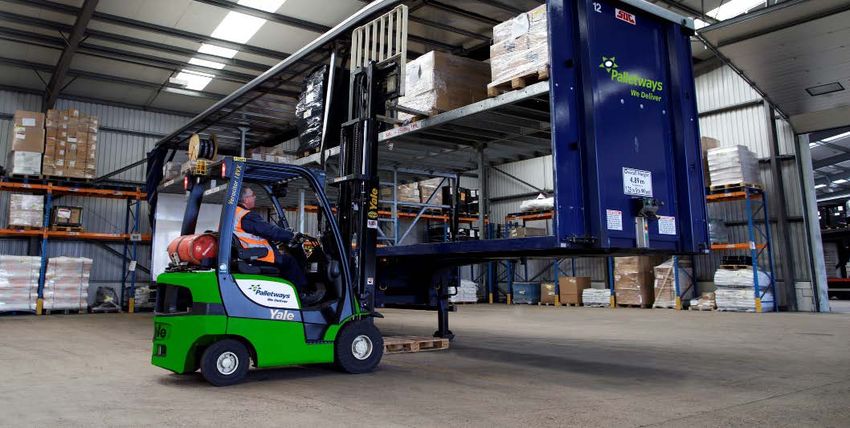
› Satisfactory performance in challenging trading conditions: › CPG business underperformed due to lower sales volumes in the
• positive contribution from the Itumele Bus Lines acquisition which was ambient & merchandising segments
included for 12 months › ROIC improved significantly to 13.7% (2017: 12.3%) mainly due to
• solid results from the Transport & Warehousing, & Specialised Freight improved capital management & the sale of strategically-misaligned
businesses; assets
• disposal & closures of some smaller, non strategic businesses; offset by › Excluding businesses held for sale, revenue increased by 1% & operating
• renewal of contracts at lower margins, further reduction in volumes & profit reduced by 1%
depressed margins in H2 F2018 specifically
46Growth trend Logistics African Regions
REVENUE OPERATING PROFIT
Rm Rm
4 year +9% 4 year +3%
CAGR= CAGR=
+14% 11 016 10 823 +23%
9 974 9 947 773 740 759
635
6 319
331
Jun 14 Jun 15 Jun 16 Jun 17 Jun 18 Jun 14 Jun 15 Jun 16 Jun 17 Jun 18
› Performed below expectation - revenue & operating profit increased by 9% • transport operations in Namibia experienced reduced volumes;
& 3% respectively • Sourcing and procurement business underperformed due to increased
› The average strengthening of the Rand by 5% against the US Dollar competition, uncertainty in aid & relief markets, & longer lead times in
negatively impacted performance in Rands executing orders; &
• Sub-Saharan healthcare logistics business was negatively impacted by
› A mixed performance across the portfolio:
the loss of a large, public healthcare contract
• strong performance from the West African healthcare businesses;
• acquisition of Surgipharm where a positive contribution was supressed by › The business was recapitalised during the year resulting in a significantly
political uncertainty in Kenya; lower net debt to equity ratio of 23% (2017: >150%)
• solid performance from the Managed Solutions businesses in SADC; › ROIC declined to 17.5% (2017: 23.8%) mainly due to an increased
• CPG route-to-market Namibian operations performed satisfactorily in investment in Eco Health (from 68% to 87%) & normalised
ongoing recessionary conditions; working capital 47Our African footprint
Pharma & healthcare logistics & supply chain management
Pharma distributors (full RTM solution, including sales function)
Pharma & medical supplies (wholesaling) (project work across multiple territories)
Managed Solutions in East & West Africa, SA & SADC
Logistics & supply chain management (various industries)
Consumer distributors (full RTM solution including sales function)
In-country operations
Countries serviced by agents
48Growth trend Logistics International
REVENUE OPERATING PROFIT
Rm Rm
4 year +4% 4 year +3%
CAGR= CAGR=
+6% +4%
23 270 24 266 1 142
1 105
19 512 971 958 1 000
19 249 19 071
Jun 14 Jun 15 Jun 16 Jun17*
Jun 17 Jun 18 Jun 14 Jun 15 Jun 16 Jun 17 Jun 18
› Grew revenue & operating profit in Rands by 4% and 3% respectively › The European inland shipping business underperformed due to low
› Revenue & operating profit, excluding businesses held for sale (Schirm), water levels on the River Rhine
increased by 8% and 12% respectively in Rand terms › The retail, steel & industrial sub- divisions delivered unsatisfactory
results resulting from lower volumes
› Results were supported by:
› Palletways performed below expectations due to toughening economic
• excellent results from the automotive contract logistics business, conditions in the UK & continued competitive pressure in sub-scale
which grew both new & existing business; & operations
• a strong performance from the international shipping operations › ROIC improved to 9.6% (2017: 8.2%) & is above the targeted WACC+2%
* Restated 49Logistics International (EURO)
REVENUE OPERATING PROFIT OPERATING MARGINS
€m €m %
0% -1%
5,8%
75,3 74,6
4,8% 4,7%
1 574 1 581
3,7%
45,8
788 793 28,8
2017* 2018 H1 2018 H2 2018 2017 2018 H1 2018 H2 2018 2017 2018 H1 2018 H2 2018
› Revenue was flat & operating profit decreased by 1% in Euros
› Revenue & operating profit, excluding businesses held for sale (Schirm), increased by 4% and 6% respectively in Euros
› 2018 average R/€: 15.34 vs 2017 average R/€: 14.81
› Effective currency hedge & diversification in group portfolio
* Restated 50Motus divisional review
VEHICLE IMPORT & DISTRIBUTION › Revenue & operating profit increased by 11% & 8% respectively due to:
• 11% increase in new vehicle sales (Hyundai up 4%, Kia up 22%
& Renault up 22% per NAAMSA); &
• vehicle mix aligned to market demand for consumer affordability
› Importer market share increased to 14.9% from 13.7%
› Hyundai & Kia forward cover extends to February 2019 at average rates of
R12.89 to the US Dollar & R15.61 to the Euro
› With the exception of Renault, Motus’ current guideline is to cover a
minimum of seven months forward & up to 75% of annual forecast orders,
as stipulated by the South African Reserve Bank
› ROIC increased to 12.7% (2017: 6.4%) resulting from:
• increased profitability;
• a significant reduction in working capital;
• lower investment in vehicles for hire; &
• the sale of non-strategic properties
Revenue Operating profit
11% 8%
R20.1 billion R788 million
51National vehicle sales 2009 – 2018
IMPERIAL’S SHARE OF TOTAL NAAMSA VEHICLE SALES & GDP GROWTH
800 9%
644 631 639
599 588
600 29 31 31 544 556 6%
530 27 30
495 481 491 15 15
Vehicle units (thousands)
437 441 24 454 446
424 430
26 20 409
400 3%
312 341
GDP growth (%)
200 0%
99 97 117 120 119 117 112 105 111
0 80 (3%)
F 2009 F 2010 F 2011 F 2012 F 2013 F 2014 F 2015 F 2016 F 2017 FF2018
2018
Imperial Non-Imperial Other GDP growth % (rhs)
› SA new passenger & commercial sales track GDP growth › Imperial total sales F2018*
› Calendar 2018 forecast: • New
• Imperial: 2% growth in total vehicle market – Passenger: 133 732 (98 843) (+35%)
• NAAMSA: 2% to 4% growth – Commercial: 12 723 (14 231) (-11%)
• Preowned
› NAAMSA total market F2018: 556 007 ( 544 644 ) (+2%)
– Passenger: 77 007 (67 690) (+14%)
– Commercial: 4 116 (2 238) (+84%)
* Passenger includes Australia & Commercial includes UK. F2018 also includes the Pentagon (UK) & SWT (Australia) acquisitions 52Motus’ market share vs OEMs
MARKET SHARE*
22,5% 23,4%
15,9% 15,3%
14,9%
13,7% 13,1%
11,7%
10,0%
8,2%
5,2% 4,4%
Jun 17 Jun 18 Jun 17 Jun 18 Jun 17 Jun 18 Jun 17 Jun 18 Jun 17 Jun 18 Jun 17 Jun 18
Motus direct imports Mercedes Ford Toyota Volkswagen Nissan
Motus
› Motus total market share in South Africa, including vehicles sold through our retail dealerships on behalf of OEMs, remains at ~20%
› Motus market share of direct imports increased from 13,7% to 14,9% & comprises the 3rd largest share of the total SA vehicle market
* Graph is presented on a 12 month basis from July 2017 to June 2018 for South Africa only. Numbers include Passenger, LCV, MCV & HCV 53South African new vehicle prices
SELLING PRICE VS CURRENCY COST OF IMPORTED PRODUCT
% 130
125
120
115
Based to 100
110
105
100
95
90
Dec
Dec
Mar
Mar
Dec
Dec
Jun
Mar
Mar
Jun
Jun
Jun
Sep
Sep
Sep
Sep
2014 2015 2016 2017 2018
Euro based cost (ind. Sep14)
Dollar based cost (ind. Sep14)
Selling price
> 48% imports in USD
> 52% imports in EUR
54Motus divisional review
VEHICLE RETAIL & RENTAL › Grew revenue & operating profit by 18% & 14% respectively due to:
• new & pre-owned retail sales volumes increased by 33% & 15% respectively
• South African margins were enhanced by a realignment of the importer
dealership operating model to unlock value
› The Motus passenger & light commercial vehicle businesses in South Africa
experienced a 2% increase in new vehicle sales units
› Dealerships of the importer performed well due to an increase in sales volumes,
mainly entry level hatch vehicles & small SUVs, in Hyundai, Kia & Renault
› The parts & aftersales segments continue to perform well
› Revenue & operating profit of the UK operations increased by 70% & 25%
respectively, supported by the Pentagon acquisition
› Newly acquired passenger segment of our business performed below
expectation due to Brexit, a reduction in sales of diesel vehicles & Vauxhall
changing ownership to the French PSA group
› The UK commercial operations grew revenue & operating profit by 5% & 1%
respectively
› The Australian vehicle market recorded growth but margins on new vehicles
Revenue Operating profit remain under pressure
18% 14% › Car rental increased its revenue & operating profit by 11% & 15% respectively
R62.8 billion R1.7 billion › ROIC reduced to 9.4% (2017: 10.7%) due to:
• the acquisitions of Pentagon & SWT; &
• higher working capital
55Motus divisional review
AFTERMARKET PARTS › Grew revenue & operating profit by 8% & 10% respectively, supported
by:
• good performances from Beekmans & Alert Engine Parts; &
• tighter cost control
› Performance negatively impacted by market contraction, increased
pricing pressure & consumers trading down
› The acquisition of 60% of Arco contributed positively to H2 F2018
performance
› ROIC decreased to 18.3% (2017:20.7%) due to:
• increased working capital; &
• investment in a warehouse facility which was included in invested
capital
Revenue Operating profit
8% 10%
R6.6 billion R447 million
56Divisional review
MOTOR RELATED FINANCIAL SERVICES › Grew revenue & operating profit by 6% & 7% respectively due to:
• higher profitability in demo vehicle sales & maintenance funds; &
• positive growth in the VAPS operations
› Increased sales of monthly versus longer term service & maintenance
plans impacted the growth of maintenance & warranty contracts on the
balance sheet
› Continued focus on growing the fleet management business
› ROIC increased to 69.5% (2017: 65.7%) due to higher profitability during
the rolling 12 month period
Revenue Operating profit
6% 7%
R2.16 billion R889 million
57Disclaimer
Certain statements made in this presentation constitute forward-looking statements. Forward-looking statements are typically identified by
the use of forward-looking terminology such as ‘believes’, ‘expects’, ‘may’, ‘will’, ‘could’, ‘should’, ‘intends’, ‘estimates’, ‘plans’, ‘assumes’ or
‘anticipates’ or the negative thereof or other variations thereon or comparable terminology, or by discussions of, e.g. future plans, present or
future events, or strategy that involve risks & uncertainties. Such forward-looking statements are subject to a number of risks & uncertainties,
many of which are beyond the company's control & all of which are based on the company's current beliefs & expectations about future
events. Such statements are based on current expectations &, by their nature, are subject to a number of risks & uncertainties that could
cause actual results & performance to differ materially from any expected future results or performance, expressed or implied, by the
forward-looking statement. No assurance can be given that such future results will be achieved; actual events or results may differ materially
as a result of risks & uncertainties facing the company & its subsidiaries. The forward-looking statements contained in this presentation speak
only as of the date of this presentation.
The company undertakes no duty to, & will not necessarily, update any of them in light of new information or future events, except to the
extent required by applicable law or regulation.
58You can also read