Pembina Pipeline Corporation - Investor Presentation January 2021
←
→
Page content transcription
If your browser does not render page correctly, please read the page content below

Pembina Pipeline
  Corporation
   TSX: PPL | NYSE: PBA

     Investor
   Presentation
    January 2021
Forward-looking statements and information
This presentation contains certain forward-looking statements and information         success of Pembina's operations and growth projects; that impacts from the               including changes, or prolonged weaknesses, as applicable, in interest rates,
(collectively, “forward-looking statements”) that are based on Pembina's              COVID-19 pandemic on Pembina’s business and growth projects are not                      foreign currency exchange rates, commodity prices, supply/demand trends and
expectations, estimates, projections and assumptions in light of its experience       materially greater than expected; the approval and availability of one or more           overall industry activity levels; risks relating to widespread epidemics or
and its perception of historical trends as well as current market conditions and      vaccines for COVID-19 and the efficient distribution thereof and the resultant           pandemic outbreaks, including risks relating to the ongoing COVID-19
perceived business opportunities. In some cases, forward-looking statements           lessening of the impact of the COVID-19 pandemic into 2021; prevailing                   pandemic; changes in credit ratings; counterparty credit risk; and technology
can be identified by terminology such as "expects", "will", "would", "anticipates",   commodity prices, interest rates and exchange rates and the ability of Pembina           and cyber security risks.
"plans", "estimates", "develop", "intends", "potential", "continue", "could",         to maintain current credit ratings; the availability of capital to fund future capital
"forecast", "create", "keep", and similar expressions suggesting future events or     requirements relating to existing assets and projects; future operating costs;           Additional information on these factors as well as other risks that could impact
future performance.                                                                   geotechnical and integrity costs; that the TSX will approve Pembina’s normal             Pembina's operational and financial results are contained in Pembina's Annual
                                                                                      course issuer bid as expected; that any third-party projects relating to Pembina's       Information Form and Management's Discussion and Analysis for the year
In particular, this presentation contains forward-looking statements, including       growth projects will be sanctioned and completed as expected; that any required          ended December 31, 2019, Management's Discussion and Analysis for the
certain financial outlooks, pertaining to, without limitation: expectations           commercial agreements can be reached; that all required regulatory and                   three month period ended September 30, 2020, and described in our public
regarding adjusted EBITDA; 2021 guidance and the capital budget; Pembina's            environmental approvals can be obtained on the necessary terms in a timely               filings available in Canada at www.sedar.com and in the United States at
corporate strategy and the development and expected timing of new business            manner; that counterparties will comply with contracts in a timely manner; that          www.sec.gov. Readers are cautioned that this list of risk factors should not be
initiatives and growth opportunities and the expected timing thereof; Pembina's       there are no unforeseen events preventing the performance of contracts or the            construed as exhaustive.
options for allocating capital, including any potential common share repurchases      completion of the relevant facilities; the technology will be sufficient to obtain
through a normal course issuer bid; expectations regarding global energy              greenhouse gas emissions reductions and targets; that there are no unforeseen            The forward-looking statements contained in this document speak only as of the
demand; expectations about industry activities and development opportunities;         material costs relating to the facilities which are not recoverable from customers;      date of this document. Except as expressly required by applicable securities
expectations about future growth opportunities and the demand for our services;       prevailing interest and tax rates; prevailing regulatory, tax and environmental          laws, Pembina and its subsidiaries assume no obligation to update forward-
expectations regarding new corporate developments and their impact on access          laws and regulations; maintenance of operating margins; the amount of future             looking statements should circumstances or management's expectations,
to markets; planning, construction, capital expenditure and cost estimates,           liabilities relating to lawsuits and environmental incidents; and the availability of    estimates, projections or assumptions change. The forward-looking statements
schedules, locations, regulatory and environmental applications and approvals,        coverage under Pembina's insurance policies (including in respect of Pembina's           contained in this document are expressly qualified by this cautionary statement.
expected capacity, incremental volumes, power output, completion and in-              business interruption insurance policy).                                                 Readers are cautioned that management of Pembina approved the financial
service dates, rights, activities and operations with respect to planned                                                                                                       outlooks contained herein as of the date of this presentation. The purpose of the
construction of, or expansions on, deferred projects, existing pipelines systems,     While Pembina believes the expectations and assumptions reflected in these               financial outlooks contained herein is to give the reader an indication of the
gas services facilities, processing and fractionation facilities, terminalling,       forward-looking statements are reasonable as of the date hereof, there can be            value of Pembina's current and anticipated growth projects. Readers should be
storage and hub facilities, facility and system operations and throughput levels;     no assurance that they will prove to be correct. Forward-looking statements are          cautioned that the information contained in the financial outlooks contained
plans and activities related to deferred projects and estimated project costs;        subject to known and unknown risks and uncertainties which may cause actual              herein may not be appropriate for other purposes.
levels and types of contracted volumes; expected contract expiries and                performance and financial results to differ materially from the results expressed
renewals; establishing greenhouse gas emissions targets; intended outcomes            or implied, including but not limited to: the regulatory environment and decisions;
resulting from the Carbon Stand; plans and strategies to improve environmental,       the ability of Pembina to raise sufficient capital (or to raise sufficient capital on
social and governance performance, including as such relates to compensation          favourable terms) to fund future expansions and growth projects and satisfy
methodologies; plans to achieve certain diversity targets at each of the board,       future commitments; failure to negotiate and conclude any required commercial
executive and employee levels through the implementation of the Inclusion and         agreements or failure to obtain project sanctioning; increased construction
Diversity Stand and under the Board Diversity Policy, as the case may be; the         costs, or construction delays, on Pembina's expansion and growth projects;
impact of current market conditions on Pembina; expected cost savings and             labour and material shortages; non-performance or default by counterparties to
efficiencies; Pembina's credit ratings; Pembina’s objectives with respect to its      agreements which Pembina or one or more of its affiliates has entered into in
financial guardrails; Pembina's commitment to and the future level and                respect of its business; the failure to realize the anticipated benefits or synergies
sustainability and potential growth of cash dividends that Pembina intends to         of completed acquisitions, integration issues or otherwise; the impact of
pay its shareholders, including the expected future cash flows, the sufficiency       competitive entities and pricing; reliance on key industry partners, alliances and
and expected uses thereof; and plans regarding the monetization of assets.            agreements; the strength and operations of the oil and natural gas production
                                                                                      industry and related commodity prices; the continuation or completion of third-
Undue reliance should not be placed on these forward-looking statements as            party projects; actions by governmental or regulatory authorities including
they are based on assumptions made by Pembina as of the date hereof                   changes in tax laws and treatment, changes in royalty rates, climate change
regarding, among other things: oil and gas industry exploration and                   initiatives or policies or increased environmental regulation; adverse general
development activity levels and the geographic region of such activity; the           economic and market conditions in Canada, North America and worldwide,
                                                                                                                                                                                                                                                            2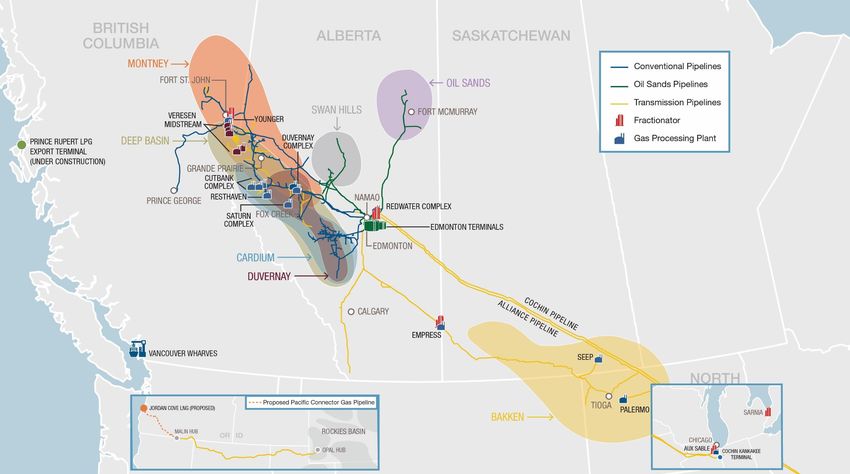
Non-GAAP measures
In this presentation, Pembina has used the terms adjusted EBITDA, adjusted EBITDA per common share, Debt to adjusted EBITDA, fee-based adjusted EBITDA, fee-
based distributable cash flow, adjusted cash flow from operating activities per common share (“adjusted cash flow per share”), cash flow after dividends, funds from
operations to debt (“FFO/Debt”), and debt to total capitalization; which do not have any standardized meaning under GAAP. Since these non-GAAP financial measures
do not have a standardized meaning prescribed by GAAP and are therefore unlikely to be comparable to similar measures presented by other companies, securities
regulations require that non-GAAP financial measures be clearly defined, qualified and reconciled to their nearest GAAP measure. These non-GAAP measures are
calculated and disclosed on a consistent basis from period to period. Specific adjusting items may only be relevant in certain periods.

The intent of non-GAAP measures is to provide additional useful information respecting Pembina's financial and operational performance to investors and analysts and
the measures do not have any standardized meaning under GAAP. The ratio of funds from operations to debt is a ratio defined and used by Pembina's rating agencies in
the evaluation of the Company's credit worthiness. Fee-based distributable cash flow is defined as wholly owned fee-based adjusted EBITDA plus the fee-based portion
of distributions from equity accounted investees, less preferred share dividends, interest and illustrative cash taxes. Management believes fee-based distributable cash
flow provides investors with a useful figure, which shows Pembina's historical ability to pay dividends on its common shares. Non-GAAP measures should not be
considered in isolation or used in substitute for measures of performance prepared in accordance with GAAP.

Other issuers may calculate these non-GAAP measures differently. Investors should be cautioned that these measures should not be construed as alternatives to
earnings, cash flow from operating activities or other measures of financial results determined in accordance with GAAP as an indicator of Pembina's performance.

In accordance with IFRS, Pembina’s jointly controlled investments are accounted for using equity accounting. Under equity accounting, the assets and liabilities of the
investment are net into a single line item in the Consolidated Statement of Financial Position, Investments in Equity Accounted Investees. Net earnings from investments
in equity accounted investees are recognized in a single line item in the Consolidated Statement of Earnings and Comprehensive Income, Share of Profit from Equity
Accounted Investees. Cash contributions and distributions from investments in equity accounted investees represent Pembina’s proportionate share paid and received in
the period to and from the investments in equity accounted investees. To assist the readers understanding and evaluate the performance of these investments, Pembina
is supplementing the IFRS disclosure with non-GAAP proportionate consolidation of Pembina’s interest in the investments in equity accounted investees. Pembina's
proportionate interest in equity accounted investees has been included in adjusted EBITDA.

For additional information regarding non-GAAP measures, including reconciliations to the most directly comparable measures recognized by GAAP, please refer to
Pembina's management's discussion and analysis for the year ended December 31, 2019, which is available online at www.sedar.com, www.sec.gov and
www.pembina.com.
                                                                                                                                                                       3
Pembina at a glance
Overview

                > 65 year history of serving the
                                                                                                               $3.2 - 3.4 billion
                North American market and now                                    ~$34 billion(1)
                                                                                                           2021(E) Adjusted EBITDA
                 actively expanding its global                                  Enterprise Value
                                                                                                                  Guidance
                           presence

               Highly integrated transportation
                 and midstream services to the                                                                   $785 million
                                                                                  BBB (Stable)
                North American energy market                                                               2021(E) capital investment
                                                                                  Credit Rating
               through various assets along the                                                                    program
                  full hydrocarbon value-chain

                         Three Divisions:                                   2021(E) capital investment   Re-activating Peace Phase VII
                     Pipelines, Facilities and                               program fully funded by     Expansion and Empress Co-
                    Marketing & New Ventures                                 cash flow after dividends    generation Facility projects

                 Over 65+ years Pembina has grown to become a leading North American energy infrastructure company
(1) Updated as at December 10, 2020.
See "Forward-looking statements and information“ and “Non-GAAP measures”.                                                                5
2020 accomplishments
In a year of unprecedented challenges arising from the COVID-19 pandemic, Pembina took decisive action to protect all
stakeholders and has delivered strong results including staying within pre-pandemic adjusted EBITDA guidance.

                                                       • Safety remained our top priority
    Employees and
                                                       • Restricted business travel, cancelled large group meetings and employed work-from-home protocols for non-
    Communities
                                                         essential employees and contractors

                                                       • Determined the essential staff and critical infrastructure required to ensure uninterrupted service to our customers
                                                         while maintaining the safety of our assets, employees and other stakeholders
    Customers
                                                       • We focused on processing and transporting the maximum amount of product for our customers, thus supporting
                                                         their cashflow

                                                       • Deferred some previously announced expansion projects thus reducing 2020 capital spending by $900 million to
                                                         $1.1 billion, or approximately 40 to 50 percent and strengthening liquidity
                                                       • $150 million of cost savings and efficiencies realized throughout the business
    Investors
                                                       • Remain within original pre-pandemic adjusted EBITDA guidance in a year impacted by the demand and supply
                                                         shocks
                                                       • Pembina entered into a new $800 million unsecured revolving credit facility, shoring up our liquidity

       In response to the COVID-19 pandemic Pembina effectively ‘hit the pause button’ to protect all stakeholders
See "Forward-looking statements and information“ and “Non-GAAP measures”.                                                                                                       6
Summary of recent announcement
     On December 14, Pembina announced its 2021 financial guidance and provided a fulsome business update via a
     press release, which is available at www.pembina.com/media-centre/news-releases/

           2021 Financial                    • Adjusted EBITDA of $3.2 to $3.4 billion
           Guidance                          • Capital investment program of $785 million

                                             • Activity in the conventional pipelines business has steadily improved since the second quarter of 2020; since the production lows experienced in
                                               late April and early May, Pembina has seen a recovery of approximately 100,000 barrels per day across its conventional pipeline systems, with
           Business                            2020 exit rates equaling rates seen at the beginning of 2020
           Update
                                             • With the conventional systems currently operating at, or near, take-or-pay levels, there is tremendous operational leverage as incremental
                                               volumes will contribute directly to the Company's financial results

                                             • Re-activating the Phase VII Peace Pipeline Expansion and Empress Co-generation Facility growth projects
                                             • Pembina and its partner have suspended execution of their petrochemical project indefinitely due to the significant risks arising from the ongoing
           Project
                                               COVID-19 pandemic, most notably with respect to project costs
           Updates
                                             • Continuing to evaluate the Peace Pipeline Phase VIII and IX expansions and the Prince Rupert Terminal Expansion and expect to make final
                                               decisions on these projects in 2021

                                             • 2021 capital investment program is fully funded by cash flow from operating activities after dividends at the low end of the adjusted EBITDA
                                               guidance range; progressing towards the higher end of the guidance range will see Pembina generate incremental discretionary cash, which will
           2021 Capital                        be available for debt reduction, or opportunistic common share repurchases
           Allocation
                                             • Pembina intends to make an application to the TSX for a normal course issuer bid, which subject to TSX approval, would enable the repurchase
                                               of up to five percent of its outstanding common shares over a 12-month period

                                               Given positive signs, 2021 outlook is supportive of being able to ‘hit play’ again
See "Forward-looking statements and information“ and “Non-GAAP measures”.                                                                                                                     7
Purpose of Pembina
Customers choose us first
Investors receive sustainable
for reliable and value-added
industry-leading total returns
services
Employees say we are the
Communities welcome us and
‘employer of choice’ and
recognize the net positive
value our safe, respectful,
impact of our social and
collaborative and fair work
environmental commitment
culture
To be the leader in delivering integrated infrastructure solutions connecting global markets
See "Forward-looking statements and information". 8Integrated transportation and midstream assets
~3 mmbpd
hydrocarbon
transportation capacity
~6 bcf/d
gas processing capacity
~130 mbpd
condensate stabilization
~356 mbpd
fractionation capacity
~32 mmbbl
storage capacity
~25 mbpd
propane export capacity
in 2021
See "Forward-looking statements and information".The Pembina Store
Gas & NGL (HVP)
Gas
Consumers
Mainline Extraction
NGL
and Fractionation
(Younger, Empress,
NGL
Alliance (proposed)
Gathering, 3rd Party Aux Sable)
Pipeline
Processing, Pipelines
Field Extraction
Industrial Users
C2 C2
C3
C2+ mix
C4 3rd Party
C3+ mix Pipelines &
C5 NGL
Prince Rupert Facilities
C5+ NGL Redwater Redwater & LPG Vancouver
Producers Pipelines Storage Aux Sable Marketing & Export Terminal Wharves
Fractionation Distribution (under construction)
Oil & Condensate (LVP)
Heavy Oil
Producers
Field Truck Domestic Import Canadian Diluent Oil Sands & Crude Oil Edmonton North
Edmonton
Terminals Terminals C5 Pipelines C5 Pipelines Hub Heavy Oil Pipelines Pipelines Terminal
North+Terminal
~10 mmbbl Refining
(& Upgrading)
Customers value our growing integrated service offering
See "Forward-looking statements and information". 10Energy & ESG
Global energy outlook
                        5 000
                                                                                                                                                                  •   Global primary energy demand is expected to increase
                                                                IEA 2020 World Energy Outlook, Stated Policies Scenario
                                                                                                                                                                      19% by 20401
                                                                                   2019         2030         2040
                        4 000                                                                                                                                     •   Total oil and natural gas demand is expected to increase
                                                                                                                                                                      16% by 20401
 Energy Demand (Mtoe)

                        3 000                                                                                                                                     •   Oil and natural gas is expected to supply 52% of the
                                                                                                                                                                      world’s energy needs in 20401
                        2 000
                                                                                                                                                                  •   Energy demand will be driven by a 19% increase in the
                                                                                                                                                                      world’s population and rising per capita energy use,
                        1 000                                                                                                                                         supporting improved global living standards1

                            -                                                                                                                                     •   Pembina is well positioned to support the growing
                                                                                                                                                                      use of natural gas and natural gas liquids to reduce
                                                                                                                                                                      global emissions
                                Oil     Natural Gas         Bioenergy2          Other              Nuclear             Hydro               Coal
                                                                             Renewables3
                                                                                                                                                                  •   Proximity of Canada’s West Coast to Asia and its
                                7%            29%                34%              345%                23%                37%                12%
                                                                                                                                                                      growing energy demand, represents a strategic
                                                                                                                                                                      opportunity

                                Pembina has, and will continue to, adapt to proudly help provide energy where the world needs it
(1) International Energy Agency (IEA) 2020 World Energy Outlook, Stated Policies Scenario.
(2) Includes energy content in solid, liquid and gaseous products derived from biomass feedstocks and biogas. It includes solid biomass, biofuels and biogases.
(3) Includes geothermal, solar photovoltaics (PV),concentrating solar power (CSP), wind and marine (tide and wave).                                                   See "Forward-looking statements and information“.      12
Advantage Canada
Lower Decline Rates(1) Highly Economic Resource – PIR(2)
2.00x
40% US
Canada 64% of the top
30% 1.75x plays are in
Canada
20%
1.50x
10%
1.25x
0%
1.00x
Cdn Producers U.S. Producers Median
Far East Access Advantage(3) Highest ESG Ranking Among Largest Liquids Producing Countries(4)
100
West Coast US Gulf US Gulf US Gulf US Gulf
of Canada Coast Coast Coast Coast
75
via Panama via Suez via Cape of via Strait of
Canal Canal Good Hope Magellan
50
25
Round Trip 0
Canada US UAE Brazil Russia Iran SA Iraq China
Shipping ~20 Days ~ 50 Days ~ 80 Days ~ 85 Days ~ 90 Days
Days to Asia Yale Environmental Protection Index Social Progress Index
WGI: Regulatory Quality WGI: Rule of Law
Canada is a leading and advantaged supplier of hydrocarbon energy to global markets
(1) Based on the 19 largest Canadian and U.S. producers under Peters & Co coverage. (4) 2020 Yale Environmental Index, 2020 Social Progress Index and Worldwide Governance Indicators (World Bank) Regulatory
(2) Based on Scotiabank’s November 2019 Playbook – Low Oil Price Case – Top plays by profit investment ratio (PIR). Quality and Rule of Law. 13
(3) Based on shipping distances as derived from Platts Portworld shipping distance calculator. See "Forward-looking statements and information“ and “Non-GAAP measures”.ESG highlights
Environmental Social Governance
Carbon Stand: “We are committed to $10 million directly invested in communities in 2019 10 of 11 directors, including Board Chair,
reducing the greenhouse gas emission are independent
intensity in each of our businesses” 32 percent increase in number of Aboriginal
suppliers utilized in 2019 Board oversight of Sustainability through
Enhanced emissions data included in the Governance, Nominating and
2020 Sustainability Report Strong safety culture; zero fatalities in past three Corporate Social Responsibility
years; 24% decrease in contractor injuries1; 64% Committee
Report Scope 1 and Scope 2 decease in employee motor vehicle incidents2
emissions for all owned and operated Appointed General Counsel and Vice
Inclusion & Diversity Stand: “We are committed to President Legal & Sustainability to
assets
diversity, equal opportunity and ensuring that our oversee the development of a new long-
$110 million spent on asset integrity employees have the ability to thrive in an inclusive term sustainability strategy
activities in 2019 environment”
Redesigning short-term incentive plan
Women represent 36% of Board of Directors for 2021 to include significant component
GHG targets in 2021
related to ESG performance
Board and management have committed to
increasing diversity at the executive level by 2025 Board recently approved specific and
aspirational diversity targets under its
Board Diversity Policy
We manage our business in a way that respects all stakeholders
1) 2019 compared to 2018.
2) 2019 compared to 2017.
See "Forward-looking statements and information".
14Sustainability reporting and ratings
• 2020 report includes
over 110 ESG
metrics, which is a
50% increase from
the prior report
• Enhanced
disclosure on
emissions, water,
waste management
and workforce
Click here for the 2020 Sustainability Report
Since 2018, Pembina has been publishing a full-length sustainability report on a biennial basis
See "Forward-looking statements and information". 15Strong financial position
Financial highlights

                                                                                                                                                                                                       ~95% fee-based / ~ 72% take-or-pay,
                                                                                                                                                                                                       contribution to 2020(E) adj. EBITDA(4)
                                                                      3.8-4.0x 2021E Debt/EBITDA(1)                                                     Highly
                Strong BBB                                                                                                                              Contracted;                                    ~75% investment grade, split rated or
                                                                      17-19% 2021E FFO/Debt(2)
                Credit Rating                                                                                                                           Strong                                         secured counterparties
                                                                      $2.6 billion of liquidity(3)                                                      Counterparties                                 Diversified across 200 counterparties;
                                                                                                                                                                                                       Top 20 customers account for 70%

                                                                      Maintained and grown dividend
                                                                      since 1998                                                                                                                       Per share CAGR(5)
                Stable and                                                                                                                                                                               Earnings per share ~9.3%
                                                                                                                                                        10 years of
                Attractive                                            ~60% payout ratio of ACF                                                                                                           Adj. EBITDA per share ~13.0%
                                                                                                                                                        Proven Results                                   ACF per share ~11.0%
                Dividend
                                                                      ~72% payout of fee-based                                                                                                           Dividend per share ~4.2%
                                                                      distributable cash flow

                Long-term strategy and commitment to financial guardrails have driven strong track record of performance
(1) Debt /Adjusted EBITDA calculated as total debt on a proportionately          Poor’s methodology; Debt excludes debt of equity accounted investees and   (4) Figure includes inter-segment transactions.
consolidated basis divided by Adjusted EBITDA; Debt excludes preferred shares.   includes 50% treatment of preferred shares.                                (5) As at year end 2019
(2) Funds from Operations/Debt defined and calculated as per Standard and        (3) Updated as at December 10, 2020.                                       See "Forward-looking statements and information” and "Non-GAAP measures".
                                                                                                                                                                                                                                                17
Diversified and highly contracted
Division Commodity Type
Facilities Pipelines Natural Crude Oil & Fee-for- Take-or-Pay / Cost-
Gas Condensate Service of-Service
~30% ~25%
30% ~40%
Adjusted Adjusted Adjusted
EBITDA EBITDA Commodity EBITDA
Exposed
~5%
YTD 2020 2020(E) 2020(E)
5% 65%
Marketing
& New ~70%
Ventures ~30%
NGL
Pembina’s business is highly diversified and substantially underpinned by fee-based, high take-or-pay contracts
See "Forward-looking statements and information“ and “Non-GAAP measures”. 18Pembina delivers through market cycles
Acquisition Acquisition Acquisition
120 of KML 9
of of Veresen
Provident
6.00
8
100
5.00 7
80 6
4.00
5
60
3.00
4
40
2.00 3
2
1.00
20
1
0.00
(2)
0 2008 2009 2010 2011 2012 2013 2014 2015 2016 2017 2018 2019 2020E 0
Financial Crisis Commodity Price Collapse COVID-19
(1)
Adjusted EBITDA per share Dividend per share WTI AECO(1) Share Price(3)
Disciplined execution continues to deliver long-term results that matter, despite global volatility
(1) Commodity prices use annual average and 2020E utilized CAL 20 (average of YTD actuals and forward contracts as at December 10, 2020. (3) Share price is based on year end closing prices and 2020E utilizes closing price on December 10, 2020.
(2) 2020E is based on guidance included in the Company’s November 5, 2020 press release, Pembina is trending toward the lower end of the guidance See "Forward-looking statements and information" and "Non-GAAP measures". 19
range.Financial Guardrails
2020E 2021E
Maintain target of 80% fee-based contribution to ~94% 90-95%
1
adjusted EBITDA(1)
“Pembina pioneered the
concept of the Financial
~72% 71-75% Guardrails in the midstream
2 TargetCommitment to a strong BBB credit rating
Debt/Adjusted EBITDA(1) Pembina’s current debt maturity profile(4)
x
x 3.75x - 4.25x
x
Senior Debt Revolving Credit Facilities Term Loan
x ~4.0x 3.8x - 4.0x $4,500
x $4,100 MM
x $4,000
2020E 2021E Target
$3,500
Funds from Operations/Debt(2)
5% $3,000
0% 18% - 22%
5% $2,500
$MM
0% 17% - 19%
~16% $2,000
5%
- $1,500
2020E 2021E Target
Debt to Total Capitalization(3) $1,000
0% $500
38% - 40%
0%
$0
0%
2021 2022 2023 2024 2025 2026 2027 2028 2029 2030 -
0% ~39% 39% - 40% 2050
0% › Pembina’s average fixed rate debt tenure is ~13 years with a
- weighted average rate of 4.00%
2020E 2021E Target
Pembina remains committed to prudent financial management & maintaining a strong BBB credit rating
(1) Debt /Adjusted EBITDA calculated as total debt on a proportionately consolidated basis divided by Adjusted EBITDA; Debt excludes preferred shares. (3) Debt-to-Total Capitalization calculation excludes debt of equity accounted investees; Debt excludes preferred shares.
(2) Funds from Operations/Debt defined and calculated as per Standard and Poor's methodology; Debt excludes debt of equity accounted investees and (4) US debt converted at 1.30
includes 50% treatment of preferred shares. See "Forward-looking statements and information" and "Non-GAAP measures".
21Capital investment
Capital Budget (1)
Secured Projects Under Development In-service
($MM) Prince Rupert Terminal
Prince Rupert Export Terminal 1Q 2021 $250
Phase VII 1H 2023 $775
Peace Phase VII, VIII & IX
Empress Co-generation Facility 1Q 2023 $120
Expansions
Projects Underway to be Placed Into Operations in 2021-2023 $1,145
Empress
Capital Budget (1)(2)
Secured Projects Currently Deferred In-service Co-Generation
($MM)
Phase VIII TBD $500
Phase IX TBD $100
Prince Rupert Export Terminal Expansion TBD $175
Early Stage Projects Deferred $775
Total $1,920
Will place an additional $1.1 billion of new projects into service through 1H 2023
(1) Capital budget is shown as net to Pembina unless otherwise noted.
(2) Please see the press release issued on December 14, 2020 for additional details regarding various project deferrals.
See "Forward-looking statements and information”.
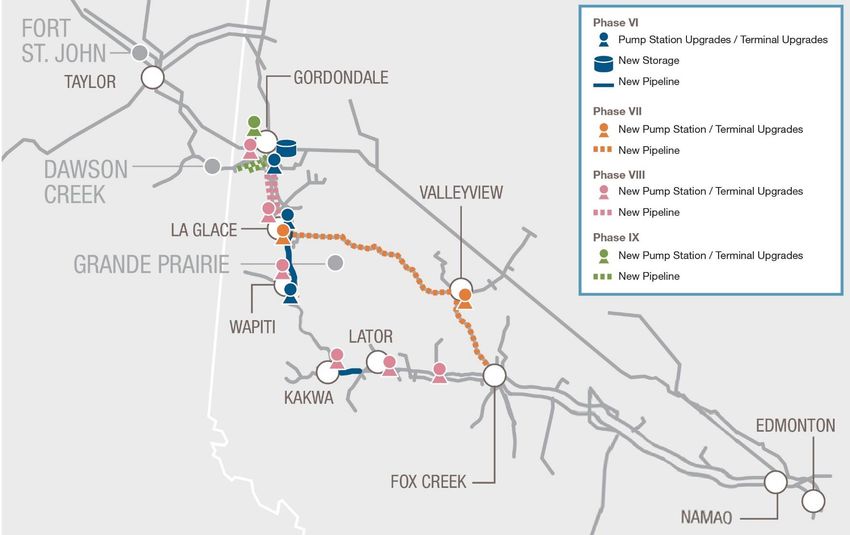
22Phase VII peace pipeline reactivation
• Pembina has reactivated the Phase VII Peace
(In-service)
Pipeline Expansion
› Pembina re-designed the scope of the
project to match customers current
development plans
› Capital cost estimates have been revised
lower, by $175 million, to $775 million
(Currently Deferred)
› The project is backed stopped by long-term,
take-or-pay commitments
(Currently Deferred)
• Recently secured an additional 600,000 net acres
through area-of-dedication agreements (“AODs”)
bringing total AODs to more than two million acres
• Once Phase VII is complete, Pembina will have 1.1
million bpd of Edmonton area market delivery
across the Company’s Peace and Northern pipeline
systems
• Value engineering work for Phase VIII and IX is
ongoing and given strong customer interest,
Pembina expects to make a decision in 2021 to re-
activate these projects
Strategic footprint supports staged expansions, enabling timely and reliable egress solutions for customers
See "Forward-looking statements and information”. 23Significant backlog of opportunities
• Cochin expansion
• Edmonton Terminals
• Jordan Cove LNG
expansion
• NEBC infrastructure
solutions
$6.5 Bn+
• Pipeline laterals and
connections
• Co-generation
• Petrochemical feedstock
solution
• Peace Pipeline Phase VIII $4+ Bn
• Phase VII Peace and IX expansions
Expansion • Prince Rupert Terminal
• Prince Rupert Terminal Expansion
• Empress Co-generation
$0.8 Bn
$1.1 Bn
Secured Secured Uncommitted Value chain
Deferred extension (1)
Over $11 billion of potential capital projects to address base business needs and provide global market access
(1) Illustrative only. Assumes legacy Jordan Cove capital cost disclosure of US$10 billion, FX rate of 1.3 USD/CAD and a 50% ownership stake
See "Forward-looking statements and information." 242021 Adjusted EBITDA guidance range
2021 Adjusted EBITDA Key Contributing Factors
• Marketing & New Ventures Division results at 2020 levels
• Crude, condensate and NGL volumes sustained at 2020 average levels
Low End: $3.2 billion
• Limited or no re-contracting of the Ruby Pipeline firm volume contracts expiring mid-2021
• Limited interruptible revenue on Alliance Pipeline, consistent with 2020
• Recovery of Marketing & New Ventures Division results to more normalized levels in the
historical context of 2018-2020
• Modest growth in crude, condensate and NGL volumes beyond 2020 average levels
• Ruby Pipeline firm volume contract expiries in mid-2021 are re-contracted or otherwise
High End: $3.4 billion replaced with interruptible volumes in excess of current spot rates
• Interruptible revenue on Alliance Pipeline in excess of 2020, but below 2019, levels
• Interruptible volumes in the gas services business in excess of 2020, but below 2019, levels
• Weakening of the Canadian dollar, relative to the U.S. dollar
Pembina expects 2021 adjusted EBITDA of $3.2 to $3.4 billion
See "Forward-looking statements and information” and "Non-GAAP measures".
252021 capital allocation and funding
PRIORITIES FUNDING PLAN(1)
1
Discretionary UPPER END OF GUIDANCE
Maintaining balance sheet Priority to maintain a cash flow
LOWER END OF GUIDANCE
strength strong BBB rating
Growth
capital
2
Maintained and grown
Maintain dividends dividend since 1998
Cash flow
3 Investing in growth
Growth capital projects further
enhances Pembina’s Dividends
capabilities
4
Discretionary cash flow: Based on relative
Debt reduction, dividend increase or risk-adjusted returns
opportunistic share repurchase 2021E
of each
Pembina’s 2021 capital program is fully funded by internal cash flow
(1) Includes capital expenditures, contributions to equity accounted investees, interest on development capital and other cash fl ow from investing activities per the Statement of Cash Flows in Pembina’s financial statements. Cash flow after dividends includes cash flow from operating activities, less dividends on common and
preferred shares, plus proceeds from options, plus changes in cash during the year. As per updated guidance range as at December 14, 2020.
See "Forward-looking statements and information" and "Non-GAAP measures".
26Value proposition
• Diverse and integrated assets, strategically located to serve world-class geology
Leading North
American provider of • Balanced exposure across crude/condensate, natural gas and natural gas liquids value chains
transportation and • Highly contracted business providing low risk, stable cash flow
midstream services
• Leading safety and reliability performance
• Demonstrated commitment to strong BBB credit rating
• Dividend payout of 60% of adjusted cash flow from operating activities
Strong financial
position • 2021(E) capital investment program fully funded by cash flow from operating activities net of
dividends
• Proven track record of resilience through multiple major global headwinds
Positioned for • Operational leverage to rising volumes and commodity prices
recovery • Growing backlog of uncommitted growth projects
• Committed to all stakeholders: Customers, Investors, Employees and Communities
Track record
• 2020 Sustainability Report reflects 110 ESG metrics and provides evidence of our commitment
demonstrates strong
to responsible business practices
sustainability culture
• Formal ESG targets to be released in 2021
Entering 2021, Pembina possesses strong downside protection and positive operating leverage
See "Forward-looking statements and information“ and “Non-GAAP measures”. 27CONTACT US Pembina Pipeline Corporation Suite 4000 – 585 8th Avenue S.W. Calgary, Alberta T2P 1G1 www.pembina.com investor-relations@pembina.com Toll free: 1.855.880.7404 Phone: 403.231.3156
You can also read