Lovisa Holdings Limited (LOV.ASX) - Strawman
←
→
Page content transcription
If your browser does not render page correctly, please read the page content below
2AM Investments Pty Ltd                                                                          28/05/2020

Lovisa Holdings Limited (LOV.ASX)
Throughout the panic of March, the trust was able to build a decent position in a quality, high
margin retailer at what I believed was a very attractive price considering its long-term growth
prospects, cash generative nature and strong brand position. 5.5% of the trusts capital at the time
was used to buy shares in Lovisa at an average cost of $4.08. However, it turns out you could’ve
bought almost any ASX or NZX listed retailer and made decent money through April and May as the
sentiment surrounding the sector as a whole was just that negative. Aside from that remark, this
report will try to lay out the thesis around the investment with as little hindsight as possible.

Disclaimer: None of this should be taken as personal or general financial advice and has been prepared for
informational purposes only.

TLDR (Too Long Didn’t Read) Summary:
   • Lovisa’s high ROIC is a result of a combination of its niche product, high inventory turnover
       and efficient use of store space – Lovisa achieved a ROIC of ~24% in FY19.
   • Highly cash generative business
   • Very high margin brick and mortar retailer, gross margins >75%.
   • Very little direct competition
   • Highly experienced and rational management team
   • Large US market opportunity
   • Potential to double free cash flows within 5 years
   • Throughout the March panic, Lovisa was priced for a high probability of failure (which I
       thought was unlikely).
   • Cost base of $4.08 offered a significant margin of safety and attractive risk-reward ratio for
       investment.

Economics of a great retailer
With that said, I might just begin some general analysis of brick & mortar retailers. As a business
owner will prefer a business that can produce higher profits in relation to the businesses assets and
invested capital, I will use the basic return on asset (ROA) formula for illustrative purposes:

ROA = Net profit margin × Asset Turnover
      NPAT      Sales
ROA =       ×
       Sales Assets

Lets start with the first part of the equation, the profit margin. This is the most well understood part
of the equation and is a general measure of how many cents in each dollar of sales you are
converting to the bottom line on the income statement. For most retailers, this is affected by the
following major costs:
     • Cost of Goods Sold (COGS)
     • Store lease and occupancy costs
     • Employee costs
     • Distribution costs

Depending on the type of product sold, whether cheap fashion jewellery (in Lovisa’s case) or female
clothing “basics”, COGS will differ widely from 20% to 45% of the sale price. For traditional brick &
mortar retailers, store lease costs are a large part of ongoing operational expenditure and thus
makes a large impact on the bottom line. Understandably, the retailer that can buy or produce its

                                                                                                             1
2AM Investments Pty Ltd 28/05/2020
product the cheapest, employ the least amount of people, and have a larger online sales channel,
can maximise its profit margin, and thus, its ROA or ROIC.
The second part of the equation, asset turnover, is what truly separates the great retailers from the
good retailers. In its basic form, the asset turnover ratio shows how many dollars of sales are
produced per dollar of assets in the business. As most brick and mortar retailers assets will usually
comprise of right of use assets relating to stores leased by the business, maximising its asset
turnover comes down to maximising the volume of product sold through its stores.
A business that can produce or source its product quickly, have it on the shelf quickly, and sell it
quickly will have much higher returns on assets and invested capital than an equivalent business
with lower inventory or asset turnover.
Comparison of ASX/NZX retailers
To illustrate the differences in profitability and returns on invested capital of different brick and
mortar retailers, I’ve compiled a table comparing key performance information of a range of ASX and
NZX listed retailers such as Lovisa (LOV.ASX), Michael Hill (MHJ.ASZ), City Chic (CCX.ASX), Premier
Investments (PMV.ASX) and Hallenstein Glassons Holdings (HLG.NZX). The data used was the
financial year of 2019, so as to give a fair comparison untainted by COVID-19.
Figure 1
Michael Hill Premier HLG Holdings
Selected comparable Aus and NZ listed retailers - FY19 Lovisa (NZD) City Chic Investments (NZD)
Avg. sales per store ($000s) 758 1,843 703 906 2,173
Avg. lease costs per store ($000s) 98 196 99 184 266
Occupancy/store sales % 12.9% Insufficient 14.1% 20.2% 12.2%
Occupancy/total sales % - inc. online and other channels 12.9% 10.6% 7.1% 17.9% 10.4%
Online % of total sales 0.0% Insufficient 44.0% 13.4% 15.0%
Asset turnover - inc. ROU assets 1.1x 1.1x 1.3x 0.6x 1.6x
Inventory turnover 2.6x 1.2x 3.6x 2.9x 5.1x
Gross profit margin 80.5% 62.0% 57.8% 61.9% 60.0%
CODB 55.5% 54.6% 42.6% 46.9% 44.2%
EBITDA margin ex. unusual non-cash items 25.0% 7.4% 15.2% 15.0% 15.8%
NPAT margin 14.8% 2.9% 9.6% 8.4% 9.7%
ROA - inc. ROU assets 16.0% 3.1% 12.4% 5.0% 15.3%
ROIC - inc. ROU assets 23.7% 5.3% 27.9% 5.6% 23.2%
All ROA and ROIC calculations in Figure 1 are based on asset bases and capital invested which
includes a crudely estimated right of use asset value based on the AASB 116 Leases disclosure
provided in each businesses recent financial statements, so I wouldn’t take them as gospel.
When compared to the select group of retailers in Figure 1, Lovisa’s business holds up quite strongly,
boasting gross margins in excess of 80%, EBITDA margins of 25%, and ROIC comfortably exceeding
20%. City Chic, with its large online sales channel and capital light “omni-channel” model seems to
also be a standout with a ROIC of 27.9% and EBITDA margin of 15.2%.
However, comparing Lovisa to Michael Hill, you can see the difference in returns of fashion jewellery
vs. mid-range jewellery. Lovisa’s model is essentially “affordable fashion jewellery” in price ranges of
$10-50 with high inventory turnover and store’s jam-packed with products, whereas Michael Hill is
selling lower turnover mainly $150-600 value jewellery with fairly inefficient use of store space. On
stores much smaller than Michael Hills, Lovisa makes around $190k in EBITDA per store vs. Michael
22AM Investments Pty Ltd 28/05/2020
Hill’s ~$140k. It’s easy to see why Lovisa is getting much more bang for buck on its store leases than
Michael Hill, and many other brick and mortar retailers in fact. However, bear in mind these direct
comparisons are only using one year of financial data.
Lovisa Overview & Brief History
Lovisa Holdings is a global fast fashion retailer operating from over 439 stores across 15 countries.
Its target customers are mainly young women ranging from late teens into their early 30’s. Lovisa is
strategically focused on the affordable jewellery segment with over 2,500 jewellery lines per store
priced from A$6.99 to A$49.99. It was founded in 2010 by its CEO and Managing Director, Shane
Fallscheer, and BB Retail Capital, the investment company established by successful retail
entrepreneur Brett Blundy.
Lovisa became one of the core businesses in the BB Retail Capital portfolio after it was recognised
that Lovisa was achieving higher returns on investment than Diva – another fashion jewellery and
hair accessories retailer owned by BB Retail Capital which Shane Fallscheer was CEO of from 2004
until 2008. After a trial conversion of 21 Diva stores to Lovisa, higher returns on investment were
confirmed through the Lovisa brand and by June 2014, a total of 114 Diva stores had been converted
to the Lovisa portfolio.
By its IPO in December 2014, Lovisa had achieved significant scale in its core Australian market, with
a mature network of 157 company owned stores. Since then, Lovisa has entered a new geography
each year, growing ex. Aus/NZ revenues from 13.4% of total revenues, to just under 50% in the
trailing 12 months to December 31, 2019 (T12M) whilst maintaining its position as the leading
affordable jewellery retailer in its home markets.
Figure 2 – Revenue by Geography
Geographical Segment Information
Revenue from stores owned - ($ millions) 2014 2015 2016 2017 2018 2019 T12M
Aus/NZ 91.5 102.2 108.4 122.6 132.0 137.7 142.5
% of total 86.6% 76.5% 71.0% 69.0% 61.3% 55.4% 51.3%
% growth pcp + 11.7% + 6.1% + 13.1% + 7.7% + 4.3% + 3.5%
Asia 9.8 20.8 25.5 28.3 34.6 34.4 33.7
% of total 9.3% 15.5% 16.7% 15.9% 16.0% 13.8% 12.1%
% growth pcp + 111.7% + 22.7% + 11.1% + 22.0% - 0.5% - 1.9%
Africa 4.4 10.7 18.2 21.9 30.5 33.4 36.2
% of total 4.1% 8.0% 11.9% 12.3% 14.2% 13.4% 13.0%
% growth pcp + 145.0% + 70.6% + 20.4% + 39.3% + 9.6% + 8.4%
Europe - - 0.5 4.8 17.9 36.7 48.1
% of total 0.3% 2.7% 8.3% 14.8% 17.3%
% growth pcp + 811.3% + 270.3% + 105.1% + 31.1%
North America - - - - 0.5 6.3 17.2
% of total 0.2% 2.6% 6.2%
% growth pcp + 1146.8% + 171.1%
Total revenue from stores owned 105.67 133.65 152.61 177.62 215.46 248.51 277.80
% growth pcp + 26.5% + 14.2% + 16.4% + 21.3% + 15.3% + 11.8%
Competitive Landscape
Lovisa has benefited from very little direct competition which is why it has operated with such high
margins and returns on invested capital. In Australia, Lovisa’s major competitors in the fashion
jewellery space are Collette, Myers, Ozbling and Adorne. However, Collette and Myers sell more
than just fashion jewellery and will sell handbags, accessories, clothes, etc.
32AM Investments Pty Ltd 28/05/2020
Lovisa on the other hand is solely focused on selling fashion jewellery, an unwavering strategy that
has allowed it to build a reputation for being the “one-stop shop” for fashion jewellery. Need a new
pair of earrings for the party this weekend? Easy, just pop on in to Lovisa.
Similarly, in the US, there are few direct competitors. Most fashion jewellery is either sold online
(Etsy) or sold in department stores such as Nordstrom and Neiman Marcus alongside other products
in an experience similar to Myers.
Therefore, it may be possible at some point that some well-financed private equity backed
competitor could come along and try to replicate Lovisa’s model, eating away at Lovisa’s margins.
However, that would be a very difficult task and would require a very large amount of capital.
Interestingly, Collete, which has 140 stores in Australia, entered into voluntary administration in
February 2020 before the COVID-19 crisis was in full swing due to “poor trading conditions” and a
debt-refinancing deal gone wrong. There is probably not much to infer from this regarding any
changes in Lovisa’s competitive position as Collete will likely trade on with new owners, however it
does show how powerful Lovisa’s niche product focus is for its bottom line. Ironically, Collete was
founded by Collete Haymen who also founded and managed Diva before selling it to Brett Blundy in
2007.
Economic Moat
It is well-known that retail businesses have some of the thinnest “economic moats” or competitive
advantages out of all the different types of businesses. Customers can be fickle and fad products can
be discarded quite quickly when it is no longer popular.
In my opinion, I do believe Lovisa has some form of economic moat, however it is at best thin and
shallow. This moat is comprised of three key advantages; brand, bargaining power with suppliers,
and its large store footprint.
The brand, as discussed before, is possibly its most important asset. In Australia, its brand has been
highly successful with Lovisa being a household name amongst young urban women. Lovisa
maintains this brand and relationship with its customer largely through social media engagements.
To ensure that Lovisa maintains their brand position and the satisfaction of its customers, they boast
a product team of 20 strong that is led by Andrea Hayes, who has been with Lovisa since it was
founded over 10 years ago, that is continually designing new products and reacting to changes in
customer preferences.
In combination with its large store footprint, Lovisa can remain at the top of the customer’s mind
when it comes to affordable fashion jewellery. This is because customers can be confident that if
they need to get a new pair of earrings for Splendour for example, you could be nearly anywhere in
Sydney and be close to a store. Same with Brisbane, Melbourne, etc. The customer doesn’t have to
waste time at a shopping centre searching for a comparable product when they know that there is a
high probability that there is a Lovisa store there.
Lovisa’s scale also provides it with other benefits that provide a barrier to new entrants. The most
obvious example is that its large store footprint is very hard to replicate and requires a large capital
investment. Although this is a barrier for brand new entrants and not so much for existing retail
businesses with a large store footprint that could position their brand and product offering to
compete with Lovisa.
42AM Investments Pty Ltd 28/05/2020
Lovisa’s scale may also provide it with negotiating leverage with suppliers and is possibly
responsible for achieving gross margins over 75% for many years now. However, this benefit could
also be materially reduced if a large competitor negotiated with the same suppliers for the same
products at lower prices as there does seem to be decent wiggle room between gross margins of
80% and the customary 60% that most retailers have.
Competence of Management/Capital Allocation
Warren Buffet has harped on at length in his annual reports to Berkshire Hathaway shareholders
about the importance of finding “managers who think like owners”. With Lovisa, I think we are
blessed with just that. Shane Fallscheer has been at the helm of this business since he founded it in
2010 after pitching the idea to Brett Blundy, whom he has had a long and successful working
relationship with since starting as music store manager for Brett Blundy’s Sanity business in 1991.
Fallscheer’s idea of Lovisa reportedly came from a concern about the typical customer of Diva, which
was young girls relying on their parents income. Blundy backed his idea and made Fallscheer a 15%
partner in the new business. And the rest is history.
With regards to this partnership, Fallscheer was once quoted saying “there was enough money on
the table to keep you awake at night if things didn’t go well. Brett’s a believer that if there’s skin in
the game then the behaviours are very different to someone who’s a salaried employee.”
BB Retail Capital, Brett Blundy’s investment company, still owns over 40% of Lovisa’s issued capital
and it is one of the crowned jewels in his portfolio. Brett Blundy is an incredibly experienced retail
operator and has a wealth of knowledge and capabilities that very few do. Brett Blundy, along with
his large interest in the business, has stayed on as Chairman of the Board at Lovisa which is exactly
where we want him to be!
Consequently, what’s good for Shane Fallscheer and Brett Blundy will ultimately be good for us as
long-term shareholders.
It’s all well and good to have management aligned with the shareholders, but can they rationally
allocate and invest capital? One exercise that speaks volumes for the management of a business is to
go back and see what they promised several years ago and see how that compares with what has
been achieved since.
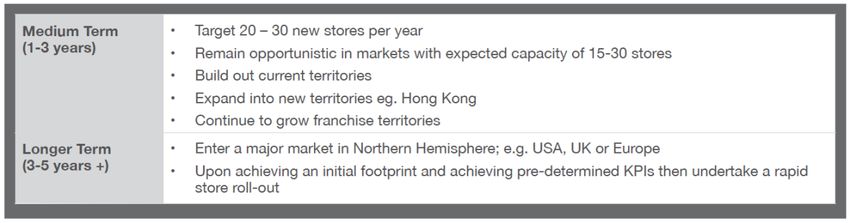
In Lovisa’s prospectus issued prior to listing in 2014, Lovisa’s growth strategy was outlined quite
clearly. Its strategy centred around mainly mid-term (1-3 years) and longer term (3-5 years)
objectives.
Source: Lovisa Prospectus 2014
The continued international store roll-out was identified as the key driver of future growth. This is, in
my opinion, a very important direct quote from Lovisa’s prospectus: “It’s (Lovisa’s) success to date
has been underpinned by its ability to remain nimble and opportunistic in expanding and moving to
52AM Investments Pty Ltd 28/05/2020
new markets. The intention is to continue this as a listed company, such that if opportunities arise, it
may accelerate its plans to enter a new market or continue to grow an existing market. Likewise it
will defer its entry into a new market if it considers that appropriate opportunities aren’t presented
at the relevant time” (emphasis added).
Lovisa targeted 20-30 new stores per annum in the 1 to 3 years following 2014 with an initial focus
on the Asian and South African markets. What happened over the following period? Lovisa opened
up an average of 26 new stores per year to 2017, including the closure of 20 Australian stores in
2015. Big green tick there.
What happened with Lovisa’s longer term objectives of entering a major market in the Northern
Hemisphere? Well, its safe to say Lovisa has well and truly achieved that with further growth yet to
come! The UK market was entered first, where 3 stores in 2016 turned to 42 stores at the end of
December 2019. New stores were also opened in France and Spain, however there is yet to be any
major success there. Last but definitely not least, Lovisa entered the US market in 2018, ending
FY2018 with a mere single store. At the end of Dec 2019, that number now stands at 40. Another big
green tick there.
However, when analysing store roll-out businesses, one must be cognisant that aggressive growth
doesn’t come at the cost of a poor bottom line and business KPIs. Too often, management teams will
promise and deliver huge growth numbers to the top line to get investors excited and pump up the
stock price. This can sometimes lead to poor long-run outcomes for shareholders and even
fraudulent management behaviour. Just look what happened with the recent Wells Fargo account
fraud scandal… (On a side note, I highly recommend watching Senator Elizabeth Warren’s brutal
2016 interrogation of former Wells Fargo CEO John Stumpf on YouTube).
Going back to Lovisa’s aggressive store roll-out strategy, I believe management have been measured
in their approach and are not trying to achieve a short term “guidance beat”. The bottom line speaks
for itself, whereby investments relating to new stores have been funded purely from cash flows from
existing and profitable stores, without the need for new equity capital.
Here is an excerpt from Ophir Asset Management’s “Offshore Growers Report” regarding expanding
business offshore:
Lovisa’s Fallscheer says that the key is to “move in slowly and allow yourself to learn from
your mistakes”. He says the biggest mistake going global is “letting ego get in the way”. “It’s
not about flagship stores,” he says. “You can’t take the eye off the end goal – profitability.”
(emphasis added)
Additionally, management has been very transparent to shareholders whereby they have detailed in
great length Lovisa’s business economics, key facts about their supply chain and products, and risks
to the business in every annual report since the prospectus.
Considering all of the above, I am quite confident that Lovisa is in capable hands.
62AM Investments Pty Ltd 28/05/2020
Cash flows and owner earnings
Lovisa is a highly cash generative business, posting very high returns on invested capital despite
general headwinds to the brick and mortar retail industry. As mentioned earlier, Lovisa’s store roll-
outs have been funded by the profits of its existing store network and not from the issuing of new
debt or equity. Even in Lovisa’s 2014 IPO there was no new equity issued.
Lovisa's cash metrics 2014 2015 2016 2017 2018 2019
CFOBIT / EBITDA 108.7% 83.3% 107.1% 108.9% 104.1% 107.1%
FCF / NPAT 115.3% 69.3% 83.5% 106.1% 90.9% 61.9%
CapEx / Depreciation expense 109.7% 113.4% 157.6% 158.9% 214.4% 245.3%
The cash flow conversion check is passed with flying colours with CFOBIT (cash flows from
operations before interest and tax payments) averaging over 103% of EBITDA from years 2014
through to 2019.
Free cash flow conversion - Lovisa
40.0 160.0%
35.0 140.0%
30.0 120.0%
NPAT conversion to FCF %
25.0 100.0%
$ millions
20.0 80.0%
15.0 60.0%
10.0 40.0%
5.0 20.0%
0.0 0.0%
2014 2015 2016 2017 2018 2019
Free cash flows NPAT NPAT conversion to FCF %
Due to management re-investing large amounts of retained earnings in further store roll-outs over
the last six years since IPO, free cash flows have lagged that of Lovisa’s NPAT. Despite this, Lovisa’s
free cash flows including all capital expenditures averaged around 87% of NPAT. As Lovisa is still in
its growth phase, I expect it’s capital expenditures to continue to materially exceed its depreciation
expenses, however, as the business matures and store growth slows, this trend will likely reverse
and cash will build far more quickly than what the income statement might suggest.
Liquidity & Balance Strength
In mid to late March when the trust bought Lovisa there were legitimate concerns surrounding brick
and mortar retailers and their ability to survive the COVID-19 crisis and an a potentially extended
period with no revenues. Due to social distancing measures and fears of catching or spreading the
virus, store foot traffic materially declined leading many retailers, including Lovisa, to close their
stores. Additionally, Lovisa’s China-based supply chain had been experiencing delays due to the
72AM Investments Pty Ltd 28/05/2020
COVID-19 outbreak in China and widespread lockdowns which added to concerns for Lovisas ability
to generate revenues because of their 8-10 week stocking cycle.
As at the 31st of December 2019, Lovisa had $27.8m in cash and equivalents on its balance sheet.
However, it also had $15.2m in revolving cash advance and trade finance facilities maturing within
the year as well as lease liabilities of $36.2m to pay over the following year. In addition, Lovisa had a
15c interim dividend distribution per share, amounting to $15.9m, payable by the end of April. With
a looming period of no revenues for potentially 6-12 months, Lovisa’s liquidity position was looking
somewhat precarious.
However, my concerns for this balance sheet risk were eased materially upon Lovisa’s business
update on 26/03/2020 that, in an effort to reduce costs and improve the business’s liquidity position
they had announced the following key changes:
• The standing down of store teams in markets with store closures, temporary redundancies,
etc– materially decreasing cash outflows relating to employee salaries.
• Deferral of the $15.9m dividend payment, improving the near-term cash requirements.
• Maturity of the $15.2m financing facility had been extended for a further 3 years and the
limit had been increased, materially improving the liquidity position.
Additionally, if all else failed, I was reasonably confident that BB Retail Capital would provide the
business with a working capital injection to get it through “to the other side” given Lovisa is arguably
the crown jewel of its portfolio.
Looking Ahead
Once I was comfortable with Lovisa’s ability to survive the COVID-19 crisis, I looked to the longer
term in order to conservatively estimate future cash flows. With the US market still relatively
untapped with regards to a focused, low cost, fashion jewellery retailer, I believed that Lovisa still
had a very significant store roll-out opportunity ahead of it.
In the mature Australian market, Lovisa had 155 stores at the end of Dec 2019, which is 6.2 stores
per million in population. As the US has a relatively similar competitive landscape to Australia with a
lack of direct competition to Lovisa, it would not be too unreasonable for Lovisa to achieve the same
level of market penetration in the US. Even if you apply 2 stores per million to the US population of
approximately 320 million, you get to 640 potential Lovisa stores, which at approximately $190k
EBITDA per store, could be worth a whopping $122 million in EBITDA from the US market alone. This
is nearly double that of Lovisa’s 2019 EBITDA.
However, as you’ll see in the next section, I didn’t need anywhere near 600 new stores to justify my
valuation.
Valuation
To value Lovisa, I decided to primarily use a 5-year DCF model with a terminal value calculation at
FY2025. Yes I know what you’re thinking, “a minor change in WACC or terminal growth rate can
widely change the valuation, blah blah blah…”
However, I believe that if you use conservative enough assumptions, discounted cash flow analysis
can be a very valuable tool for valuation and for seeing how the economic value of the business
changes in response to changes in certain key variables.
As the key driver of Lovisa’s future cash flows is new stores, conservative assumptions needed to be
made regarding change in stores over the next 5 years. Instead of the potential 600 additional US
82AM Investments Pty Ltd 28/05/2020
stores, I assumed that new stores increased by only 85 until maturity of the business, waaaaay
below the potential market opportunity.
To be able to reliably estimate the future cash flows available from those new stores, I had to go
back over Lovisa’s operating history and analyse its operating costs and per store metrics. Below is a
table showing each major operating cost as a percentage of sales:
Lovisa's Cost of Doing Business
Operating costs as % of sales 2014 2015 2016 2017 2018 2019
COGS 23.9% 22.9% 26.0% 21.2% 20.0% 19.5%
Salaries and employee benefits expense 29.2% 26.2% 26.1% 25.3% 25.6% 26.5%
Property expenses 19.6% 17.3% 16.9% 16.0% 16.0% 17.0%
Distribution costs 0.0% 0.0% 2.8% 2.5% 3.3% 3.5%
Other expenses 11.8% 10.6% 8.4% 8.6% 8.1% 8.4%
CODB 60.6% 54.0% 54.2% 52.5% 53.0% 55.5%
Operating expenses / sales % 84.5% 77.0% 80.2% 73.7% 73.0% 75.0%
Lovisa’s major costs of doing business such as employee remuneration and property expenses seem
to be relatively constant at 26% of sales and 17% of sales respectively. Distribution costs relating to
air-freighting stock to stores from its warehouses in China and Melbourne come in at around 3.5% of
sales.
Lovisa per store metrics ($000s) 2014 2015 2016 2017 2018 2019
Revenue/store
Aus/NZ 508.4 638.8 669.1 752.0 772.0 782.3
Asia 577.4 692.7 772.7 708.0 803.7 799.8
Africa - - 505.1 437.9 544.6 547.8
Europe - - 353.3 644.0 831.8 852.8
North America - - - - - 634.6
Average revenue/store 551.8 615.9 663.5 711.9 760.0 757.7
Salaries and employee benefits expense - DIRECT 161.0 161.8 173.8 181.5 195.8 202.3
Property expenses - Indirect but fixed 108.4 107.2 112.5 115.0 122.4 129.8
Distribution costs - DIRECT - - 18.9 17.9 25.4 26.8
Other expenses - DIRECT 65.3 65.3 56.3 61.6 61.8 64.4
Salaries and employee benefits expenses per store were assumed to be approximately $138k for the
calendar year 2020, which is a reduction of only 31% on 2019 figures. In reality I knew that they
would reduce employee expenses a lot more than this but I wanted to be on the conservative side to
see what Lovisa could withstand.
As nearly 90% of the DCF valuation came from the terminal valuation at 2025, those assumptions
were the most important and will had the largest impact on the valuation. The 2025 key
assumptions were as follows:
Revenue per store $ 755k
Gross margin % 79.0%
Lease & property expenses $ 125k per store
Salaries & employee expenses 26.5% of revenue / $ 200k per store
Distribution expenses 3.5% of revenue / $ 26.4k per store
Other expenses 8.5% of revenue
Capital expenditures per new store $ 450k
92AM Investments Pty Ltd 28/05/2020
(Note that the CapEx assumptions are much higher than in reality and should be more in the vicinity
of $150-200k but that’s what I used in the model).
Discounting the future cash flows back to the present date (assumed 31/12/19) by a cost of capital
of 9% (an arbitrary number I pulled out of thin air that is well above the current near-zero risk-free
rate), I had a conservative valuation of $ 5.21 per Lovisa share.
NPV 579.9
Less: Borrowings (15.2)
Add: Cash 27.8
Equity Value 592.4
Diluted shares outstanding 113.6
Value/share $ 5.21
Discount rate 9.0%
Terminal growth rate 0.5%
The 2AM Investment Trust’s cost base of $4.08 per Lovisa share offered an additional 22% margin of
safety on an already very conservative valuation of $5.21.
For those of you who like multiples, the cost base of $4.08/share represented a trailing 12 month PE
ratio of approximately 12.1x. For a company with a high quality owner-oriented management team,
competitive position in a niche market, very high ROICs and the potential to conservatively double
its free cash flows within 5 years, I believed the March COVID-19 panic caused Lovisa to trade at an
extremely compelling valuation offering a very attractive risk-reward ratio for investment.
Closing remarks
Upon building the 5.5% Lovisa position in the trust, I wrote down the following “thesis-breakers”
that would cause me to reassess the valuation and most likely sell:
• US market opportunity turns out to be far less attractive than I had estimated due to any
combination of factors relating to the US economy, rise of US-based direct competition, etc.
• Global shut-down due to COVID-19 for longer than 12 months causing insolvency risk for
Lovisa to be materially higher than expected.
• Any whiff of a potential modern-slavery scandal relating to Lovisa’s suppliers based in China,
India and Thailand.
Now switching back to the hindsight provided by my writing of this at the end of May in 2020, it
seems that thesis-breaker two is looking less and less likely as governments around the world have
implemented measures to reduce the spreading of the coronavirus quickly and allow the reopening
of many businesses. Out of all the developed nations, the US seems to be suffering from the highest
number of cases, however they are defiantly opening up their economy. If the US does suffer a
prolonged economic downturn, I believe that Lovisa will still be able to perform strongly given its
geographic diversification and it may even provide an opportunity to expand its US stores with even
less competition.
Markets currently seem to be quite optimistic about Lovisa’s future, a severe contrast to March’s
sentiment, and as I write Lovisa is trading at $8.60 per share, up 111% on the trusts cost base. This
represents a diluted market cap of $977 million and a trailing 12 month PE ratio of 26 times.
102AM Investments Pty Ltd 28/05/2020
Considering the potential risks to Lovisa’s business, I can’t comprehend how anyone could justify
paying current prices. I guess the TINA rhetoric has gotten pretty strong…
In any case, the trust will not sell its position unless any material changes to the business occur, and
we aim to reap significant returns in line with Lovisa’s business performance for years to come.
Brock McCamley
2AM Investments Pty Ltd
brockamccamley@gmail.com
112AM Investments Pty Ltd 28/05/2020
Appendix
Lovisa Key Metrics at Average Cost
Market Prices
Average price of position in LOV.ASX shares $ 4.08
12 mth range $2.34 - $14.13
Company Data & Ratios
Issued capital (no. common shares) 113.6m
Market cap $ 463.6m
Net debt $ 142.7m
Enterprise value (inc. impacts from IFRS16) $ 606.3m
PE (T12M) 12.1x
EV/EBIT (T12M) 10.7x
Price to FCF (T12M) 30.9x
PE (FY20) - estimated 549.6x
FCF yield (T12M) 3.2%
Dividend yield 8.1%
5 yr NPAT CAGR to FY19 19.8%
FY19 ROE 79.9%
FY19 ROA 16.1%
FY19 ROIC 23.7%
*All figures are in AUD millions
Lovisa Base Case DCF Assumptions
Lovisa DCF Base Case Assumptions 2018A 2019A H1FY20A H2FY20F 2021F 2022F 2023F 2024F 2025F
New stores 37 52 42 5 (10) - 60 30 -
Revenue/store ($000s) 760 758 431 100 350 600 750 750 755
Gross margins 80.0% 80.5% 78.9% 75.0% 77.0% 78.0% 78.0% 79.0% 79.0%
Lease & property expenses/store ($000s) 122 130 49 65 125 125 125 125 125
Salaries & employee benefits % of sales 25.6% 26.5% 24.1% 50.0% 32.5% 30.0% 26.5% 26.5% 26.5%
Distribution expenses % of sales 3.3% 3.5% 2.9% 4.0% 4.0% 3.8% 3.5% 3.5% 3.5%
Other expenses % of sales 8.1% 8.4% 7.3% 8.5% 8.5% 8.5% 8.5% 8.5% 8.5%
Tax rate (% of PBT) 30.0% 30.0% 30.0% 30.0% 30.0% 30.0% 30.0% 30.0% 30.0%
Capital expendiure/new store ($000s) 416 463 471 450 450 450 450 450 450
12You can also read