EUROPEAN RETAIL IN 2018 - GFK STUDY ON KEY RETAIL INDICATORS: 2017 REVIEW AND 2018 FORECAST
←
→
Page content transcription
If your browser does not render page correctly, please read the page content below

Geomarketing

     EUROPEAN
     RETAIL IN 2018
      GfK study on key retail indicators:
      2017 review and 2018 forecast

               EUROPEAN RETAIL IN 2018 | across-magazine.com/gfk2018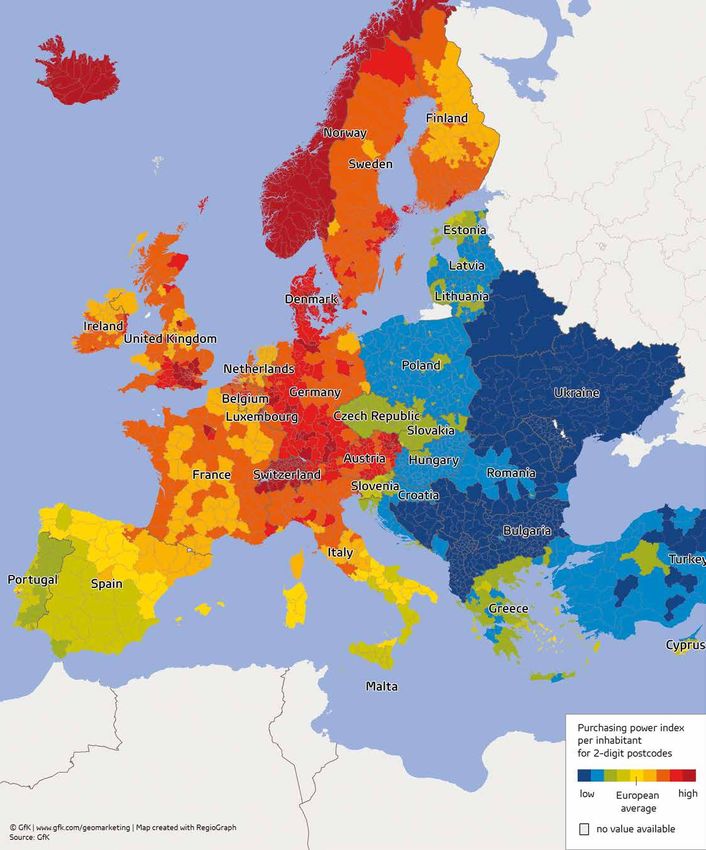
Geomarketing

EDITORIAL
Dear readers,

“No man is an island,” wrote the English poet John    Our study also examines the development of key
Donne in 1624. What is true for individuals is also   retail indicators for 32 European countries. For
true for economies.                                   the first time, we include a section on Europe’s
                                                      fashion retail segment, which faces threats from
The European economy faces major changes due          e-commerce, among other things.
to Brexit in addition to various economic and
political challenges. The potential impact of         We invite you to use our study as support for your
Donald Trump’s “America First” policy is one          strategic retail decisions, whether as an investor,
example. Existing international trade agreements      retailer or project developer.
are threatened by the USA’s announcement to
impose punitive tariffs on aluminum and steel in      Kind regards,
response to national security concerns. This
situation is creating anxiety about a trade war,
which would have a significant economic impact
on both sides of the Atlantic.

Despite these uncertainties, all European coun-       Dr. Johannes Schamel
tries experienced economic growth in 2017.            Study lead
                                                      Geomarketing, GfK
This robust increase in private consumption
contributed to a positive development of the
macro economic conditions, which allowed
stationary retail to compensate for market share
losses to online trade. Adjusted for inflation,
most EU-28 countries experienced an increase
in retail turnover.
                                                                      Contents
As in previous years, central and eastern Euro-
pean countries topped the rankings. A case in                         Purchasing power in 2017
point is Hungary, which is our focus country this
year. In the chapter devoted to this country, we                      Stationary retail turnover in 2017
assess how regulatory conditions affect retail
development in Hungary’s dynamic market.                              Retail turnover for fashion in 2017

                                                                      Prognosis of stationary retail turnover in 2018

                                                                      Consumer price trends from 2017 to 2018

                                                                      Retail share of private consumption in 2017

                                                                      Sales area provision in 2017

                                                                      Sales area productivity in 2017

                                                                      Special focus country: Hungary

                                                                      About GfK

                                                                      across-magazine.com/gfk2018 | across-magazine.com/gfk2018
                                                                                                    EUROPEAN RETAIL IN 2018 | EUROPEAN RETAIL IN 2018 | 2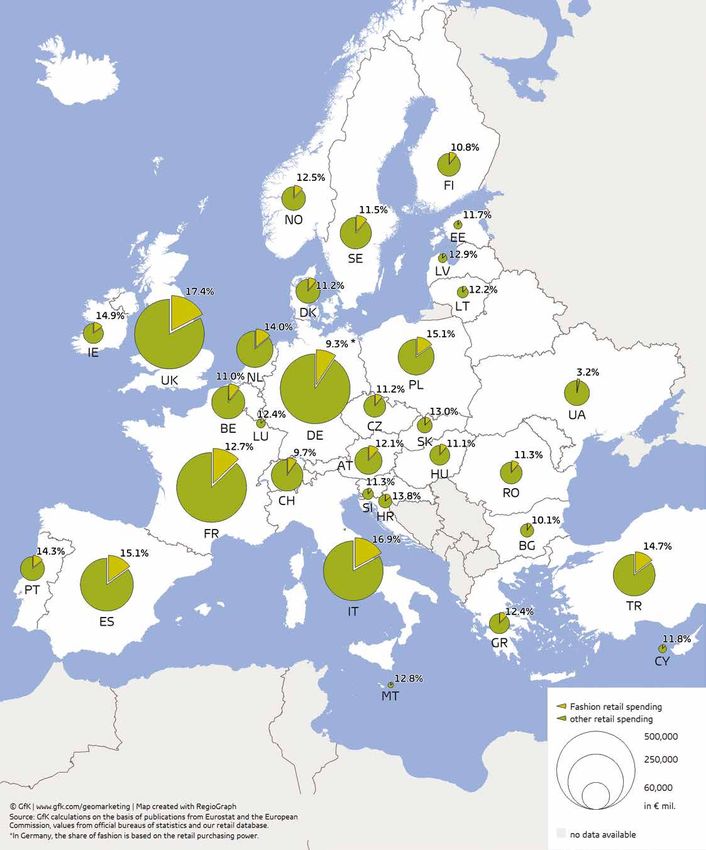
Geomarketing

PURCHASING POWER IN 2017
Slight increase in nominal purchasing power*

+1.9%
                               From an economic perspective,                           Wealth disparities within individual countries are
                               the past year was relatively                            especially clear when evaluating purchasing power
                               calm. Despite the Brexit nego-                          distribution on detailed regional levels. For ex-
                               tiations, the European economy                          ample, with €12,473 per person, Poland’s capital
                               experienced an upturn, which                            city of Warsaw has a higher purchasing power
more per-capita                was due in part to moderate in-                         than Spain’s Andalusian region (€10,985). This is
                               creases in private consumption.                         the case even though Spain’s average per-capita
purchasing power in            In 2017, each citizen of the EU-                        purchasing power is more than twice as high as
the EU-28                      28 countries had an average                             Poland’s.
                               purchasing power of €16,436.
             This equates to a nominal increase of 1.9% com-
             pared to the previous year.                                               Per-capita purchasing power (EU-28)

                              Among the EU countries, only Great Britain               €16,500
                              (-1.5%) underwent a purchasing power decline,
                              which is partly a result of the devaluation of the
                              British pound. Great Britain aside, the momen-
                              tum from previous years continued, resulting             €16,250
                              in above-average growth rates, particularly for
                              central and eastern European countries. Roma-
                              nia (+7.8%) had the greatest gain in purchasing
                                                                                       €15,000
                              power. But this country’s low per-capita purchas-
                              ing power (€4,556) demonstrates the persisting                             2015            2016            2017
                              immense gap in wealth levels across Europe.

                                                                                       *Purchasing power corresponds to the population’s disposable
                                                                                       net income, including government subsidies such as pen-
                                                                                       sion payments, unemployment assistance and child benefit.
                                                                                       The population uses its purchasing power to cover expenses
                                                                                       related to food, accommodation, services, vacations, insurance,
                                                                                       private pension plans and retail purchases. Purchasing power is
                                                                                       a prognosis and is provided in nominal euro values. Comparison
                                                                                       figures from previous years are based on revised values.

                               EUROPEAN RETAIL IN 2018 | across-magazine.com/gfk2018
3 | EUROPEAN RETAIL IN 2018 | across-magazine.com/gfk2018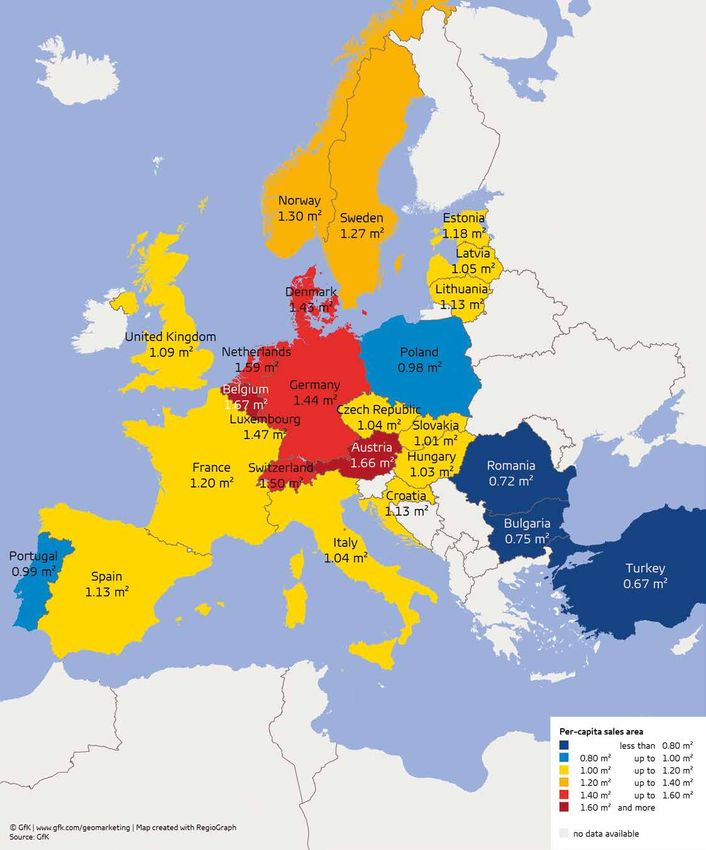
GfK Purchasing Power Europe, 2017

                                    across-magazine.com/gfk2018 | across-magazine.com/gfk2018
                                                                  EUROPEAN RETAIL IN 2018 | EUROPEAN RETAIL IN 2018 | 4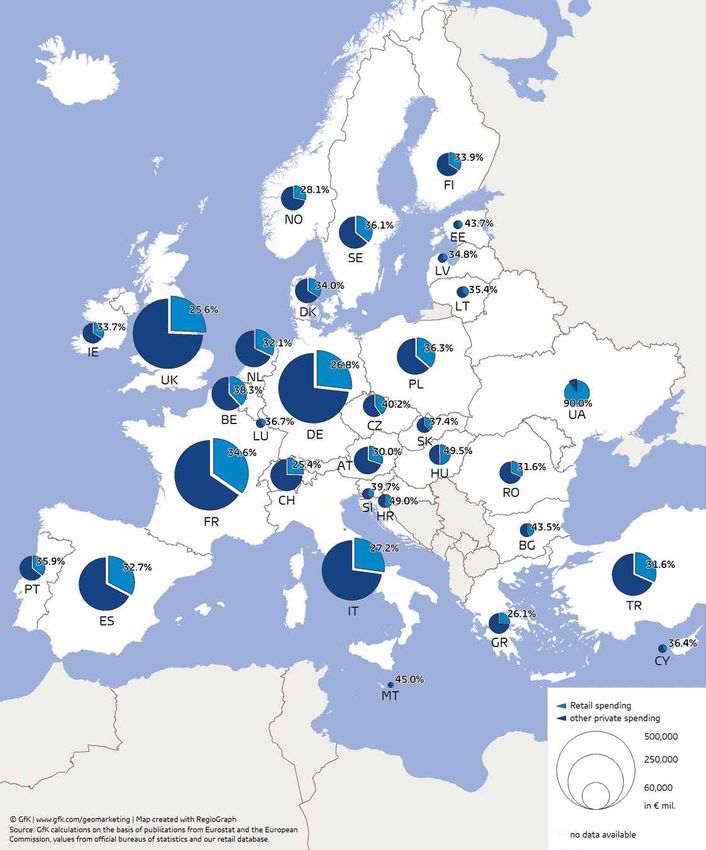
Geomarketing

STATIONARY RETAIL TURNOVER
IN 2017
Due to exchange rate effects, Great Britain slowed turnover
growth in the EU-28.

                                                                                                                 +1.8%
The outcome of the presidential election in France                          On the whole, develop-
in May 2017 can be interpreted as a rejection of                            ments in retail turnover at
protectionist policies and a vote for structural                            the country level reflect
reform. France’s economic recovery was actually                             an increasing convergence,
already underway, which has positively impact-                              which can also be ob-
ed private consumption. Stationary retail turn-                             served more broadly across       growth in store retail
over also grew nominally in the election year by                            Europe’s entire economy.
+3.5%*, which translated to real-value gains for                            Along these lines, certain
                                                                                                             in the EU-28 (with the
Europe’s most important retail market.                                      central and eastern Euro-        UK excluded: +3.0%)
                                                                            pean markets experienced
The positive development was by no means limit-                             dynamic growth despite
ed to France. Many European countries benefited                             generally decreasing populations. The Czech Re-
thanks to still lax interest rate policies. The 28                          public (+9.8%) and Romania (+9.3%) lead the pack
EU nations experienced a retail turnover increase                           with almost two-digit growth rates and moderate
of +1.8%. Due to currency exchange rate effects,                            inflation. Poland (+8.9%) and Hungary (+8.0%)
Great Britain underwent a turnover decline of                               also underwent significant increases in stationary
-4.2% in euros. Had this not happened, Europe’s                             retail volume.
retail gains would have been even higher.

Along with France and Great Britain, the most                               Stationary retail turnover (EU-28)
important markets in terms of turnover volume
developed heterogeneously: Stationary retail                                €2.56 trillion
turnover increases in Germany (+1.0%) and Italy
                                                                            €2.54 trillion
(+1.9%) were below or near inflation. By contrast,
Spain had real-value turnover increases (+3.0%)                             €2.52 trillion
thanks to the ongoing economic recovery and
                                                                            €2.50 trillion
associated decreases in unemployment.
                                                                            €2.48 trillion
*All rates are based on nominal values, meaning they have not been                                2015           2016   2017
adjusted for inflation.

                               EUROPEAN RETAIL IN 2018 | across-magazine.com/gfk2018
5 | EUROPEAN RETAIL IN 2018 | across-magazine.com/gfk2018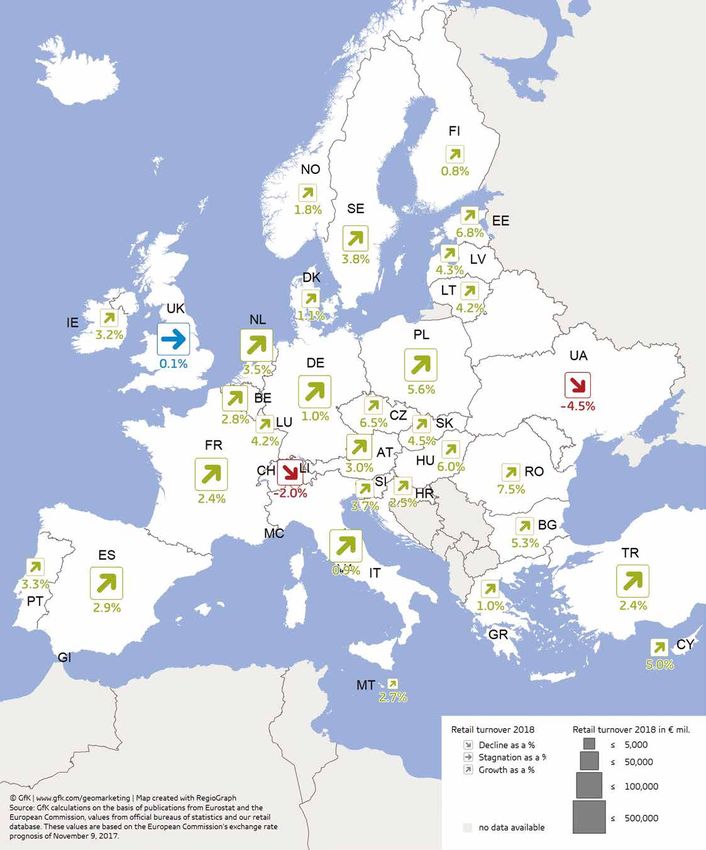
2017 turnover growth in stationary retail compared to previous year (EU-28)

                                  in €                                                                                  in national currency
                                                                                 EU-28

                                          2.9%                                    Austria                                   2.9%
                                  0.9%                                            Belgium                        0.9%
                                                  4.7%                            Bulgaria                                             4.7%
                                                                7.9%              Croatia                                                            6.9%
                                                      5.2%                         Cyprus                                                 5.2%
                                                                   9.8%       Czech Republic                                                         7.0%
                                  0.9%                                           Denmark                        0.8%
                                                      5.0%                        Estonia                                                 5.0%
                                       2.4%                                       Finland                                2.4%
                                          3.5%                                     France                                       3.5%
                                  1.0%                                           Germany                        1.0%
                                  0.8%                                             Greece                       0.8%
                                                                   8.0%          Hungary                                                              7.2%
                                            3.4%                                   Ireland                                      3.4%
                                     1.9%                                            Italy                             1.9%
                                                              7.0%                  Latvia                                                           7.0%
                                                              7.1%               Lithuania                                                           7.1%
                                                3.8%                           Luxembourg                                        3.8%
                                                        5.7%                        Malta                                                     5.7%
                                               3.4%                            Netherlands                                      3.4%
                                                                     8.9%          Poland                                                        6.3%
                                                   4.8%                          Portugal                                              4.8%
                                                                       9.3%      Romania                                                                        11.3%
                                                                   7.9%           Slovakia                                                              7.9%
                                               4.4%                               Slovenia                                           4.4%
                                           3.0%                                     Spain                                   3.0%
                              0.1%                                                Sweden                             1.8%
    -4.2%                                                                     United Kingdom                            2.5%

   -6%        -4%     -2%    0%     2%      4%         6%      8%     10%                                0%         2%          4%         6%          8%      10%      12%

                                                              1.5%               Norway                             1.9%
                                                       0.1%                    Switzerland                           2.1%
              -8.7%                                                              Turkey                                                                            12.6%
                                                                    2.7%        Ukraine                                                              8.8%

  -10%        -8%      -6%    -4%        -2%      0%          2%       4%                                 0%           3%            6%           9%         12%        15%

source: GfK

                                                                                         across-magazine.com/gfk2018 | across-magazine.com/gfk2018
                                                                                                                       EUROPEAN RETAIL IN 2018 | EUROPEAN RETAIL IN 2018 | 6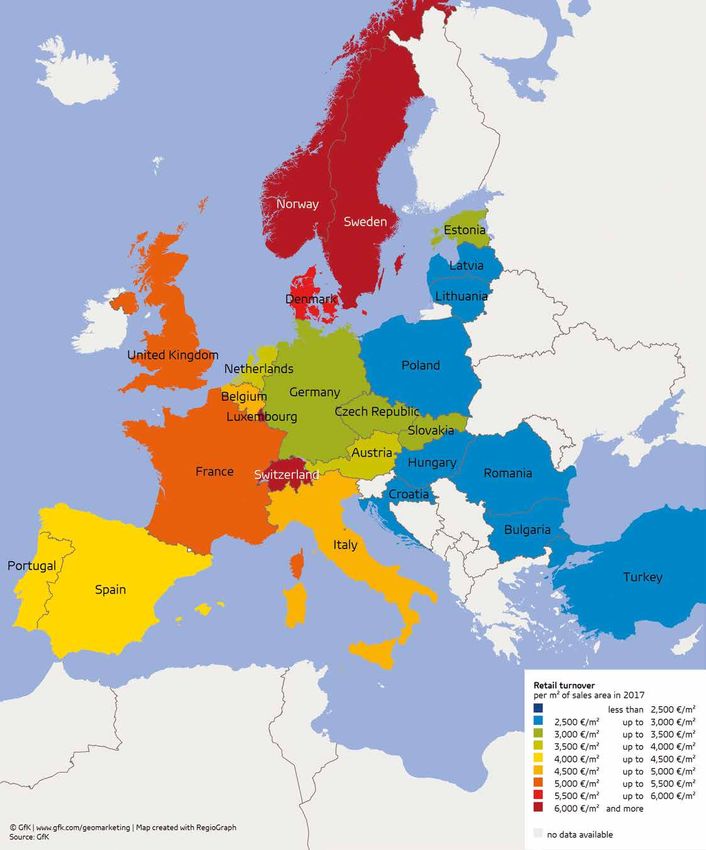
Geomarketing

RETAIL TURNOVER FOR FASHION IN 2017
Price pressure not just due to online trade                                                          In contrast to the three previously mentioned
                                                                                                     southern European countries, which have only

13.5%
                                                                                                     one-digit online shares of the total fashion market
                                                           Stationary retail and particularly        (online and offline), more than one-fourth of Great
                                                           fashion retail are under pres-            Britain’s fashion turnover is generated online.
                                                           sure from e-commerce, off-price           Among the large western European markets, the
                                                           concepts, vertically integrated           British have the second-highest affinity for online
                                                           manufacturers competing for end           purchases of clothing and shoes.
share of fashion in                                        customers as well as rising rents in
                                                           sought-after locations.                   Germans lead the pack, although insights from
stationary retail                                                                                    GfK’s fashion consumer panel* reveal that online
(EU-28)                                           While the significance of station-                 customers are not at all lost to stationary re-
                                 ary retail in the fashion segment is dwindling,                     tail. Rather, these two channels complement one
                                 fashion has an EU-wide market share of 13.5%.                       another. Currently almost every second consumer
                                 This makes fashion the second-strongest sector                      makes both online and offline purchases. That
                                 in terms of brick-and-mortar generated turnover,                    said, the growth in recent years is already ap-
                                 putting it just behind grocery retail.                              proaching some limits. Per-capita expenditure
                                                                                                     levels among omni-channel purchasers reflect the
                                 However, there are significant differences between                  importance of a multi-channel retail approach.
                                 the countries reviewed by the study. Particular-                    These levels are more than twice that of pure on-
                                 ly in the southern European countries of Italy                      line shoppers and consumers who shop exclusively
                                 (16.9%), Spain (15.1%) and Portugal (14.3%),                        at stationary outlets.
                                 private households spend substantially above
                                 average on clothing and shoes in stationary retail.                 Even so, online retail increases competitive pres-
                                 By contrast, the Scandinavian countries are at the                  sures. This is further accentuated by the growing
                                 other end of the spectrum. With a share of 17.3%,                   significance of off-price concepts – the sale of
                                 Great Britain upsets this south-north divide. Ire-                  large volumes of (older) articles at deep discounts.
                                 land also has an above-average share of 14.9%.                      According to GfK’s consumer panel for fashion,
                                                                                                     off-price concepts along with outlet centers enjoy
                                                                                                     a 6% share of Germany’s total fashion turnover.
                                                                                                     The short-term turnover increase is affecting
                                                                                                     retailers’ margins due to the price declines,
                                                                                                     which in turn further aggravates the competitive
        Share of multi-channel purchasers                                                            environment.
 50%
                                                                 44%    44%    44%     45%    45%    *In contrast to the data at the European level, the data for Germany from GfK‘s
                                                          41%                                        fashion consumer panel includes not just clothing and shoes, but also home textiles.
 40%                                             38%

                                       31%
 30%
                             29%
                   24%
          20%
 20%

 10%

   0%
          2007      2008     2009      2010      2011     2012   2013   2014   2015    2016   2017

        source: GfK Consumer Panel Fashion; basis: purchasers

                               EUROPEAN RETAIL IN 2018 | across-magazine.com/gfk2018
7 | EUROPEAN RETAIL IN 2018 | across-magazine.com/gfk2018
Fashion share of retail turnover in 2017
across-magazine.com/gfk2018 | across-magazine.com/gfk2018
EUROPEAN RETAIL IN 2018 | EUROPEAN RETAIL IN 2018 | 8Geomarketing
PROGNOSIS OF STATIONARY
RETAIL TURNOVER IN 2018
Stationary retail profits from wide-spread upturn
+2.1% Driven by domestic components
across Europe’s countries, the
economic upturn resulted in
multiple upward revisions of the
prognoses by economic research
Political uncertainty in Italy has increased sig-
nificantly after the recent election, which raises
concerns about political and economic instability.
While the macro-economic conditions have
improved, we still expect a nominal turnover
expected increase institutes as well as the European increase of only +0.9%, which lies below the
Commission. Increases in consum- predicted rate of inflation.
in stationary retail er expenditures are also antici-
turnover in 2018 for pated for all European countries The anticipated devaluation of the Swiss franc
in 2018. against the euro can benefit Switzerland’s 2018
the EU-28 stationary retail, particularly in the border
The past year’s growth in demand was able to regions. For the first time in three years, retail
compensate for stationary retail’s market share turnover in Switzerland’s national currency will
losses to online trade. We consequently expect a undergo a nominal increase. But in euros, the
nominal turnover growth of +2.1%* in the 28 EU currency devaluation will lead to a retail turnover
countries for 2018. But this is just slightly below decrease of -2.0%.
the forecasted inflation rate increase, meaning
that only modest real-term growth is anticipated For 2018, we predict robust growth in Turkey
for retail turnover in Europe. (+7.0%), although this is significantly less than in
the previous year (+11.7%). Among other factors,
Thanks to continuing income increases, the retail in 2017 benefited from a time-limited ex-
top-ranking eastern European countries of the emption of excise taxes on household appliances
previous years once again lead the pack in 2018. in the run-up to the constitutional referendum.
We expect robust growth rates for Bulgaria The resulting increase in purchases of these prod-
(+5.3%), Hungary (+6.0%), the Czech Republic ucts in 2017 could negatively impact turnover
(+6.5%) and Romania (+7.5%). Poland should also growth in this segment in 2018.
be able to achieve stationary retail growth of
+5.6%, even though retail opening hours on
Sundays were reduced from four to two times
a month.
EUROPEAN RETAIL IN 2018 | across-magazine.com/gfk2018
9 | EUROPEAN RETAIL IN 2018 | across-magazine.com/gfk2018Forecasted stationary retail turnover for 2018
across-magazine.com/gfk2018 across-magazine.com/gfk2018
| EUROPEAN RETAIL IN 2018 | EUROPEAN RETAIL IN 2018 | 10Geomarketing
CONSUMER PRICE TRENDS FROM
2017 TO 2018
Getting on target for 2% goal
+1.9%
The lack of increase in consumer prices in 2016 Because the ECB has an-
puzzled economists. An increase in inflation was nounced that it will not touch
expected due to the accelerating recovery of the base interest rates until 2019,
global economy and the expansive fiscal policies of we anticipate a retail trend in
the European Central Bank (ECB). 2018 similar to that of last year.
The difference between the expected inflation in
With an inflation rate of 1.7% in 2017, the EU-28 nominal and real-value turn-
nations once again neared the ECB’s proclaimed over trend is expected to be at
2018 (EU-28)
+2.0% target for consumer prices. Consumers had a comparable level, with an EU-
to reach deeper into their pockets again for the wide price increase of 1.9%. It is
same goods in many eastern European countries, important to note that this prediction assumes
which struggled with deflation in the preceding no further escalation of the trade dispute
years. Wage increases appeared to be behind a between the EU and the United States. While the
general increase in consumer prices, particular- approaching Brexit in Great Britain continues to
ly in the Visegrád nations of the Czech Republic put pressure on the pound and increase inflation
(+2.4%), Slovakia (+1.4%), Hungary (+2.4%) and at an above-average rate (+2.7%), there is greater
Poland (+1.6%). The Baltic countries (+2.9 to parity among the other large economies of Ger-
+3.7%) led the way among the EU nations in 2017 many, France, Italy and Spain (+1.3 to +1.6%).
with regard to price increases. This was primarily
due to price increases for energy and food. There is a greater divergence in consumer price
trends outside of the EU. With an inflation rate of
+0.2%, Switzerland is also expected to approach
monetary stability in 2018. By contrast, Turkey
Inflation rate* as a % (EU-28) is predicted to undergo a major hike of 8.5% in
consumer prices in the current year.
2.0%
1.5%
1.0%
0.5%
0.0%
2015 2016 2017
* To ensure comparability between the countries under review, these figures refer
to general inflation (including services, transport, etc.).
11 | EUROPEAN RETAIL IN 2018 | EUROPEAN RETAIL IN 2018 | across-magazine.com/gfk2018
across-magazine.com/gfk2018Inflation rate as a % 2017
2018
EU-28
Austria 2.1%
Belgium
1.5%
Bulgaria 1.4%
Croatia 1.6%
Cyprus 1.2%
Czech Republic 2.4%
Denmark 1.4%
3.1%
Estonia
Finland 1.4%
France 1.5%
Germany 1.6%
Greece 0.8%
Hungary 2.8%
Ireland 0.9%
Italy 1.3%
Latvia 3.1%
Lithuania
2.9%
Luxembourg 1.9%
Malta 1.5%
Netherlands 1.6%
Poland 2.1%
Portugal 1.6%
Romania 4.1%
Slovakia 2.2%
Slovenia 1.8%
Spain 1.6%
Sweden 1.8%
United Kingdom 2.7%
0% 1.0% 2.0% 3.0% 4.0% 5.0%
Norway 2.2%
Switzerland 0.2%
8.5%
Turkey
Ukraine 5.9%
0% 2% 4% 6% 8% 10% 12%
source: European Commission and International Monetary Fund
across-magazine.com/gfk2018 across-magazine.com/gfk2018
| EUROPEAN RETAIL IN 2018 | EUROPEAN RETAIL IN 2018 | 12Geomarketing
RETAIL SHARE OF PRIVATE
CONSUMPTION IN 2017
Return to normality with decreasing share of retail
30.5%
A new paradigm is apparent when viewing the Affluent Switzerland (25.4%)
Instagram posts of young people or following had the lowest retail share of
their activities on other social media forums: private consumption. At the
Social media followers are no longer impressed by other end of the spectrum
expensive automobiles and watches, but rather were Croatia (49.0%) and
by hip and unusual lifestyles. The power of status Hungary (49.5%), which retail share of private
symbols has not disappeared, but simply shifted both had below-average
to travel in exotic countries, unique events and purchasing power by western
consumption in EU-28
trendy restaurants. Important are not just these European standards. In these
experiences in themselves, but also how they are countries, a higher share of income is required to
framed and presented. cover basic living expenses, such as food.
This evolution of consumer behavior toward an
ever-greater focus on recreation and services
is happening to the detriment of retail. This Retail share of private consumption as a % (EU-28)
phenomenon along with the general increase in
30.8%
wealth as well as competition from Amazon and
similar online retailers may explain the multi-year 30.7%
decline in stationary retail spending as a propor-
30.6%
tion of total consumer expenditures.
30.5%
An exception to this long-term trend happened in 2015 2016 2017
2016. Revised figures show a relative increase in
retail spending during this period. These expendi-
tures rose more than other private consumer
spending – e.g., in France and Spain. A return
to the familiar trend occurred in 2017, with an
EU-wide decline of the share of stationary retail
spending to 30.5%.
EUROPEAN RETAIL IN 2018 | across-magazine.com/gfk2018
13 | EUROPEAN RETAIL IN 2018 | across-magazine.com/gfk2018Retail share of private consumption in 2017
across-magazine.com/gfk2018 across-magazine.com/gfk2018
| EUROPEAN RETAIL IN 2018 | EUROPEAN RETAIL IN 2018 | 14Geomarketing
SALES AREA PROVISION IN 2017
Increases in absolute retail space counterbalanced by population trends
Shortly before this study went to press, a piece By contrast, France had a very lively retail real
of news in March 2018 caused a stir in the retail estate market in 2017, with an increase in
world: Toys “R” Us announced the intended clo- per-capita sales area of +1.5% to 1.20m². New
sure of all 880 sites in the US market and around openings and expansions of retail parks and
100 sites in Great Britain. Online retail had shopping centers were responsible for the
created an ever more competitive market, and majority of retail space increases.
the toy retailer was unable to rise to this chal-
lenge through more appealing prices or shopping Despite last year’s exchange rate fluctuations and
environments. political uncertainty, Turkey’s retail real estate
market experienced dynamic growth, especially in
With this and similar cases in mind, the focus of Istanbul. Absolute retail space increased by +2.1%,
many stationary retailers in Europe in recent with a clear focus on shopping center develop-
years has been on expanding or improving exist- ment.
ing retail spaces in order to enhance consumers’
shopping experience. As a result, the number of Per-capita values for retail space range widely
genuinely new retail spaces has been falling in across Europe. For example, inhabitants of the
most countries for some time. Benelux countries (1.48 -1.64m²) have more than
twice the retail shopping space available to inhab-
Even so, in 2017 there was an increase in the itants of Romania (0.72m²) and Bulgaria (0.75m²).
absolute retail space in the European countries
under review, with the exception of the Nether-
lands (-0.4%). But a different picture emerges at
the per-capita level: In half of the studied coun-
tries, per-capita sales area remained constant
or even declined, including Sweden (1.27m²),
Great Britain (1.09m²), Germany (1.44m²) and
Austria (1.66m²). In these countries, population
growth counterbalanced the increase in absolute
sales area.
15 | EUROPEAN RETAIL IN 2018 | EUROPEAN RETAIL IN 2018 | across-magazine.com/gfk2018
across-magazine.com/gfk2018Sales area provision in 2017
across-magazine.com/gfk2018 across-magazine.com/gfk2018
| EUROPEAN RETAIL IN 2018 | EUROPEAN RETAIL IN 2018 | 16Geomarketing
SALES AREA PRODUCTIVITY IN 2017
Rising sales area productivity helps retail in real estate market
Stationary retail has acquired a new function In Hungary, restrictive planning regulations along
amidst the rise of omni-channel strategies: with protectionist tendencies slowed the expan-
Attractive retail spaces are important no longer sion of international retailers. As a result, there
just for their ability to generate store turnover, was limited development of new large-scale retail
but also for their role as promotional vehicles for spaces. Strong growth in retail turnover there-
the associated online store. Direct store-to-web fore fueled sales area productivity, which grew by
turnover is just one aspect of this phenomenon. +6.9% to €2,997/m² over the past year. Dynamic
growth in sales area productivity also counterbal-
Our analyses show that a stationary retail pres- anced to some degree rising rental costs in tight
ence boosts brand awareness among customers, commercial real estate markets in other eastern
which leads to above-average online turnover in European countries.
the catchment areas of the retail sites in ques-
tion. While sales area productivity (gross turnover By western European standards, retailers in the
per m² of retail space) is an important indicator, Netherlands experienced strong growth in sales
retailers should also take into account additional area productivity. Rising turnover accompanied by
parameters when evaluating the turnover poten- a simultaneous decline in retail space increased
tial of retail spaces. sales area productivity by +3.8% to €3,806/m².
As in the case of per-capita sales provision, sales
area productivity varies across Europe. For exam-
ple, this indicator dropped in Sweden by -1.5% to
€6,000/m², which is still a high level. Belgium also
experienced declining sales area productivity in
2017, although the drop was relatively minor at
just -1.1%.
17 | EUROPEAN RETAIL IN 2018 | EUROPEAN RETAIL IN 2018 | across-magazine.com/gfk2018
across-magazine.com/gfk2018Sales area productivity in 2017
across-magazine.com/gfk2018 across-magazine.com/gfk2018
| EUROPEAN RETAIL IN 2018 | EUROPEAN RETAIL IN 2018 | 18Geomarketing
HUNGARY IN FOCUS 10%
Sunday 10%
Monday
Impact of the elimination of Sunday
opening hours 13%
22% Tuesday
Retail conditions Saturday
Retail in Hungary has enjoyed a continual upward
trend since 2011, with annual turnover growth of 15%
around 5%. Good macro-economic conditions have Wednesday
made this possible. A new low in unemployment
along with a simultaneous increase in the mini-
17%
mum wage led to robust income growth, which
is a major driver of consumption. This surplus in
Friday 12%
Thursday
available income more than compensates for Hun-
gary’s declining population. Even so, the negative source: GfK Consumer Panel
population growth poses challenges to retailers
when it comes to recruiting employees. According Weekday share of FMCG household expenditures in 2014
to a GfK survey, more than half of retailers with
more than 15 employees complain of personnel
shortages.
Role of Sundays in FMCG retail prior to new
Elimination of Sunday opening hours and drawback regulation
Amidst this market environment, a law went into Even before the elimination of Sunday opening
effect on March 15, 2015 – Hungary’s national hours, Saturday was the primary weekly shopping
holiday – that eliminated the previously allowed day. In 2014, Saturdays generated 22% of the
Sunday opening hours for retail. The law permit- total weekly FMCG turnover. With an share of
ted retailers only three self-chosen days a year approximately 10%, Sundays did not even come
for opening their doors on Sunday. Justification up to the level of an average weekday. Five
for the law was an intended improvement of retail percent of Sunday’s turnover was generated by
working conditions, with the aim of protecting impulse purchases, which are potentially lost to
families. But another motivation was the promo- retail and cannot be recuperated through the
tion of domestic, owner-run, small-scale retail. other shopping days. But only minor changes to
Businesses with less than 200 square meters absolute turnover were anticipated due to the fact
were allowed to continue opening their doors on that the associated share of the FMCG segment
Sundays, as long as the owners were personal- was comparatively low and could be partially
ly running the stores. This hastily implemented compensated for by the small-scale, owner-run
regulation was met with little affection by the stores exempted from the regulation.
Hungarian population: 80% of those surveyed by
GfK were against it. As a result, the government
rescinded the law after just one year and returned
to the previous regulation. Retail insights that go
beyond the situation in Hungary can be gained
by examining the impact and outcome of this
temporary regulation along with data from GfK’s
consumer panel.
19 | EUROPEAN RETAIL IN 2018 | EUROPEAN RETAIL IN 2018 | across-magazine.com/gfk2018
across-magazine.com/gfk2018Mondays and Thursdays biggest winners As such, Sunday shopping Sunday’s turnover share
The regulation naturally occasioned a drastic outings focused on urgent
reduction in the retail role of Sundays. Accord- daily-needs items or im-
eroded over the long term.
ing to data from GfK’s consumer panel, 84% of pulse purchases, particu-
households took advantage of Sundays to shop larly in the fresh goods segment. Sunday’s weekly
for daily-needs items in the period from March turnover share consequently sank in the FMCG
to August 2014. After the restrictive regulation segment from 11% (March - August 2014) to 2%
went into effect one year later, the percentage for (March - August 2015) and also remained below
the same time frame was just 36%. Consumers the pre-closure level after the restrictive regula-
shopped in the small shops that were not affected tion was lifted. Mondays and Tuesdays gained in
by the regulation. Those who continued to shop importance as shopping days and increased their
on Sundays spent almost 50% less than they did turnover share in 2015 by 5% and 3% respec-
on Sundays one year prior. tively, holding on to these gains even after the
Sunday shopping ban was rescinded.
Weekday share of FMCG household expenditures
Observation period of March to August
9% 9% 9% 9% 12%
Monday
14% 13%
Tuesday
11% 11% 11% 12%
13% 14%
14% Wednesday
18% 17% 16% 16% Thursday
15% 14%
15%
Friday
13% 13%
13% 13% Saturday
100%
16% 17%
16%
Sunday
18% 17% 17%
17%
20% 19%
19%
25% 22%
24% 24%
19% 19%
21%
8% 9% 9% 11%
5% 6%
2%
2011 2012 2013 2014 2015 2016 2017 source: GfK Consumer Panel
across-magazine.com/gfk2018 across-magazine.com/gfk2018
| EUROPEAN RETAIL IN 2018 | EUROPEAN RETAIL IN 2018 | 20Geomarketing
Shopping center visits in Budapest before and after Sunday restrictions – GfK benchmark
BEFORE AFTER CHANGE
Monday 33% 36% 8%
Tuesday 35% 35% 2%
Wednesday 38% 41% 7%
Thursday 41% 44% 7%
Friday 52% 56% 7%
Saturday 51% 51% 0%
Sunday 49% 18% -37%
Basis: Survey of Budapest shopping center visitors over 15 years old when leaving the premises after a shopping outing
49%
Retail just one aspect of shopping centers
In addition to retail outlets, shopping centers
house gastronomic and recreation-oriented
offerings such as cafés, cinemas and other servic-
es, which depend on retailers’ opening hours to
attract customers. Prior to the restrictive regu- enjoyed going to shopping
lation, Sunday was one of consumers’ favorite
shopping center days according to a GfK survey
centers on Sundays prior to
conducted in shopping centers in Budapest. the restrictions
Forty-nine percent of those polled indicated that
they visited shopping centers much more fre-
quently on Sundays than on normal working days. When the restrictions when into effect, consum-
ers shifted their shopping center outings from
Sunday to Monday through Friday, with Satur-
day seeing no gains. But on the whole, not that
many people answered that they visited shopping
centers, which is particularly problematic for
gastronomic and recreation-oriented offerings,
for which impulse purchases and synergies with
shopping visits play a larger role.
21 | EUROPEAN RETAIL IN 2018 | EUROPEAN RETAIL IN 2018 | across-magazine.com/gfk2018
across-magazine.com/gfk2018Online retail unable to realize significant gains Summary
The turnover volume added by small, owner-run The regulatory restrictions on Sunday opening
shops amidst the changes to Sunday opening hours posed major challenges to Hungary’s retail
hours did not prevent structural changes to Hun- scene during the transformation phase. Staffing
gary’s retail scene. As a result, small, owner-run had to be adjusted to the changes in weekday vis-
shops continually declined in significance, while itation patterns, and the stocking of fresh goods
discount merchants in particular gained market had to be completely replanned. The original goals
share, moving from 17% in 2014 to 21% in 2017. of the regulation – the improvement of employee
working conditions and promotion of owner-run,
small-scale retail – were not accomplished. Retail-
The Sunday closures led to ers responded by reducing staff, which in combi-
nation with the more compressed opening hours
no meaningful growth in led to higher workloads on business days.
online retail.
Owner-run retail outlets were able to benefit only
in the sale of urgent-need items, particularly fresh
Online retail in the FMCG segment did not mean- goods. During the period of the Sunday restric-
ingfully profit from the changed regulatory condi- tions, consumers continued to shop for basic
tions. While online retail has grown continually in FMCG-related needs on other days of the week at
Hungary, there was no acceleration in this growth chain retailers. The regulation was thus unable to
from 2014 to 2015. FMCG online retail increased halt the advance of chain retailers and particularly
its share of total turnover during this period from discount merchants, which was ultimately to the
0.8% to 1.0%, a level of growth comparable to that detriment of owner-run retail outlets. It therefore
achieved in subsequent years. seems appropriate that the restrictions were lifted
one year after they went into effect.
across-magazine.com/gfk2018 across-magazine.com/gfk2018
| EUROPEAN RETAIL IN 2018 | EUROPEAN RETAIL IN 2018 | 22Geomarketing
ABOUT GfK
Geomarketing Impressum
Making the right decisions for the future is challenging Responsible for publication:
amidst constant change in the retail sector. Project GfK GeoMarketing GmbH
developers, investors and retailers must continually re- Werner-von-Siemens-Str. 9
spond to consumers’ evolving needs and expectations. Building 6508
76646 Bruchsal | Germany
We offer expert consultancy for future-proofing new T +49 7251 9295100
locations, optimizing existing branch networks and F +49 7251 9295290
minimizing investment risks. Our retail and real estate www.gfk.com/geomarketing
experts comprehensively evaluate the conditions and geomarketing@gfk.com
market potential associated with your existing or pros-
pective retail locations.
Managing Directors:
This quickly reveals your portfolio’s strengths and Friedrich Fleischmann
weaknesses and provides concrete recommendations Hans-Peter Klotzbücher
along with all relevant market data and reliable
benchmarks to support your strategic and operational Study lead: Dr. Johannes Schamel
decisions. Contributors: János Kui, Udo Radtke, Dominique
Thiel, Andreas Elble, Christian Reppel
Contact us with any questions:
T +49 40 5701 325 20 l geomarketing@gfk.com Responsible for content:
Cornelia Lichtner, Public Relations
Layout: Nathalie Adlung
Translation: Dr. Christopher Guider
Notes:
Copy status: April 2018
Data status: February 2018
Data from the European Commission is from
November 2017; in some cases, trend analyses
from Eurostat are retrospectively adjusted.
About GfK
GfK is the trusted source of relevant market and consumer information that enables its clients to make smarter decisions. More than 13,000
market research experts combine their passion with GfK’s long-standing data science experience. This allows GfK to deliver vital global insights
matched with local market intelligence from more than 100 countries. By using innovative technologies and data sciences, GfK turns big data
into smart data, enabling its clients to improve their competitive edge and enrich consumers’ experiences and choices.
www.gfk.com GfK. Growth from Knowledge
23 | EUROPEAN RETAIL IN 2018 | EUROPEAN RETAIL IN 2018 | across-magazine.com/gfk2018
across-magazine.com/gfk2018 © GfK 2018You can also read