Deloitte Australia CleanTech (DACT) Index - FY 2019
←
→
Page content transcription
If your browser does not render page correctly, please read the page content below
Deloitte Australia
CleanTech (DACT) Index
FY 2019
Brochure / report title goes here |
                                   Section title goes here

              Contents
              Executive summary                                03

              The CleanTech Sector in Australia                04

              Market wrap – 30 June 2019                       05

              Focus Company: Infigen Energy                    06

              Positive contributions to the DACT               07

              Negative contributions to the DACT               08

              Sub-Indices Performance                          09

              DACT20 Index                                     10

              Additions and removals from the DACT             11

              Constituent Companies                            12

              Compilation of the DACT                          17

              About Deloitte                                   18

              Contact us                                       19

              June 2019, Issue 1
              Deloitte Australia CleanTech Index
              Published quarterly by Deloitte

              Brought to you by:
              John O’Brien
              Partner | Financial Advisory
              CleanTech Specialist
              Tel: +61 8 8407 7168
              e-mail: johnobrien@deloitte.com.au

02
Deloitte Australian CleanTech Index

Executive summary
Welcome to the Deloitte Australia CleanTech (DACT) Index Quarterly
Performance Report for 30 June 2019.
The Deloitte Australia CleanTech                 To provide an analysis of the DACT Index,
(DACT) Index is a quarterly review               a number of sub-indices have been
of cleantech stocks listed in Australia.         developed. Over the quarter, the strongest
It is compiled from publicly available           performing sub-index was renewable
information provided by the Australian           energy, with the water sub-index
Securities Exchange (ASX). The                   performing poorly.
DACT Index is based on the market
capitalisation weighted share price              All businesses must adapt to their
performance of listed companies                  markets, but the fact the energy sector
                                                                                                 John O’Brien
that operate across a number of                  is being impacted so heavily and so quickly
                                                                                                 Partner | Financial Advisory
defined sub-sectors. The impact of               by current changes means companies
                                                                                                 Energy Transition & Renewables
dividends and capital returns are                involved in or affected by the energy
excluded from the index, which                   industry must change faster than most.
currently comprises 93 companies.                Those that do not move quickly are at
                                                 risk of significant value loss in the
Gains were seen across the board as              medium term.
markets rallied. For the fourth quarter
of FY19, the DACT Index underperformed           In the middle of the quarter, the ASX rallied
against the ASX200: recording a gain             on the Monday after the federal election
of 7.6%, compared to a 13.3% gain for            delivered a Coalition win. This was likely
the ASX200.                                      a market correction as the perceived
                                                 negative consequences from Labor’s
Yet in the FY19 financial year as a whole, the   policies were already priced in ahead of
DACT recorded a gain of 18.8%, some 5.8%         the election.
ahead of the ASX200. This recorded the
sixth consecutive year the DACT has              For the same reason, the DACT Index
outperformed the market. The five-year           retreated in the days following the election.
performance of the index shows a gain of         Yet it still finished the quarter with modest
more than 100% and stands 72.9% ahead            gains across nearly all sub sectors.
of the ASX200, as the cleantech market
                                                 In the water sector, the drought in the
has matured into a major beneficiary of the
                                                 eastern states continued throughout the
start of the transition to a lower carbon
                                                 quarter, pushing up prices on water trading
and more sustainable economy.
                                                 markets. Low-security water is currently
The market capitalisation after its              trading at $550/ML, 25% more than the
rebalance of the 93 stocks in the DACT           price three years ago. Although the bigger
Index is A$50.9 billion, breaking the            players in the water market are producing
A$50 billion benchmark, the first time           returns for shareholder, this was not
in its history.                                  reflected in the water sub-sector index,
                                                 which mostly operates in the downstream
The energy transition is under way, bringing     water markets.
with it new investment opportunities
and markets are starting to change to
accommodate this low emissions future.

03
Deloitte Australian CleanTech Index

The CleanTech Sector in Australia
Stocks with both environmental and economic benefits

                                                         Cleantech Subsectors

                                                                                                          Smart Grid & Energy
               Solar                                        Biogas Generation
                                                                                                          Efficiency
               Solar thermal,                               Biomass digester gas,
                                                                                                          Demand response, grid
               traditional photovoltaics,                   landfill gas, biosyngas,
                                                                                                          management, peer-to-peer
               concentrating photovoltaics,                 waste-to-energy
                                                                                                          trading, energy efficiency,
               nanotechnologies
                                                                                                          home automation, IoT

               Wind                                         Energy Storage                                Green Buildings
               Onshore, offshore, urban,                    & Fuel Cells                                  Green building design,
               turbines, developers, tower                  Energy storage systems,                       precinct design, products
               and blade manufacturers,                     batteries, pumped hydro,                      and services, rating systems
               community wind farms                         fuel cell technologies                        and building management

               Biofuel                                      Vehicle Technologies                          Biomaterials
               Corn ethanol, sugar ethanol,                 Hybrid, plug-in hybrid, flex                  Organically based materials
               cellulosic ethanol, biodiesel,               fuel, hydrogen and electric                   and plastics, energy
               algae production, biotech                    vehicles, recharging and                      materials and green
               providers                                    refuelling infrastructure                     chemistry

                                                            Water                                         Carbon Trading
               Wave, Tidal, Hydro
                                                            Utility management,                           Environmental offsets,
               Surface and submerges
                                                            treatment technologies,                       carbon farming, soil
               wave technologies, tidal,
                                                            desalination, water reuse,                    management, livestock
               major and mini-hydro,
                                                            sensor technologies, water                    management and carbon
               pumped storage schemes
                                                            efficiency                                    trading

                                                            Waste Management
               Geothermal                                                                                 Environmental Service
                                                            Recycling
               Hot fractured rock,                                                                        Providers
                                                            Residential and industrial
               conventional geothermal,                                                                   Environmental engineering,
                                                            waste collection and
               technology and equipment                                                                   specialist service and
                                                            disposal, recycling
               providers                                                                                  equipment providers
                                                            operations

     The cleantech sector is split into a number of sub-sectors as detailed above. Each of the sub-sectors contains technologies and
     solutions that have both environmental and economic benefits.

     The cleantech sector is fundamentally different to Socially Responsible Investments (SRI) or Environmental, Social and
     Governance (ESG) performance. SRI and ESG look at incremental improvements in company performance and can be seen as
     ‘operational hygiene’ measures that find the best in class. Cleantech focuses on companies whose output positively enhances
     the communities and ecologies in which they reside. It is about doing ‘more good’ rather than ‘less bad’.

     With 93 companies falling under the coverage of the index and with a combined market capitalisation, after its rebalance, of
     $50.9 billion, the DACT Index presents a comprehensive picture of the Australian cleantech sector’s growth in a single measure.

     To provide a focus on the performance of the larger, more liquid stocks, we also track the performance of the largest 20
     companies by market capitalisation. The composition of this DACT20 is rebalanced every quarter and highlights any differences
     between the smaller and larger stocks.

04
Deloitte Australian CleanTech Index

Market wrap – 30 June 2019
The performance of the DACT Index over the June 2019 quarter is detailed below.

        % Change             Last Quarter                      12 Months                      3 Years                  5 Years

 ASX200                                 13.3%                       13.0%                     33.9%                    29.8%

 DACT Index                             7.6%                        18.8%                     43.3%                    102.7%

 DACT20                                 8.4%                        15.1%                     42.6%                    95.8%

                                                       Deloitte Australian CleanTech Index
                                                                   Indices set at 100 at 31 Dec 2015
190

170

150

130

110

 90
      Dec 2015

                 Apr 2016

                                                                        Jun 2017
                            Jul 2016

                                            Nov 2016

                                                        Feb 2017

                                                                                   Sep 2017

                                                                                                 Jan 2018

                                                                                                            Apr 2018

                                                                                                                         Aug 2018

                                                                                                                                    Nov 2018

                                                                                                                                                     Feb 2019

                                                                                                                                                                Jun 2019

                                       ASX200                         Clean Tech Index                      Australian Clean Tech 20

05
Deloitte Australian CleanTech Index

Focus company: Infigen Energy
An evolving strategy in a changing energy market

 1.40
                                                   2
 1.20
                                                                     3
 1.00
 0.80
 0.60                                                                                                                                                    4
 0.40               1
 0.20
 0.00

                                                                                                                                         Mar-2019

                                                                                                                                                          Jul-2019
                                                                                Jul-2017

                                                                                           Nov-2017

                                                                                                        Mar-2018

                                                                                                                   Jul-2018

                                                                                                                              Nov-2018
                                                          Nov-2016

                                                                     Mar-2017
         Jul-2015

                        Nov-2015

                                   Mar-2016

                                              Jul-2016

                                                         Infigen Energy Limited (ASX: IFN) - Share Price

     Infigen is a vertically integrated energy company, and is Australia’s largest listed wind power generator by installed capacity with
     670 MW across the country. Infigen’s wind generation assets are located in NSW, South Australia (SA) and Western Australia and
     it has PPAs in Victoria. Infigen increases the value of intermittent renewables by firming them from the Smithfield Open Cycle
     Gas Turbine in Western Sydney, NSW, and its 25MW/52MWh Battery in Lake Bonney, SA, where commercial operations are
     expected to commence in Q1FY20.

     Infigen also holds energy retailing licences in the National Electricity Market (NEM) regions of Queensland, NSW (including the
     Australian Capital Territory), Victoria and South Australia.

1. Organisation Restructuring                                                                     2. Favourable Conditions
In response to the amended Renewable Energy Target legislation in                                 Better wind conditions increased generation for Q4 FY16. Production
June 2015, Infigen decided to discontinue their international operations                          was 8% higher than the prior corresponding period (pcp). Infigen’s
and focus on the domestic opportunities. The target required 33,000                               revenue was 47% higher than the pcp due to higher electricity prices
GWh of electricity from renewable sources, (or 23.5% of electricity)                              in SA and higher LGC prices.
providing policy certainty for investors.                                                         In August 2016, Infigen announced it had 1,100 MW of
In July 2015 Infigen sold its US solar development pipeline for US$29.5                           approved capacity in the pipeline, with four projects at
million, and in October 2015, Infigen sold its US wind business portfolio                         advanced connection status.
for US$274.4 million.
3. BESS                                                                                           4. Firming up capacity
In August 2018, Infigen announced its investment in the 25 MW / 52                                During May 2019, Infigen announced its acquisition of the 123MW fast
MWh Battery Energy Storage System (BESS) in South Australia, using                                start Smithfield Open Cycle Gas Turbine in Western Sydney, NSW, for
Tesla Powerpack technology. Infigen entered into funding agreements                               AUD$74 million.
with the SA Government and the Australian Renewable Energy Agency                                 This acquisition and the implementation of the BESS constitute
to co-fund the $38 million development.                                                           Infigen’s firming strategy to increase the value and grow its intermittent
In April 2019, Infigen announced construction on the BESS was                                     renewables portfolio. The collapse in LGC prices during the past two
complete and it expected commercial operations to commence next                                   years has driven Infigen’s firming strategy.
quarter in Q1FY20.                                                                                Alongside the acquisition announcement, Infigen also announced it
                                                                                                  will begin paying one cent a share distribution to shareholders for the
                                                                                                  second half of the financial year and indicated it will keep paying half-
                                                                                                  yearly dividends going forward. Infigen paid out its last dividend in 2010.

* All information is sourced from company data and ASX announcements.

06
Deloitte Australian CleanTech Index

Positive contributions to
the DACT Index
Over the last quarter, 61 of the 93              Nanosonics Limited (Nanosonic) was the
companies positively contributed to the          third largest contributor to the DACT
DACT Index. The top three contributors to        Index over the quarter. Nanosonic is a
the index during this quarter were Meridian      manufacturer and distributor of health care
Energy Limited, Contact Energy Limited and       equipment and services. In the DACT Index,
Nanosonics Limited.                              Nanosonics is listed under the Efficiency
                                                 and Energy storage for the company’s
Meridian Energy Limited (Meridian) was           automated disinfectant technology for high
the largest positive contributor (6%) to the     efficiency ultrasound probes.
DACT Index over the quarter. Meridian is
an electricity generator and retailer in New     On an absolute share price performance
Zealand and retailer in Australia. In 2018,      basis, the companies that recorded the
Meridian expanded its Australian renewable       largest percentage share price increases
generation portfolio to support its retail       for the three months to 30 June 2019 were:
brand, Powershop. Despite new investment,
                                                 •• Aeris Environmental increased 148.3%
increases in national hydro storage and
increases in electricity demand drove            •• Phoslock Environmental Technologies
Meridian’s performance.                             increased 129%

Contact Energy Limited (Contact) was the         •• Kaline Power increased 69.2%.
second largest positive contributor (2.4%) to
the DACT Index over the quarter. Contact is
a New Zealand based renewables generator
and retailer of electricity and natural gas.
Contact operates two hydro, five geothermal
and six thermal stations.

Table 1: Largest positive contributions to      Table 2: Largest share price increases in
the DACT Index in the 2019 June quarter         the 2019 June quarter

Company                           Performance   Company                           Performance
Meridian Energy                          6.0%   Aeris Environmental                    148.0%
Contact Energy                           2.4%   Phoslock Environmental                 129.0%
Nanosonics                               1.8%   Technologies
                                                Kalina Power                            69.2%
Mercury NZ                               1.5%
                                                Bingo Industries                        47.7%
Cleanaway Waste                          1.4%
                                                First Graphite                          45.7%
Phoslock Environmental                   0.9%
Technologies                                    Pyrolyx AG                              44.9%

Bingo Industries                         0.8%   Rectifier Technologies                  43.8%

Syrah Resources                         0.26%   Mpower Group Ltd                        42.9%

Source: Deloitte analysis, ASX, Capital IQ      Source: Deloitte analysis, ASX, Capital IQ

07
Deloitte Australian CleanTech Index

Negative contributions to
the DACT Index
The largest negative contribution on a           The companies that recorded the largest
market capitalisation basis to the DACT          percentage share price decreases for the
Index for the 2019 June quarter came from        2019 June quarter were Actinogen, Battery
Reliance Worldwide Corp.                         Minerals and Simble Sense.

Table 3: Largest negative contributions to       Table 4: Largest share price decreases in
the DACT Index in the 2019 June quarter          the 2019 June quarter

Company                           Performance    Company                            Performance
Reliance Worldwide Corp                 (1.5%)   Actinogen                               (81.5%)
Purifloh Ltd                            (0.5%)   Battery Minerals                        (54.8%)
Ioneer                                  (0.2%)   Simble Sense                            (48.8%)
Reece                                   (0.1%)   RedFlow                                 (43.5%)
Actinogen                               (0.1%)   Leaf Energy                             (40.0%)
Fluence Corp                            (0.1%)   Wide Open Agriculture                   (38.9%)
Seafarms Group                          (0.1%)   Galaxy Resources                        (34.8%)
Duxton Water                            (0.1%)   Volt Power Group                        (33.3%)

Source: Deloitte analysis, ASX, Capital IQ       Source: Deloitte analysis, ASX, Capital IQ

08

Deloitte Australian CleanTech Index
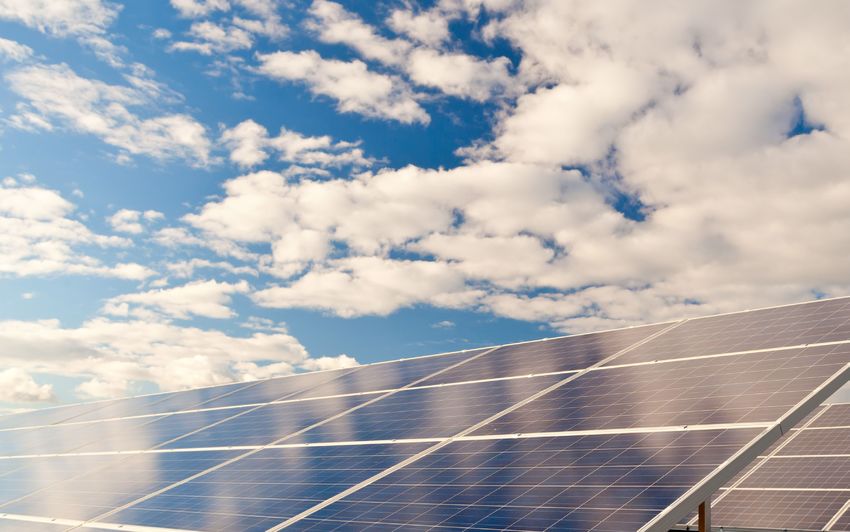
Sub-Indices Performance
To allow a more granular analysis of the DACT Index, a number of sub-
indices have been developed. The performance of each of these sub-
indices over the last five financial years and during 4Q of FY19 is shown
in the table and charts below. The five-year performance of Renewable
Energy and Efficiency and Energy Storage show gains of over 100%.
% Change Last Quarter 12 Months 3 Years 5 Years
Renewable energy 7% 19% 32% 117%
Water -0.7% -2.8% 46% 86%
Waste 1.2% 2.1% 69% 34%
Sustainable minerals 0.2% -1.0% N/A N/A
Efficiency & energy storage 1.0% 1.4% -8% 116%
Deloitte Australian CleanTech Index
Sub-Indices Performance 4Q FY2019
Efficiency & Energy Storage
Sustainable Minerals
Waste
Water
Renewable Energy
-2% 0% 2% 4% 6% 8%
Deloitte Australian CleanTech Index
Indices set at 100 at 31 Dec 2015
210
190 Renewable Energy
170 Water
150 Waste
130 Sustainable Minerals
110 Efficiency & Energy
Storage
90
Dec 2015
Apr 2016
Jul 2016
Nov 2016
Feb 2017
Jun 2017
Sep 2017
Jan 2018
Apr 2018
Aug 2018
Nov 2018
Feb 2019
Jun 2019
09
Deloitte Australian CleanTech Index

DACT20 Index
DACT20 Component Companies on 30 June 2019

The 20 largest index constituents by market capitalisation on 30 June 2019
are provided in the table below. These companies will form the constituents
of the DACT20 until the ndex is rebalanced again on 30 September 2019.

The only new entrant to the DACT20 at this rebalance is Phoslock
Environmental Technologies that has replaced the departing Australian
Ethical Investment.

Each of the constituents in the DACT20 has a market capitalisation of more
than $200m with an average market capitalisation of $2.4 billion.

 Market Cap Ranking        Company                          Ticker

            1              Meridian Energy                  MEZ

            2              Mercury NZ                       MCY

            3              Contact Energy                   CEN

            4              Reece                            REH

            5              Cleanaway Waste                  CWY

            6              Reliance Worldwide Corp          RWC

            7              Sims Metal Management            SGM

            8              Nanosonics                       NAN

            9              Bingo Industries                 BIN

           10              Tilt Renewables                  TLT

           11              Orocobre                         ORE

           12              Galaxy Resources                 GXY

                           Phoslock Environmental
           13                                               PET
                           Technologies

           14              Infigen Energy                   IFN

           15              New Energy Solar                 NEW

           16              Syrah Resources                  SYR

           17              Pacific Energy                   PEA

           18              CleanTeQ                         CLQ

           19              Beacon Lighting Corp             BLX

           20              Fluence Corp                     FLC

10
Deloitte Australian CleanTech Index
DACT Index Company additions,
removals and name changes
The following Deloitte Australia CleanTech Index companies have been added, removed or
changed company names during the March 2019 quarter.
Additions Removals
Ioneer (INR.AX) Mission NewEnergy (MBT.AX) –
Administration
Debuting at rank 21 by market capitalisation in the DACT Index, it
contributes to the sustainable minerals sub-sector. First Cobalt Corp (ASX.FCC) -
Administration
Ioneer is an exploration company focusing on Lithium-Boron projects
located in the USA. Lithium is a fundamental component of lithium-
ion batteries that are powering the electric vehicles revolution. Boron
is vital to creating specialty glass, insulation and permanent magnets
used in electric motors. Lithium and Boron are essential elements
necessary for electrification and decarbonisation.
Rhyolite Ridge lithium-boron project in southern Nevada is Ioneer’s
primary focus. The mine life will be 30 years with production to start
in 2021. Initial drilling indicates high quality reserves.
Ioneer also has gold, copper and silver projects in Nevada and Arizona
in the United States.
11Deloitte Australian CleanTech Index
Companies included in the DACT
Index as at 30 June 2019
Share Price Share Price Mkt Cap Mkt Cap Quarterly Quarterly
Market Cap Share Price
Jun-19 Mar-19 Jun-19 Mar-19 Change Performance
Rank
Jun-19 Code Company Subsector $ $ ($m) ($m) ($m) (%)
Renewable
1 MEZ Meridian Energy 4.01 4.64 12,173 10,725 1,448.0 15.7%
Energy
Renewable
2 MCY Mercury NZ 3.75 4.21 6,335 5,313 1,021.7 12.3%
Energy
Renewable
3 CEN Contact Energy 6.49 7.63 5,734 4,974 760.1 17.6%
Energy
4 REH Reece Water 9.86 9.76 5,474 5,530 (56.1) (1.0%)
5 CWY Cleanaway Waste Waste 2.22 2.33 4,764 4,534 230.0 5.0%
6 RWC Reliance Worldwide Corp Water 4.31 3.52 2,762 3,382 (619.9) (18.3%)
7 SGM Sims Metal Management Waste 10.71 10.86 2,202 2,171 30.5 1.4%
Efficiency &
8 NAN Nanosonics 4.36 5.62 1,686 1,308 378.0 28.9%
Energy Storage
9 BIN Bingo Industries Waste 1.53 2.26 1,494 1,005 488.9 47.7%
Renewable
10 TLT Tilt Renewables 2.30 2.33 1,174 735 438.2 1.3%
Energy
Sustainable
11 ORE Orocobre 3.37 2.82 738 881 (143.4) (16.3%)
Minerals
Sustainable
12 GXY Galaxy Resources 1.88 1.23 501 766 (264.7) (34.8%)
Minerals
Phoslock Environmental
13 PET Water 0.38 0.87 480 206 273.7 128.9%
Technologies
Renewable
14 IFN Infigen Energy 0.44 0.48 454 421 33.5 8.0%
Energy
Renewable
15 NEW New Energy Solar 1.39 1.28 446 486 (39.3) (7.9%)
Energy
Sustainable
16 SYR Syrah Resources 1.07 0.88 303 368 (65.3) (17.8%)
Minerals
Renewable
17 PEA Pacific Energy 0.64 0.69 295 273 21.8 7.9%
Energy
18 CLQ CleanTeQ Water 0.31 0.38 284 231 52.3 22.6%
Efficiency &
19 BLX Beacon Lighting Corp 1.09 1.04 228 238 (9.6) (4.6%)
Energy Storage
20 FLC Fluence Corp Water 0.51 0.39 210 271 (61.8) (22.8%)
12Deloitte Australian CleanTech Index
Share Price Share Price Mkt Cap Mkt Cap Quarterly Quarterly
Market Cap Share Price
Jun-19 Mar-19 Jun-19 Mar-19 Change Performance
Rank
Jun-19 Code Company Subsector $ $ ($m) ($m) ($m) (%)
Sustainable
21 INR Ioneer 0.00 0.14 198 0 198.4 N/A
Minerals
Australian Ethical
22 AEF Others 2.42 1.77 198 271 (72.9) (26.9%)
Investment
23 SFG Seafarms Group Others 0.10 0.09 174 167 6.8 (12.0%)
24 D2O Duxton Water Water 1.65 1.34 162 179 (16.8) (18.8%)
Sustainable
25 MNS Magnis Resources 0.27 0.19 116 162 (45.8) (28.3%)
Minerals
Sustainable
26 NMT Neometals 0.23 0.21 114 122 (8.2) (6.7%)
Minerals
Sustainable
27 FGR First Graphite 0.18 0.26 114 72 41.3 45.7%
Minerals
28 PO3 Purifloh Ltd Water 4.85 3.35 105 152 (47.1) (30.9%)
Efficiency &
29 PPG Pro-Pac Packaging 0.14 0.12 93 114 (20.3) (17.9%)
Energy Storage
Efficiency &
30 BUD Buddy Platform 0.07 0.05 92 97 (5.4) (32.9%)
Energy Storage
Efficiency &
31 GAP Gale Pacific 0.32 0.32 90 91 (0.9) -
Energy Storage
Renewable
32 GNX Genex Power 0.26 0.26 80 80 0.1 -
Energy
Lithium Power Sustainable
33 LPI 0.21 0.29 75 54 21.0 39.0%
International Minerals
Efficiency &
34 MPP Metro Performance Glass 0.42 0.35 70 82 (11.1) (16.7%)
Energy Storage
Integrated Green
35 IGE Waste 0.26 0.18 69 100 (31.4) (31.4%)
Energy Solutions
36 AEI Aeris Environmental Others 0.13 0.31 66 26 39.2 148.0%
Efficiency &
37 BLG Bluglass 0.18 0.16 65 73 (8.4) (11.4%)
Energy Storage
Efficiency &
38 RFT Rectifier Technologies 0.03 0.05 63 44 19.1 43.8%
Energy Storage
Sustainable
39 JRV Jervois Mining 0.23 0.22 62 51 10.4 (6.5%)
Minerals
Efficiency &
40 CLX Calix 0.83 0.80 60 62 (2.1) (3.6%)
Energy Storage
Efficiency &
41 EDE Eden Innovations 0.05 0.04 58 52.6 (18.3) (23.9%)
Energy Storage
13Deloitte Australian CleanTech Index
Share Price Share Price Mkt Cap Mkt Cap Quarterly Quarterly
Market Cap Share Price
Jun-19 Mar-19 Jun-19 Mar-19 Change Performance
Rank
Jun-19 Code Company Subsector $ $ ($m) ($m) ($m) (%)
Renewable
42 HRL HRL Holdings 0.09 0.12 57 68.3 12.3 27.8%
Energy
Renewable
43 WND Windlab 1.03 0.80 55 44.7 (15.1) (22.3%)
Energy
Efficiency &
44 NVX Novonix 0.49 0.44 54 60 (6.2) (10.2%)
Energy Storage
Sustainable
45 TON Triton Minerals 0.05 0.06 54 43 11.1 26.1%
Minerals
Efficiency &
46 14D 1414 Degrees 0.32 0.30 51 54 (3.4) (6.3%)
Energy Storage
Sustainable
47 BKT Black Rock Mining 0.07 0.08 49 39 10.5 27.3%
Minerals
48 PLX Pyrolyx AG Waste 0.59 0.86 45 28 16.5 44.9%
49 EVS EnviroSuite Others 0.16 0.12 44 59 (14.8) (25.0%)
Efficiency &
50 RFX RedFlow 0.07 0.04 36 49 (13.6) (43.5%)
Energy Storage
Sustainable
51 KNL Kibaran Resources 0.10 0.12 35 28 6.9 20.0%
Minerals
Sustainable
52 VRC Volt Resources 0.02 0.02 30 32 (2.5) (9.1%)
Minerals
53 CG1 Carbonxt Others 0.34 0.33 29 30 (1.3) (4.4%)
Renewable
54 QTM Quantum Energy 0.03 0.03 29 27 1.1 4.0%
Energy
Sustainable
55 LIT Lithium Australia 0.08 0.06 28 38 (9.3) (27.2%)
Minerals
Sustainable
56 AVL Australian Vanadium 0.02 0.01 26 36 (9.9) (27.8%)
Minerals
Efficiency &
57 HZR Hazer Group 0.29 0.26 25 28 (2.9) (10.3%)
Energy Storage
58 OEC Orbital Corporation Others 0.36 0.30 23 28 (4.6) (16.7%)
Sustainable
59 GPX Graphex Mining 0.22 0.26 23 19 3.7 18.2%
Minerals
60 DEM De.Mem Water 0.14 0.18 23 17 5.6 28.6%
61 PG1 Pearl Global Waste 0.15 0.14 23 23 (0.0) (6.9%)
Sustainable
62 BSM Bass Metals 0.01 0.01 22 33 (11.0) (33.3%)
Minerals
63 VMT Vmoto Others 0.07 0.10 22 16 5.9 35.1%
14Deloitte Australian CleanTech Index
Share Price Share Price Mkt Cap Mkt Cap Quarterly Quarterly
Market Cap Share Price
Jun-19 Mar-19 Jun-19 Mar-19 Change Performance
Rank
Jun-19 Code Company Subsector $ $ ($m) ($m) ($m) (%)
Renewable
64 CPV Clearvue Technologies 0.27 0.22 22 26 (4.4) (17.0%)
Energy
65 RGI Roto-Gro International Others 0.23 0.16 21 24 (3.0) (30.4%)
Sustainable
66 COB Cobalt Blue Holdings 0.15 0.13 19 18 1.4 (10.3%)
Minerals
Sustainable
67 BAT Battery Minerals 0.03 0.01 18 35 (16.1) (54.8%)
Minerals
Technology Metals Sustainable
68 TMT 0.22 0.21 18 19 (0.9) (4.5%)
Australia Minerals
Renewable
69 KPO Kalina Power 0.01 0.02 16 6 10.2 69.2%
Energy
Efficiency &
70 SES SECOS Group 0.04 0.04 15 11 3.5 2.5%
Energy Storage
Efficiency &
71 VIV Vivid Technology 0.03 0.03 14 14 - -
Energy Storage
Efficiency &
72 BIQ BuildingIQ 0.04 0.05 13 10 2.6 12.5%
Energy Storage
73 EGL Environmental Group Others 0.05 0.06 12 12 0.2 1.9%
Efficiency &
74 TTI Traffic Technologies 0.02 0.02 12 12 - -
Energy Storage
75 ACW Actinogen Others 0.05 0.01 11 60 (49.2) (81.5%)
Efficiency &
76 EAX Energy Action 0.32 0.40 10 8 2.1 25.0%
Energy Storage
Renewable
77 CCE Carnegie Clean Energy 0.00 0.00 10 10 - -
Energy
78 SDV SciDev Waste 0.06 0.09 9 5 3.9 36.5%
79 LER Leaf Energy Others 0.05 0.03 9 15 (6.1) (40.0%)
80 AEB Algae.Tec Others 0.01 0.01 9 9 - -
Efficiency &
81 VPR Volt Power Group 0.00 0.00 8 12 (4.1) (33.3%)
Energy Storage
82 WOA Wide Open Agriculture Others 0.18 0.11 8 13 (4.9) (38.9%)
83 CL8 Collaborate Corp Others 0.01 0.01 7 9 (2.2) (23.1%)
Sustainable
84 BEM BlackEarth Minerals 0.07 0.06 7 8 (0.9) (11.1%)
Minerals
Source: Deloitte analysis, ASX, Capital IQ
15Deloitte Australian CleanTech Index
Share Price Share Price Mkt Cap Mkt Cap Quarterly Quarterly
Market Cap Share Price
Jun-19 Mar-19 Jun-19 Mar-19 Change Performance
Rank
Jun-19 Code Company Subsector $ $ ($m) ($m) ($m) (%)
Renewable
85 RNE ReNu Energy 0.08 0.06 7 9 (2.1) (30.5%)
Energy
86 RAN Range International Waste 0.03 0.03 5 5 - -
Renewable
87 MPR Mpower Group Ltd 0.02 0.03 5 3 1.4 42.9%
Energy
Efficiency &
88 SIS Simble Sense 0.08 0.04 4 8 (4.0) (48.8%)
Energy Storage
89 NC6 Nanollose Waste 0.07 0.05 4 5 (1.5) (29.9%)
Renewable
90 POW Protean Wave Energy 0.01 0.01 3 4 (1.2) (30.8%)
Energy
Renewable
91 KTE K2 Energy 0.01 0.01 2 2 0.3 16.7%
Energy
92 PPY Papyrus Australia Waste 0.01 0.01 1 1 0.3 20.0%
93 SBI Sterling Biofuels Others 0.01 0.01 1 1 - -
16Deloitte Australian CleanTech Index
Compilation of the DACT Index
Compilation of the DACT Index About Deloitte Energy Team For more information regarding the
The quarterly DACT Index is compiled As one of Australia’s leading professional Deloitte Australia CleanTech Index,
from publicly available information services firms, Deloitte Touche Tohmatsu please contact:
provided by the ASX on the share prices and its affiliates provide audit, tax,
and market capitalisation of each consulting and financial advisory services
cleantech listed company. through approximately 10,000 people John O’Brien
across the country.. Partner, Energy Transition & Renewables
A company is included on the DACT Financial Advisory
Index if the majority of its revenues are Deloitte’s Energy Transition team has Tel: +61 419 826 372
from a recognised cleantech sub-sector. the experience and expertise to help the e-mail: johnobrien@deloitte.com.au
The information on cleantech listed energy industry face the challenges of
companies is extracted to provide a market today and tomorrow. We have a diverse
capitalisation weighted share price index team of experts from a wide range of
for all cleantech companies, broadly in line backgrounds, including networks, retailers,
with the methodology adopted for the regulators and government.
compilation of the S&P/ASX 200 Index.
The impact of dividends and capital returns We know the market, and have helped
has been excluded from the DACT Index. many energy sector participants, new
entrants, investors, large consumers
The base period of the DACT Index is 31 and governments with a diverse range of
December 2015, and for the purposes of solutions, including strategy, forecasting,
the index this month is given a notional planning and both financial and energy
value of 100. Please note, if a company has market modelling.
been delisted during a particular period,
no data will be included for that month and Disclaimer of liability
all subsequent months until the company This index has been prepared as general
is relisted. Historical information regarding information only and does not consider
the company will continue to be included in the specific objectives, situation or needs
the calculation of the DACT index. of anyone including any member of its
target audience. You should not rely on the
The positive and negative contributions information in the DACT Index or disclose it
to the DACT Index are determined on or refer to it in any document.
the basis of a company’s size by market
capitalisation relative to the total size of Deloitte does not accept any duty of
the index and its share price performance care or liability to anyone regarding this
from the time the firm was added to the Index or any of its content and we are
DACT Index. not responsible to anyone for any loss
suffered in connection with the use of
this index or any of its content. We make
no representation or warranty about the
accuracy of the information in the index.
Circumstances might have changed since
the date this index was prepared.
17Deloitte Australian CleanTech Index
About Deloitte
Our signals Talk straight
Continuously grow and improve When we talk, it’s open, regular, honest,
We have an environment that respects constructive two-way communication
the individual, rewards achievements, between our people and our clients.
welcomes change and encourages
a lifetime of learning – with ourselves Empower and trust
and our clients. We encourage a sense of ownership
and pride by giving responsibility and
Have fun and celebrate delegating authority.
There is never a wrong time to celebrate
and have fun – recognising, appreciating, Recruit and retain the best
acknowledging and learning from the Our people are talented, enthusiastic,
experiences and success shared between self-starters, team players who are bursting
our client and Deloitte teams. with potential. They are people with whom
we have a lifetime association.
Aim to be famous
We aim to reach for the stars – and beyond.
To be thought leaders, showcasing our
clients and our team’s talent and expertise.
Play to win
Think globally – Winning is our
stated objective.
It is also our state of mind.
Our culture – our essence
Culture at Deloitte does not just happen – we work
at it.It’s the sum total of the actions of our people,
it’s the way we treat others – it’s the way we behave.
Our seven Signals embody these values. Our
passion for teamwork and exceptional client Our mission is to help our
service is our point of difference. clients and our people excel.
At Deloitte, we live and breathe our culture. Our
internationally experienced professionals strive to
deliver seamless, consistent services wherever our
clients operate.
18Deloitte Australian CleanTech Index Contact us Please feel free to contact any of the following to discuss how we can achieve your Energy Transition goals: John O’Brien Sandra James Kumar Padisetti Partner, Energy Transition Partner, Energy Transition Partner, Energy Transition Financial Advisory Financial Advisory Financial Advisory T: +61 419 826 372 T: +61 408 799 360 T: +61 412 199 065 E: johnobrien@deloitte.com.au E: sanjames@deloitte.com.au E: kpadisetti@deloitte.com.au Celine Luke Emma Fishburn Elizabeth Boylan Director Director Associate Director Energy Transition Energy Transition Energy Transition Financial Advisory Financial Advisory Financial Advisory T: +61 434 288 67 T: +61 438 141 985 T: +61 428 352 067 E: cluke@deloitte.com.au E: efishburn@deloitte.com.au E: eboylan@deloitte.com.au Shari Boyd Ben Nethersole Associate Director Associate Director Energy Transition Energy Transition Financial Advisory Financial Advisory T: +61 468 735 371 T: +61 410 800 221 E: sboyd@deloitte.com.au E: bnethersole@deloitte.com.au 19
Deloitte refers to one or more of Deloitte Touche Tohmatsu Limited (“DTTL”), its global network of member firms,
and their related entities. DTTL (also referred to as “Deloitte Global”) and each of its member firms and their
affiliated entities are legally separate and independent entities. DTTL does not provide services to clients.
Please see www.deloitte.com/about to learn more.

Deloitte is a leading global provider of audit and assurance, consulting, financial advisory, risk advisory, tax and
related services. Our network of member firms in more than 150 countries and territories serves four out of
five Fortune Global 500®companies. Learn how Deloitte’s approximately 286,000 people make an impact that
matters at www.deloitte.com.

Deloitte Asia Pacific
Deloitte Asia Pacific Limited is a company limited by guarantee and a member firm of DTTL. Members of Deloitte
Asia Pacific Limited and their related entities provide services in Australia, Brunei Darussalam, Cambodia, East
Timor, Federated States of Micronesia, Guam, Indonesia, Japan, Laos, Malaysia, Mongolia, Myanmar, New Zealand,
Palau, Papua New Guinea, Singapore, Thailand, The Marshall Islands, The Northern Mariana Islands, The People’s
Republic of China (incl. Hong Kong SAR and Macau SAR), The Philippines and Vietnam, in each of which operations
are conducted by separate and independent legal entities.

Deloitte Australia
In Australia, the Deloitte Network member is the Australian partnership of Deloitte Touche Tohmatsu. As one
of Australia’s leading professional services firms. Deloitte Touche Tohmatsu and its affiliates provide audit, tax,
consulting, and financial advisory services through approximately 8000 people across the country. Focused on
the creation of value and growth, and known as an employer of choice for innovative human resources programs,
we are dedicated to helping our clients and our people excel. For more information, please visit our web site at
https://www2.deloitte.com/au/en.html.

Liability limited by a scheme approved under Professional Standards Legislation.
Member of Deloitte Asia Pacific Limited and the Deloitte Network.
© 2019 Deloitte Touche Tohmatsu.
Designed by CoRe Creative Services. RITM0305884
You can also read