Energy in 2018: an unsustainable path - Spencer Dale Group chief economist London 11 June 2019 - BP
←
→
Page content transcription
If your browser does not render page correctly, please read the page content below
Energy in 2018: an unsustainable
path
Spencer Dale
Group chief economist

London
11 June 2019
1. Introduction

            This is the 68th edition of the Stats Review.

            As I have travelled around the world with BP over the past few years, I have come to appreciate the
            esteem in which the Statistical Review is held.

            One of the most tangible examples of this is when executives or officials in different parts of the
            world pull me towards their bookshelves to show me a set of Stats Review booklets going back the
            past 20 or 30 years.

            At first I was a little perplexed by this: why keep a copy of last year’s Stats Review once a new
            updated Review and dataset have been published.

            Even more so, given that all the data are available online.

            But I came to realise that the commentary that’s also included in the Stats Review provides a
            snapshot of the issues dominating the industry in that year.

            It’s a bit like those birthday cards which reproduce newspaper headlines from the year in which the
            person was born. They jolt your memory of different events.

            As well as the raw data, the Stats Review provides a record of key energy developments and events
            of the day.

            My guess is that when our successors look back at Statistical Reviews from around this period, they
            will observe a world in which there was growing societal awareness and demands for urgent action
            on climate change, but where the actual energy data continued to move stubbornly in the wrong
            direction.

            A growing mismatch between hopes and reality.

            In that context, I fear – or perhaps hope – that 2018 will represent the year at which this mismatch
            peaked.

Energy in 2018: an unsustainable path                                                                              Page | 1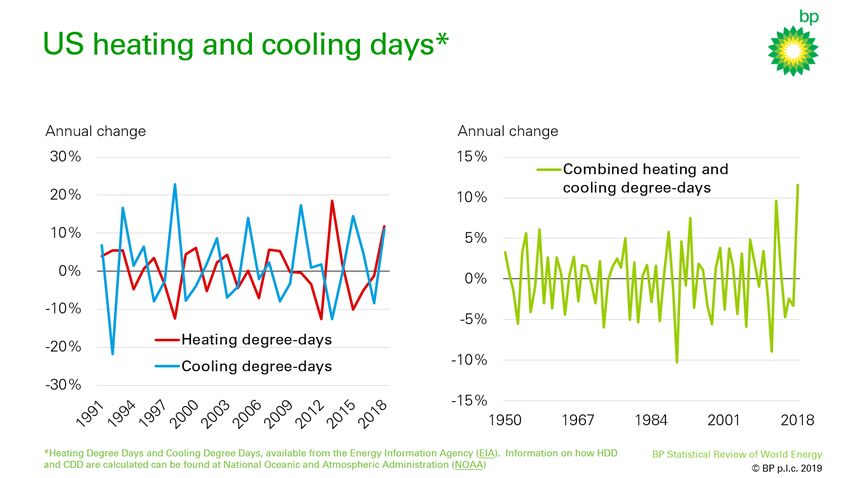
As people protested, school children went on strike and shareholders passed resolutions, energy
            demand and carbon emissions grew at their fastest rate for years.

            The Stats Review can’t solve this mismatch, but it can provide an objective assessment of the
            factors driving energy developments in 2018 and their possible implications for the future.

             2. Key features of 2018

            So what happened in 2018?

            The headline numbers are the rapid growth in energy demand and carbon emissions.

            Global primary energy grew by 2.9% in 2018 – the fastest growth seen since 2010.

            This occurred despite a backdrop of modest GDP growth and strengthening energy prices.

            At the same time, carbon emissions from energy use grew by 2.0%, again the fastest expansion for
            many years, with emissions increasing by around 0.6 gigatonnes.

Energy in 2018: an unsustainable path                                                                          Page | 2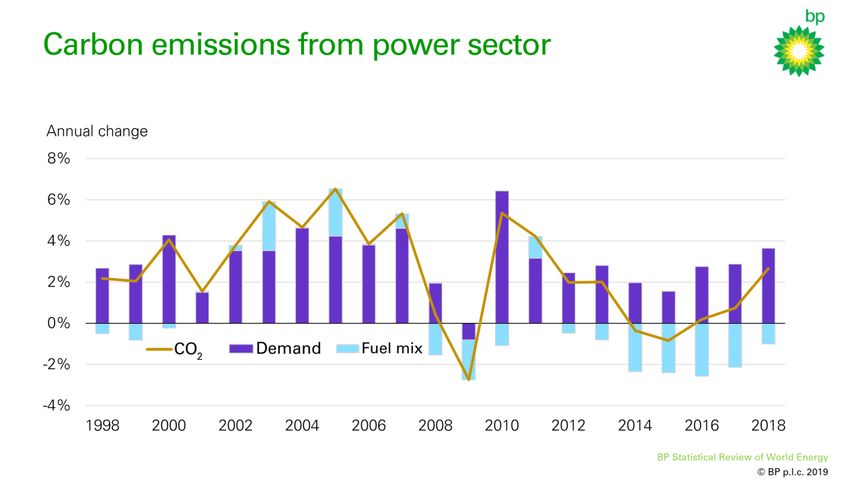
That’s roughly equivalent to the carbon emissions associated with increasing the number of
            passenger cars on the planet by a third.

            These increases are material.

            So what drove these increases in 2018? And how worried should we be?

            Starting first with energy consumption.

            As I said, energy demand grew by 2.9% last year.

            This growth was largely driven by China, US and India which together accounted for over two thirds
            of the growth.

            Relative to recent historical averages, the most striking growth was in the US, where energy
            consumption increased by a whopping 3.5%, the fastest growth seen for 30 years and in sharp
            contrast to the trend decline seen over the previous 10 years.

            The strength in energy consumption was pretty much reflected across all the fuels, most of which
            grew more strongly than their historical averages.

Energy in 2018: an unsustainable path                                                                            Page | 3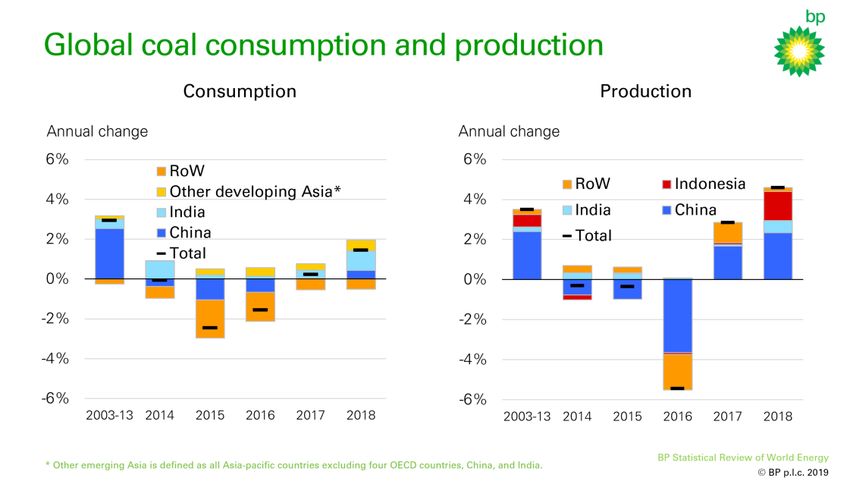
This acceleration was particularly pronounced in natural gas demand, which increased 5.3%, one of
            its strongest growth rates for over 30 years, accounting for almost 45% of the entire growth in global
            energy consumption.

            Growth in renewable energy (14.5%) eased back slightly relative to past trends although remained by
            far the world’s fastest growing energy source.

            In terms of why energy demand was so strong: the chart provides a way of gauging the extent of the
            surprise in this year’s energy data.

Energy in 2018: an unsustainable path                                                                                Page | 4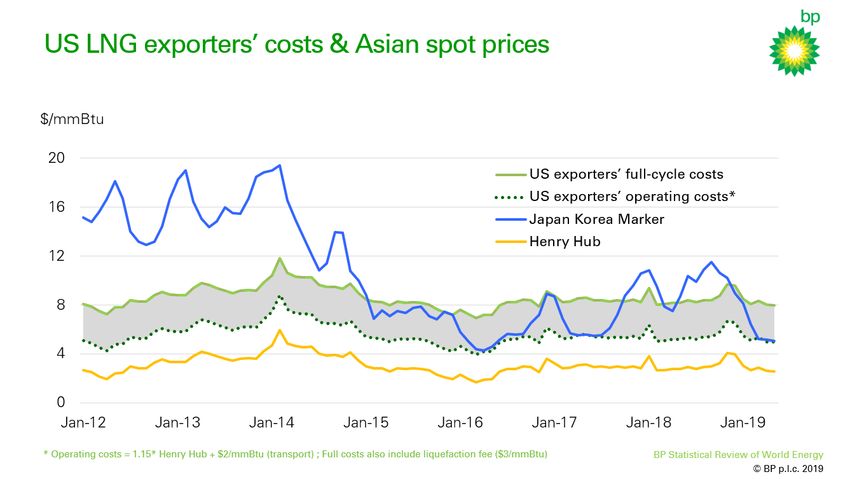
The ‘predicted’ line uses a simple framework of GDP growth and changes in oil prices (as a proxy for
            energy prices) to predict primary energy growth at a country level and then aggregates to global
            energy.

            Although very simple, the framework is able to explain much of the broad contours in energy demand
            over the past 20 years or so.

            This framework predicts that the growth in energy demand should have slowed a little last year,
            reflecting the slightly weaker economic backdrop and the strengthening in energy prices.

            Instead, energy demand picked up quite markedly.

            Digging into the data further, it seems that much of the surprising strength in energy consumption in
            2018 may be related to weather effects. In particular, there was an unusually large number of both
            hot and cold days last year, which led to higher energy consumption as the demand for cooling and
            heating services increased.

            The increasing frequency and intensity of heating and cooling days was pretty widespread across
            many of the world’s major demand centres last year, particularly in the US, China and Russia helping
            to explain the strong growth in energy consumption in each of these countries.

Energy in 2018: an unsustainable path                                                                               Page | 5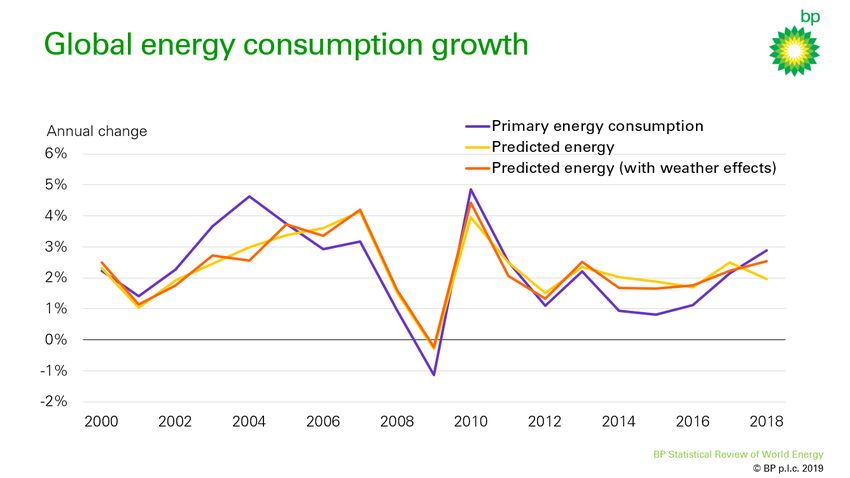
To give a little more context, the chart shows a measure of US heating and cooling days which
            combines both the frequency and intensity of unusually cold and hot days. What was particularly
            unusual about the US last year was that there was an increase in both heating and cooling days; in
            past years, high numbers of heating days have tended to coincide with low numbers of cooling days
            or vice versa. As a result, the increase in the combined number of US heating and cooling days last
            year was its highest since the 1950s, boosting US energy demand.

            If we augment our framework to include a measure of heating and cooling days for those countries
            for which data are available, this greatly reduces the extent of the surprise in last year’s energy

            growth.1

            Indeed, this analysis suggests that the stimulus from weather effects in US, China and Russia alone
            could account for around a quarter of the increase in energy consumption last year.

            1
             The framework is based on estimating individual relationships for 79 countries and 12 small regions. Historical observations
            going back to mid-1990s for heating and cooling days are available for 21 countries, accounting for around 70% of global
            energy demand.

Energy in 2018: an unsustainable path                                                                                                       Page | 6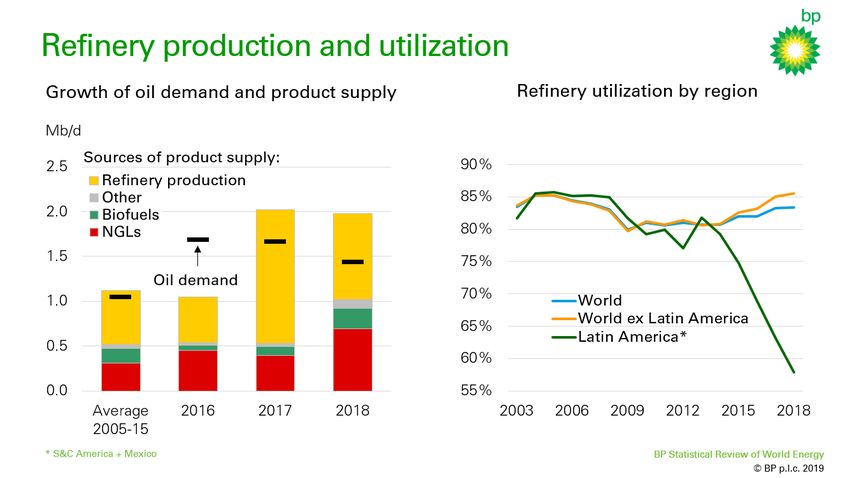
Once these weather effects are included, the growth in energy demand in 2018 still looks a little
stronger than expected, but more striking is the surprising weakness of demand growth in the period
2014-16, which is far lower than the framework predicts.
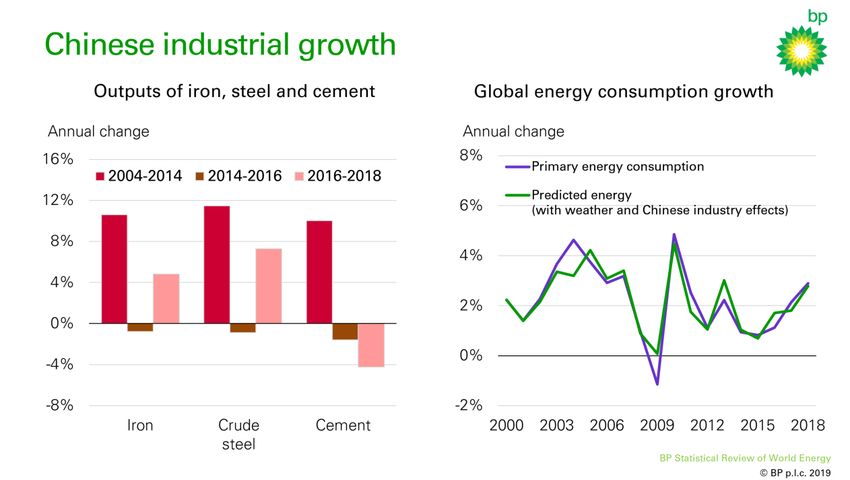
For those loyal stalwarts amongst you who have been regular followers of the Stats Review in recent
years, you may recall that much of this weakness appears to stem from the pattern of Chinese
economic growth during this period, in particular the pronounced weakness of some of China’s most
energy-intensive sectors – iron, steel and cement – which account for around a quarter of China’s
energy consumption and greatly dampened overall energy growth.
At the time, I speculated that some of the slowing in these sectors reflected the structural
rebalancing of the Chinese economy towards more consumer and service-facing sectors and so was
likely to persist. But I also noted that the scale of the slowdown suggested that some of it was likely
to be cyclical and would reverse over time. And indeed that is what began to happen in iron and steel
in 2017 and gathered significant pace last year.
Energy in 2018: an unsustainable path Page | 7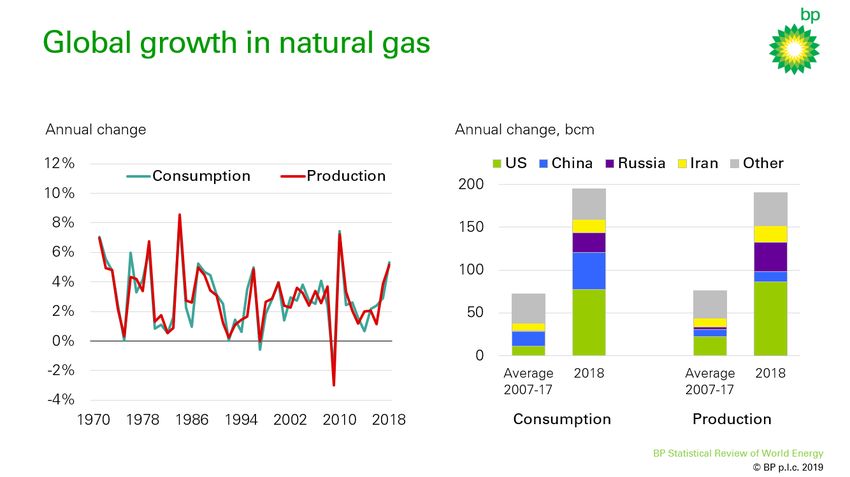
If we adjust the framework to also take account of movements in these key Chinese industrial
            sectors, the over-prediction of energy growth in 2014-16 is greatly reduced, as is the remaining
            ‘unexplained’ strength of energy demand in 2018.

            So in answer to the question of why energy demand was so strong in 2018: it appears that the
            strength of demand last year was largely due to weather-related effects – especially in the US, China
            and Russia – together with a further unwinding of cyclical factors in China.

            How does this relate to the worrying acceleration in carbon emissions?

            To a very large extent, the growth in carbon emissions is simply a direct consequence of the increase
            in energy growth. Relative to the average of the previous five years, growth in energy demand was
            1.5 percentage points higher in 2018 and the growth in carbon emissions was 1.4 percentage points
            higher.

            One led to the other.

            If anything, given the growth in energy demand, the growth in carbon emissions could have been
            even greater.

Energy in 2018: an unsustainable path                                                                               Page | 8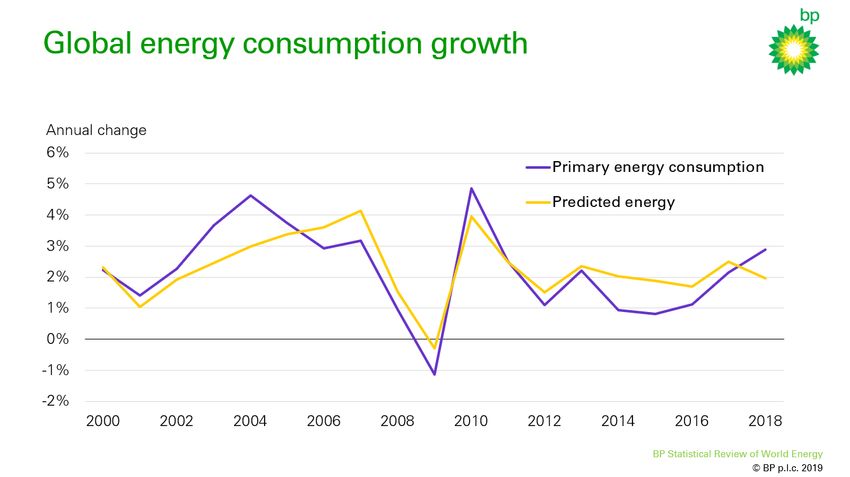
This reflects the fact that year-to-year growth in non-fossil fuels, especially renewable energy, is
            largely determined by policy and technological factors, and so are typically less responsive to cyclical
            movements in energy growth than are oil, gas and coal.

            As a result, strong growth in overall energy demand tends to be associated with a greater-than-
            normal contribution from hydrocarbons, as they expand to balance the system. This shift in the fuel
            mix means the carbon intensity of the fuel mix tends to increase during periods of strong energy
            growth, further adding to carbon emissions.

            And indeed, oil, gas and coal collectively accounted for almost three-quarters of the growth in energy
            demand in 2018 – its highest share for five years. But thankfully much of this growth was in natural
            gas, gaining share relative to coal and oil, such that the improvement in the carbon intensity of the
            fuel mix last year was similar to its recent average.

            Finally in terms of the headline data, what signal might the increasing growth of energy demand and
            carbon emissions in 2018 contain for the future?

            I think this depends in large part on how you interpret the increasing number of heating and cooling
            days last year.

Energy in 2018: an unsustainable path                                                                                  Page | 9
I should stress that this is not my area of competence, but there seems to be (at least) two
possibilities.
On the one hand, to the extent that the unusually high number of hot and cold days last year just
reflects random variation, we might expect weather effects in the future to revert to more normal
levels, allowing the growth in energy demand and carbon emissions to fall back.
On the other hand, if there is a link between the growing levels of carbon in the atmosphere and the
types of weather patterns observed in 2018 this would raise the possibility of a worrying vicious
cycle: increasing levels of carbon leading to more extreme weather patterns, which in turn trigger
stronger growth in energy (and carbon emissions) as households and businesses seek to offset their
effects.
As I said, there are zillions of people better qualified than I to make judgements on this.
But even if these weather effects are short lived, such that the growth in energy demand and carbon
emissions slows over the next few years, the recent trends still feel very distant from the types of
transition paths consistent with meeting the Paris climate goals.
Hopes and reality.
So, in that sense, there are grounds for us to be worried.
That is all I wanted to say in terms of the headline data on energy demand and carbon emissions. My
plan now is to consider the key fuels in a little more detail, starting with oil.
3. Oil and refining
2018 was another rollercoaster year for oil markets, with prices starting the year on a steady upward
trend, reaching the dizzying heights of $85/bbl in October before plunging in the final quarter to end
the year at close to $50/bbl.
Oil demand provided a relatively stable backdrop for this excitement, continuing to grow robustly,
increasing 1.4 Mb/d last year. In an absolute sense, the growth in demand was dominated by the
Energy in 2018: an unsustainable path Page | 10developing world, with China (0.7 Mb/d]) and India (0.3 Mb/d) accounting for around two thirds of the
global increase.
But relative to the past 10 years or so, the big outlier was the US, where oil demand grew by 0.5
Mb/d in 2018, its largest increase for well over 10 years and in sharp contrast to the trend decline
seen in the decade or so prior to the oil price crash of 2014.
The strength in US oil demand in recent years has been concentrated in first gasoline and then diesel,
buoyed by lower prices and economic recovery respectively. But the further step up in growth seen
last year was driven by increased demand for ethane as new production capacity came on stream.
The increased importance of petrochemicals in driving oil demand growth was also evident in the
global product breakdown, with products most closely related to petrochemicals (ethane, LPG and
naphtha) accounting for around half of the overall growth in demand last year.
Against this backdrop of solid demand growth, all the fun and excitement of the fair came from the
supply side, where global production grew by a whopping 2.2 Mb/d, more than double its historical
average.
Energy in 2018: an unsustainable path Page | 11The vast majority of this growth was driven by the 2.2 Mb/d increase in US production, which flowed
almost entirely from increases in tight oil and natural gas liquids (NGLs). There was also growth in
some other non-OPEC countries, led by Canada (0.4 Mb/d) and Russia (0.2 Mb/d).
The increase in US production was the largest-ever annual increase by any country.
Indeed, since 2011 and the onset of the tight oil revolution, US production has increased by over 7
Mb/d – broadly equivalent to Saudi Arabia’s crude oil exports – an astonishing increase which has
transformed both the structure of the US economy and global oil market dynamics. Largely as a
consequence, US net oil imports shrunk to less than 3 Mb/d last year, compared with over 12 Mb/d
in 2005.
There has been much talk recently about the changing structure of L48 production, as Big Oil has
increased its footprint and the incentives for consolidation to exploit the benefits of scale and
contiguous acreage have increased.
Interestingly, this process of consolidation is not yet evident in the extent to which production is
concentrated amongst the top few producers. Indeed, the ratio of total production accounted for by
the top 10 US tight oil producers has declined pretty consistently over the past decade as the tight oil
revolution has taken hold.
Energy in 2018: an unsustainable path Page | 12That said, there is evidence of increasing concentration in investment spending, which may be a
leading indicator for production. And the corresponding ratio for US shale gas production has
increased over the past couple of years to a little over 55% – quite a bit higher. So levels of
concentration may start to increase in coming years.
The extent to which it does could have an important bearing on the future dynamics of US tight oil
production, particularly in terms of its responsiveness to oil prices and to the availability of capital.
Watch this space.
Switching from US production to OPEC: OPEC production fell by 0.3 Mb/d in 2018, with a marked
increase in Saudi Arabian production (+0.4 Mb/d) offset by falls in Venezuela (-0.6 Mb/d) and Iran (-0.3
Mb/d). But this year-on-year comparison doesn’t do justice to the intra-year twists and turns in OPEC
production.
The ride began in the first half of 2018 with the continuation of the OPEC+ agreement from
December 2016, which included OPEC, together with 10 non-OPEC countries led by Russia. The
OPEC+ group consistently overshot their agreed production cuts during 2017 and this overshooting
increased further during the first half of 2018, largely reflecting continuing falls in Venezuelan output.
Energy in 2018: an unsustainable path Page | 13These production cuts helped push OECD inventories below their five year moving average for the
first time since the collapse in oil prices in 2014.
The first major OPEC twist came in the middle of 2018, amid growing concerns surrounding the
possible scale of future supply disruptions. Venezuelan production was continuing to fall. Moreover,
the US announced in May its intention to impose sanctions on all Iranian oil exports.
In response, the OPEC+ group in June committed to achieving 100% compliance of their production
cuts for the group as a whole. This commitment contained two important signals. First, given the
extent to which production was below the target level, it signalled the prospect of an immediate
increase in production. Second, it helped reduce the uncertainty associated with the possibility of
future disruptions to either Iranian and Venezuelan production since the commitment to maintain
“100% compliance” in essence signalled the willingness of other members of the OPEC+ group to
offset any lost production.
And that is exactly what happened between May and November of last year: net production by the
OPEC+ group increased by 900 Kb/d, close to achieving the 100% compliance, despite Iranian and
Venezuelan production falling by a further 1 Mb/d.
Job done. Or was it?
The problem with trying to stabilise oil markets is that there is always some other pesky
development that you hadn’t expected.
In this case, oil production by Libya and Nigeria – neither of which were part of the OPEC+
agreement – increased by almost 600 Kb/d between June and November of last year. As a result,
rather than OECD inventories stabilising, they started to grow again, reversing much of the falls
relative to the five year average. This growing sense of excess supply was compounded by the US
announcing in November that it would grant temporary waivers for some imports of Iranian oil.
Energy in 2018: an unsustainable path Page | 14This triggered another twist: a new OPEC+ group was formed in December of last year – this time
excluding Iran and Venezuela, as well as Libya, but including Nigeria – with a commitment to reduce
production by 1.2 Mb/d relative to October 2018 levels. After a slow start, by the spring of this year,
the reconstituted OPEC+ group was once again overshooting their production cuts. These
reductions, together with further sharp falls in Venezuela production, have been sufficient to cause
inventories to fall back to around their five year average.
It’s tempting to interpret these twists and turns as indicative of OPEC’s waning powers. But I’m not
sure that’s the correct interpretation. The role that OPEC+ played in more than offsetting the falls in
Iranian and Venezuelan output last year was very significant. For me, the twists and turns simply
reflect the difficulty of market management, especially in a world of record supply growth in one part
of the world and heightened geopolitical tensions in others.
It feels like the oil market rollercoaster will run for some time to come.
The gyrations in supply, together with a host of macroeconomic factors, including the festering trade
dispute between the US and China, were reflected in oil prices, which trended higher through much
of the year, before tumbling in the final quarter. For the year as a whole, Brent averaged $71/bbl, up
from $54/bbl in 2017.
Energy in 2018: an unsustainable path Page | 15Turning briefly to refining.
Refinery throughput increased by 1.0 Mb/d in 2018, quite a bit weaker than the increase seen in the
previous year (1.5 Mb/d). Some of this slower growth stems from the easing in overall oil demand
growth, but more important was the strong growth in non-refined liquids, especially the record
growth in the production of NGLs (0.7 Mb/d), which are separately identified in the Statistical Review
for the first time.
Energy in 2018: an unsustainable path Page | 16Despite the smaller increase in refining runs, measured utilisation rates increased for the fourth
consecutive year in 2018 to reach their highest level for more than 10 years. Indeed, taking account
of the large and growing disruptions to refining capacity in Latin America and Africa, ‘effective’
utilisation rates were even higher, as evidenced by utilisation rates outside of Latin America reaching
record high levels. Despite increasing levels of utilisation, margins eased slightly relative to last year
as the impact of Hurricane Harvey unwound and product stock levels increased.
Oil price differentials continued to be dominated by logistical constraints and bottlenecks. The limited
pipeline capacity to transport Canadian heavy oil to the US caused the WTI-WCS differential to blow
out to around $45/bbl in October of last year, before the Albertan government stepped in to regulate
production causing the differential to narrow sharply. Likewise, bottlenecks and constraints
associated with both transporting crude to the Gulf coast and subsequently exporting some of this
crude caused the average Brent-WTI differential to widen to over $6/bbl in 2018.
Energy in 2018: an unsustainable path Page | 174. Natural Gas
Turning next to natural gas.
As I mentioned, 2018 was a bonanza year for natural gas, with both global consumption and
production increasing by over 5%, one of the strongest growth rates in either gas demand or output
for over 30 years.
Energy in 2018: an unsustainable path Page | 18The main actor here was the US, accounting for almost 40% of global demand growth and over 45%
of the increase in production.
US gas production increased by 86 bcm, an increase of almost 12%, driven by shale gas plays in
Marcellus, Haynesville and Permian. Indeed, the US achieved a unique double first last year,
recording the single largest annual increases by any country in both oil and gas production.
In case there was any doubt: the US shale revolution is alive and kicking.
Energy in 2018: an unsustainable path Page | 19The gains in global gas production were supported by Russia (34 bcm), Iran (19 bcm) and Australia
(17 bcm).
Although some of the increase in US gas supplies was used to feed the three new US LNG trains
which came on stream last year, the majority was used to quench the thirst of domestic demand.
US gas consumption increased by 78 bcm last year – to put that in context, that is roughly the same
growth as achieved over the previous six years in the US; or broadly equivalent to the entire gas
consumption of the UK.
You will not be surprised to hear that this exceptional strength appears to be largely driven by the
same weather-related effects, with rising demands for space heating and cooling fuelling increased
gas consumption, both directly in commercial and residential buildings, and, more importantly,
indirectly via growing power demand. The expansion of gas consumption within the US power sector
was further boosted by around 17 gigawatts of coal-fired generation capacity being retired last year.
Overall, the growth in gas-fired power generation accounted for around half of the increase in US gas
consumption last year.
Energy in 2018: an unsustainable path Page | 20Outside of the US, the growth in global gas demand was concentrated across three other countries:
China (43 bcm), Russia (23 bcm) and Iran (16 bcm), which together with the US, accounted for 80%
of global growth.
China gas consumption grew by an astonishing 18% last year. This strength stemmed largely from a
continuation of environmental policies encouraging coal-to-gas switching in industry and buildings in
order to improve local air quality, together with robust growth in industrial activity during the first half
of the year.
These coal-to-gas switching polices have been instrumental in increasing Chinese gas consumption
by over a third in the past two years alone. Official estimates suggest that as many as 10 million
households – roughly half the number of households in the UK – switched from coal-to-gas boilers
over this 2-year period, with even greater switching in the industrial sector.
Importantly, a series of improvements in import capacity, distribution and demand management
meant that this second successive year of rapid growth in Chinese gas consumption was achieved
largely without a repeat of the price spikes and shortages which characterised the winter of 2017/18,
with increased imports from both LNG and pipelines.
Energy in 2018: an unsustainable path Page | 21Global LNG supplies continued their rapid expansion last year, increasing by almost 10% (37 bcm) as
a number of new liquefaction plants in Australia, US and Russia were either started or ramped up.
For much of the year, the strength of Asian gas demand, led by China, was sufficient to absorb these
increasing supplies. But a waning in the strength of Asian demand towards the end of the year,
Energy in 2018: an unsustainable path Page | 22combined with a mini-surge in LNG exports, caused prices to fall back and the differential between
Asian and European spot prices to narrow significantly.
Asian prices have fallen further in the first part of this year, towards the bottom of the price band
defined by US exporters’ full-cycle and operating costs. The prospect of further substantial expansion
of LNG supplies this year means there is a possibility of a first meaningful curtailment of some LNG
supply capacity.
The extent of any eventual shut-in will depend importantly on the European market, which acts as the
de facto ‘market of last resort’ for LNG supplies.
Europe’s gas demand contracted by a little over 2% (11 bcm) last year, but this fall in demand was
more than matched (-13 bcm) by continuing declines in Europe’s aging gas fields. The small increase
in European gas imports was largely met by LNG cargos diverted from Asia towards the end of the
year as the Asian premium over European prices almost disappeared.
Russian pipeline exports to Europe were largely unchanged on the year, maintaining the record levels
built up in recent years, although with a slight decline in their share of Europe’s gas imports. A key
factor determining the role that Europe will play in balancing the global LNG market over coming
years will be the extent to which Russia seeks to maintain its market share.
Energy in 2018: an unsustainable path Page | 235. Coal
2018 saw a further bounce back in coal – building on the slight pickup seen in the previous year –
with both consumption (1.4%) and production (4.3%) increasing at their fastest rates for five years.
This strength was concentrated in Asia, with India and China together accounting for the vast
majority of the gains in both consumption and production.
The growth in coal demand was the second consecutive year of increases, following three years of
falling consumption. As a result, the peak in global coal consumption which many had thought had
occurred in 2013 now looks less certain: another couple of years of increases close to that seen last
year would take global consumption comfortably above 2013 levels.
The growth in coal consumption was more than accounted for by increasing use in the power sector.
This is despite continuing strong growth in renewables: renewable energy increased by over 25% in
both India and China last year, which together accounted for around half of the global growth in
Energy in 2018: an unsustainable path Page | 24renewable energy. So really rapid growth. But even this was not sufficient to keep pace with the
strong gains in power demand, with coal being sucked into the power sector as the balancing fuel.
This highlights an obvious but important point: even if renewables are growing at truly exceptional
rates, the pace of growth of power demand, particularly in developing Asia, limits the pace at which
the power sector can decarbonize.
We can explore this point in more detail by looking at the power sector specifically.
6. Power sector and renewable energy
As I have bored many of you for several years now, the power sector needs to play a central role in
any transition to a low carbon energy system: it is the single largest source of carbon emissions
within the energy system; and it is where much of the lowest-hanging fruit lie for reducing carbon
emissions over the next 20 years.
So what happened last year?
Energy in 2018: an unsustainable path Page | 25Global power demand grew by 3.7%, which is one of the strongest growth rates seen for 20 years,
absorbing around half of the growth in primary energy.
The developing world continued to drive the vast majority (81%) of this growth, led by China and
India who together accounted for around two thirds of the increase in power demand.
But the particularly strong growth of power demand in 2018 owed much to the US, where power
demand grew by a bumper 3.7%, boosted by those weather effects, in sharp contrast to a slight
trend decline seen over the past 10 years.
On the supply side, the growth in power generation was led by renewable energy, which grew by
14.5%, contributing around a third of the growth; followed by coal (3.0%) and natural gas (3.9%).
China continued to lead the way in renewables growth, accounting for 45% of the global growth in
renewable power generation, more than the entire OECD combined.
One feature of last year’s data is that the increase in wind and solar capacity flattened out in 2018 at
around 150 GW. This is at odds with much of the past 20 years where the scale of capacity increases
has tended to increase year after year. Although it’s important not to overplay this flattening: the
growth in renewable capacity last year was still at its highest ever level.
Energy in 2018: an unsustainable path Page | 26The growth in power generation was also close to its highest ever increase, with wind and solar
providing broadly similar increments.
Stepping back from this year’s data and looking at the growth of renewables over a longer period,
these two histograms summarise the increasing adoption and penetration of renewable energy over
the past 20 years, focussing on the 78 major countries which are individually tracked in the Stats
Review.
Energy in 2018: an unsustainable path Page | 27Going back 20 years to 1998, only around a third of the tracked countries had any form of renewable
power, with the vast majority of those countries with renewable energy employing only very small
quantities, clustered in the 1-5% range of domestic power generation.
Fast-forward 20 years to 2018 and the picture has changed quite substantially. Three-quarters of the
tracked countries have adopted some form of renewable energy, with the degree of penetration
pretty evenly spread across the range.
Renewable energy has come of age.
The 13 countries in the 20%+ penetration range are almost entirely European, with the only
exception being New Zealand.
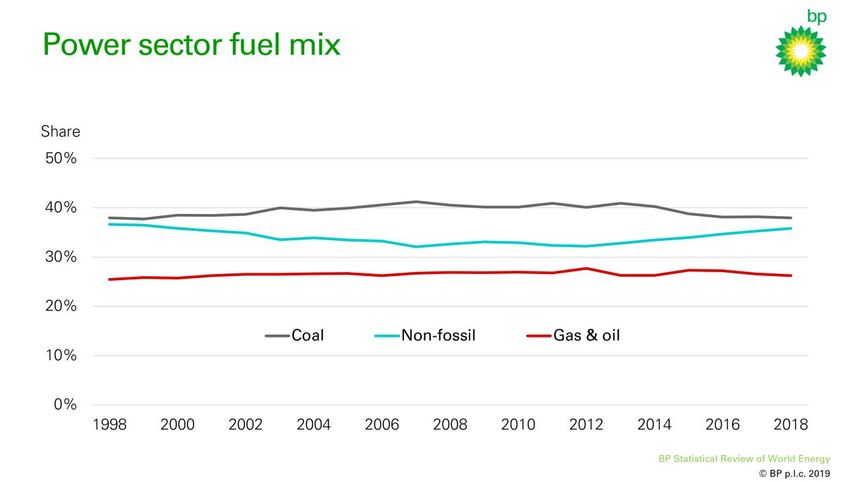
But to repeat a point I made last year, despite the increasing adoption and penetration of renewable
power, the fuel mix in the global power system remains depressingly flat, with the shares of both
non-fossil fuels (36%) and coal (38%) in 2018 unchanged from their levels 20 years ago.
Three flat lines.
Energy in 2018: an unsustainable path Page | 28This persistence in the fuel mix highlights a point that the International Energy Agency (IEA) and
others have stressed recently; namely that a shift towards greater electrification helps as a pathway
to a lower-carbon energy system only if it goes hand-in-hand with a decarbonization of the power
sector.
Electrification without decarbonizing power is of little use.
In that vein, carbon emissions from the power sector are estimated to have increased by 2.7% in
2018, their highest rate of growth for seven years, accounting for around half of the growth in global
carbon emissions.
For much of the past 20 years, changes in the carbon intensity of the power sector have been
relatively small (or even perverse), such that increases in power demand fed through directly into
higher carbon emissions.
Energy in 2018: an unsustainable path Page | 29Electrification without decarbonization.
Over the past five years or so, the rapid growth in renewable energy, together with an edging down
in the coal share, has led to a more sustained improvement in the carbon intensity of the power
sector, such that the impact of increasing power demand on carbon emissions has been partially
offset.
But it’s still only partial: despite the rapid gains in renewable energy, the pace of growth in power
demand has meant that overall carbon emissions from the power sector have increased substantially
over the past three years.
It hasn’t been possible to decarbonize the power sector quickly enough to offset the growth in
demand.
To give a sense of the challenge posed by the strength of growth in power demand, I did a simple
thought experiment of the extent to which the mix of fuels used by the power sector would have
needed to change over the past three years to maintain the level of carbon emissions from the power
sector at its 2015 level, for the same growth in power demand.
That is, the pace of decarbonization necessary to offset the entire growth in demand.
Energy in 2018: an unsustainable path Page | 30If we focus solely on renewable energy, renewable generation over the past three years would need
to have grown more than twice as quickly than it actually did. Rather than growing by a little over 800
Twh over the past three years, renewable generation would have needed to grow by over 1800 Twh.
A staggering number: that additional renewable generation of around 1000 Twh is roughly equivalent
to the entire renewable generation of China and the US combined in 2018.
So in addition to the rapid growth in renewable generation we actually saw, the world would have
also needed to have added the entire renewable generation of China and the US, in just three years,
just to keep carbon emissions from the power sector flat.
Alternatively, the same outcome for carbon emissions could have been achieved by replacing around
10% of coal in the power sector with natural gas.
The intuition is that renewables are still a relatively small share of power generation relative to coal,
and so the proportional movements in coal are a lot smaller.
I took two points from this simple thought experiment.
First, the general point that the robust growth in power demand, particularly in the developing world,
greatly adds to the difficulty of decarbonizing the power sector.
Energy in 2018: an unsustainable path Page | 31You have to run very fast just to stand still.
Second, relying solely on renewables to achieve this is an almost impossible task.
Rapid growth in renewable energy is essential but it’s unlikely to be sufficient.
This highlights the importance of adopting a range of technologies and fuels; rather than just relying
on renewables.
To win the race to Paris, the world is likely to require many fuels and technologies for many years to
come.
This includes widespread coal-to-gas switching; significant adoption of carbon capture use and
storage (CCUS); and increasing energy efficiency, especially in the developed world, where the vast
majority of people already enjoy relatively high levels of electricity consumption.
7. Conclusions
Let me conclude.
At a time when society is increasing its demands for an accelerated transition to a low carbon energy
system, the energy data for 2018 paint a worrying picture, with both energy demand and carbon
emissions growing at the fastest rates seen for years.
As I explained, in a statistical sense, it’s possible to explain this acceleration in terms of a
combination of weather-related effects and an unwinding of cyclical movements in China’s pattern of
growth.
What is less clear is how much comfort we can take from this explanation.
What does seem fairly clear is that the underlying picture is one in which the actual pace of progress
is falling well short of the accelerated transition envisaged by the Paris climate goals.
Last year’s developments sound yet another warning alarm that the world is on an unsustainable
path.
Energy in 2018: an unsustainable path Page | 32It is sometimes said that history is written by the victors.
Although the Statistical Review provides a history of sorts, it is a very specific, near-term, history:
documenting the developments in the global energy system in the previous year.
In that context, the only victors are the power of comprehensive, objective data.
The data write the story.
That is the role the Stats Review has been playing for the past 68 years.
More importantly, looking ahead, I hope that the understanding and insight provided by future
Statistical Reviews will continue to inform judgements and decisions as society navigates its path to
a low carbon energy system.
Energy in 2018: an unsustainable path Page | 33You can also read