COUNTRY PROFILE PAKISTAN - Climate Analytics
←
→
Page content transcription
If your browser does not render page correctly, please read the page content below
COUNTRY PROFILE PAKISTAN
DECARBONISING SOUTH AND SOUTH EAST ASIA
Shifting energy supply in South Asia and South East Asia to non-fossil
fuel-based energy systems in line with the Paris Agreement long-term
temperature goal and achievement of Sustainable Development Goals
MAY 2019
This country profile is part of the Decarbonising South and South East Asia report
and examines how to shift the energy supply in South Asia and South East Asia to
non-fossil fuel-based energy systems in line with the Paris Agreement long-term
temperature goal and achievement of Sustainable Development Goals.

Find links to other country profiles and the full report below.

                                                                                Bangladesh
                                                                                      India
                                                                                 Indonesia
                                                                                  Pakistan
                                                                                Philippines
                                                                                  Thailand
 Webpage                                                                          Vietnam
 Full report
 Executive Summary

Authors                  Ursula Fuentes Hutfilter               Paola Yanguas Parra
                         Anne Zimmer                           Andrzej Ancygier
                         Fahad Saeed                           Robert Brecha
                         Bill Hare                             Jessie Granadillos
                         Tina Aboumahboub                      Gaurav Ganti
                         Ilsa Kelischek                        Raghuveer Vyas
                         Carl-Friedrich Schleussner            Michiel Schaeffer

A digital copy of this report along with supporting appendices is available at:
www.climateanalytics.org/publications

This report has been prepared under the project “Pilot Asia-Pacific Climate
Technology Network and Finance Centre”, an initiative of UN Environment and the
Asian Development Bank (ADB), funded by the Global Environment Facility (GEF).

                                Supporting science based policy to prevent dangerous
                                climate change enabling sustainable development

                                www.climateanalytics.org
Key Messages
Climate change impacts – Paris Agreement temperature goal matters for Pakistan
• Pakistan is one of the world’s most vulnerable countries to climate change.
Extreme events have incurred huge human and economic losses in recent years.
• Pakistan is already highly vulnerable to the climate change at present level of
global warming of about 1°C above pre-industrial levels.
• In 3°C warmer world, annual precipitation is projected to increase sixfold
compared with 1.5°C.
• Fatalities due to extreme heat can be avoided by limiting warming to 1.5°C.
• A warmer world beyond 1.5°C would commit the coast lines to around 2m sea
level rise in the long run.
Pakistan’s energy system: large increase in fossil fuel based infrastructure
• Pakistan’s share of fossil fuel sources in total energy consumption has risen from
below 59% in 2000 to almost 62% in 2014, but the share of fossil fuels in electricity
production has decreased substantially from close to 72% in 2000 to 63% in 2015.
• The share of coal in electricity production has remained low, even decreasing
slightly, as oil and gas are the predominant fuels in Pakistan’s energy mix.
• The utilisation of solar and wind energy resources is limited, with installed
capacities representing a mere 1.5% and 3% of the total installed capacity
respectively.
• Pakistan is undertaking a major expansion of electricity generation capacity to
meet growing demand, as energy access progresses. Current expansion plans
include a massive growth in coal capacity, in an effort to overcome the over-
reliance on imported fossil fuels.
• Construction of these coal power plants could lock in Pakistan’s energy system into
a carbon intensive path for decades and would be a huge missed opportunity for
building a carbon-free and climate-resilient energy system that would be
compatible with the achievement of multiple Sustainable Development Goals.
Decarbonising South & South East Asia - Country Profile - Pakistan 1Transition to renewable energy offers massive benefits for Pakistan
• Pakistan has relatively good solar potential, and covering 1.5% of Pakistan’s land
area with optimally oriented PV panels could potentially generate 32 times as
much electricity as the total current consumption. The Southwestern region of
Pakistan also offers significant wind potential.
• Investing in renewable energy capacities can contribute to strengthening energy
independence, leading to lower expenditures on fossil fuel imports, less
susceptibility to international market price fluctuations or geopolitical shocks.
• The decentralised nature of many renewable technologies can foster progress
with regard to reliable energy access, addressing load shedding problems and
eradication of energy poverty.
• Improving access to clean technologies for cooking also contributes to reducing
indoor air pollution and related health hazards. Outdoor air pollution could be
reduced as well by shifting away from fossil fuel combustion.
• Renewable energy technologies provide opportunities for local employment.
Targets, projections, and Paris Agreement benchmarks
• Pakistan’s NDC commits the country to a 20% reduction in emissions below
Business-as-Usual by 2030.
• Current plans to develop domestic coal production and expansion of coal-fired
power are not in line with the need to decarbonise the energy system and phase
out coal for power generation by 2040, as a Paris Agreement compatible pathway
for South Asia shows.
• There is significant scope to develop an ambitious long-term strategy towards
100% renewable energy power generation and electrification of end use sectors,
to align Pakistan’s energy future with the goals of the Paris Agreement and reap
benefits for sustainable development.
Decarbonising South & South East Asia - Country Profile - Pakistan 2Introduction
Pakistan is one of the world’s most populous countries and a large part of its population is poor; more
than 75% live under 5.50$ a day. After the green revolution in the 1960s, Pakistan constructed several
dams to fulfill its irrigation and energy needs, and hydropower served as a mainstay of its energy mix
for a long time afterwards. With the growing needs of its burgeoning population, the inclusion of fossil
fuels kicked in, which currently has a share of approximately 62% in the country’s total energy.
In the past 15 years, the country has witnessed long hours of load shedding severely impacting the
industrial production, thereby hampering the exports, mainly in the textile sector, ultimately resulting
in joblessness. To overcome this problem, the successive governments relied heavily on imported fuels,
which is likely to continue in future. There is a serious threat that these investments, especially in coal
power plants, could lock Pakistan’s energy system into a carbon intensive path for decades, which
ultimately would compound its vulnerability to climate change and associated extremes.
Considering the improvements as well price drop in renewable technologies in recent years, there is a
huge potential for Pakistan to meet its energy requirements based on renewable technologies. Besides
providing clean energy and a healthy environment, a significant co-benefit of renewables is the
provision of additional jobs. With a large part of its population under the age of thirty, it is imperative
for the country to ride the wave of renewables, which will have long-lasting positive effects for the
economy as well as its social fabric.
1 Climate Change Impacts: Risks, vulnerability and benefits of
limiting mean temperature rise to 1.5°C
1.1 Present day vulnerabilities and risks
In the past thirty years, Pakistan has seen a number of climate disasters (Table 1). Flooding events have
come up as the most frequent and devastating climate disaster in the last 30 years, resulting in 11 000
fatalities and $20 billion losses to the economy. This is followed by storm events in terms of financial
losses, however recent years have seen devastating heatwaves causing score of deaths in urban centers
of the country. Pakistan is one world’s most vulnerable countries to climate change, ranked 8th in the
Germanwatch long-term climate risk index1 (Eckstein, Hutfils, & Winges, 2018).
Table 1: Climate disaster statistics for Pakistan based on EMDAT database2 for the period 1989-2018
Disaster Type Events Count Total Deaths Total affected Damage
(million people) (million US$)
Drought 1 143 2.2 247
Extreme
15 2759 0.08 18
temperature
Floods 75 11 104 64.3 19 911.3
Storm 18 1 424 2.2 1 710.9
1 The Germanwatch Global Climate Risk Index is an analysis based on one of the most reliable data sets available on the impacts of
extreme weather events and associated socio-economic data. However, the index must not be mistaken for a comprehensive climate
vulnerability scoring. It represents climate-related impacts and associated vulnerabilities but, for example, does not take into account
important aspects such as rising sea-levels, glacier melting or more acidic and warmer seas. https://germanwatch.org/en/cri
2 https://www.emdat.be
Decarbonising South & South East Asia - Country Profile - Pakistan 31.2 Projections on climate impacts comparing 1.5°C and temperature increase under
current pledges
If global mean temperature would increase by 3°C above pre-industrial levels, which corresponds to the
warming that would result from the current NDCs, flood risks and heat extremes project a significantly
higher increase than in a 1.5°C warmer world. Projections for heat extreme show that temperatures
might reach up to more than 46°C in a 3°C warmer world, bearing severe implications for the population
having no access to appropriate cooling facilities or outside activities and labour.
Table 2: Future projections of different climatic variables averaged over Pakistan, based on an ensemble of CMIP5 Global
Climate Models for 1.5°C and 3°C warmer than pre-industrial worlds 3
Indicator Historical +1.5°C World +3.0°C World
(1986–2015) (Paris Agreement) (Current NDCs)
Annual Averages
Near-Surface
18.6 +1.5 +3.6
Air Temperature (°C)
Precipitation (mm) 312.25 +2% +12.2%
Extreme Events
Drought:
95 +4.4 +2.1
Consecutive drought days (Days)
Heat: Annual Maximum of Daily
43 +1.2 +3.3
maximum Air Temperature (°C)
Flooding:
Annual Maximum 5-day Consecutive 59 +2% +4.4%
Precipitation (mm)
Table 3: Future projections of Sea Level Rise (cm) as compared to today’s level for Pakistan based on the data from Robert
Kopp et al. (2014). Average values of 1 tide gauged stations across Pakistan are presented. The values in the brackets in the
left column are the temperature difference for each future scenario between the end of 21st century (2081-2100) and pre-
industrial period (1850-1900)
Sea Level Rise (cm) 2050 2100 2150 2200
RCP 2.6 (1.6°C) 24 50 71 96
RCP 4.5 (2.4°C) 25 60 95 128
RCP 8.5 (4.3°C) 28 81 136 199
Pakistan has a coastline, which makes it vulnerable to sea level rise (SLR) due to global warming. Paris
Agreement limit of 1.5°C would result in substantially lower sea level rise than for higher levels of
warming, in particular in the long run, with a sea level rise of around 2 meters instead of 1 m by the end
of the 22nd century in a 4.3°C world compared with a 1.6°C warmer world (Table 3)4. Risks posed by
3 The presented values are based on an ensemble of general circulation models (GCMs) from CMIP5 archive. Global Mean Temperature
(GMT) increase of 1.5°C and 3°C above pre-industrial levels are derived for 20-year time slices with the respective mean warming for
each model separately. The warming levels are derived relative to the historical period 1986-2005 and this period is considered to be
0.6°C warmer than pre-industrial levels (1850–1900). For definitions of extremes indicators, please see (Schleussner et al., 2016)
4 Due to a lack in the scientific literature, we cannot yet provide projections for a 1.5°C scenario. However, global sea level rise by 2100 is
about 10cm lower under a warming at 1.5°C compared to a 2°C scenario [IPCC 1.5°C Special Report]. Beyond 2100, only limiting
warming to 1.5°C may limit global sea level rise to below 1m,at least 0.5m less than what a 2°C would entail.
Decarbonising South & South East Asia - Country Profile - Pakistan 4tropical cyclones for Pakistan are projected to increase substantially. Under a 2.4°C scenario, the
number of Category 4 and 5 cyclones will increase by about 130% (Bhatia, Vecchi, Murakami,
Underwood, & Kossin, 2018). The severity of the tropical cyclone hazard will be further amplified by
increases in extreme precipitation and sea level rise.
2 Socio-economic context
2.1 Economic background
Table 4: Overview on socio-economic characteristics and development over time (Pakistan)
Indicators on economic and human development Source 2000 2010 Most recent
(2017)
Per capita GDP/capita in current US$ WB-WDI 534 1,040 1,548
income
GDP/capita adjusting for purchasing
power (in PPP, constant 2011 WB-WDI 3,495 4,284 5,035
international $)
Economic GDP growth rate per capita
WB-WDI 1.9% -0.5% 3.7%
growth (annual, in %)
Human Human Development Index (HDI) 0.562
UNDP 0.450 0.526
development (Rank 150)
Population Population in millions WB-WDI 139 171 197
Notes: PPP – Purchasing Power Parity. GDP – Gross Domestic Product.
Sources: WB-WDI – World Bank World Development Indicators (The World Bank, 2019). UNDP – United Nations Development
Program (United Nations Development Program, 2018a).
Pakistan has a population of almost 200 million people. The World Bank has classified it as a “lower
middle-income country” since 2008. Between 2000 and 2017, Pakistan has almost tripled its per capita
income (in US$); adjusting for purchasing power it has increased its per capita income from below 3500
to over 5000 (PPP) (Table 4). After a period of slow or even negative economic growth rates (per capita),
Pakistan’s per capita GDP growth has accelerated again in recent years with rates of above 2% since
2013 increasing to 3.7% in 2017 (The World Bank, 2019). Yet, with widening macroeconomic
imbalances, the World Bank sees macroeconomic stability as a major concern for Pakistan’s near term
economic future (The World Bank, 2018a).
Pakistan made progress in reducing poverty, decreasing the share of people living in extreme poverty
(with less than 1.90$ (2011 PPP) a day) from 28.6% in 2001 to 4% in 2015 (The World Bank, 2019).
However, in 2015 still over 75% of the people in Pakistan lived on less less than 5.50$ (2011 PPP) a day,
compared with over 93% in 2001 (The World Bank, 2019).
Between 1990 and 2017, Pakistan has increased its Human Development Index (HDI) value from 0.404
to 0.562, an increase of about 39% (United Nations Development Program, 2018b). Pakistan’s 2017 HDI
is below the average of all countries in the HDI-category of ‘medium human development’, and also
below the average for countries in South Asia (United Nations Development Program, 2018b). When
Pakistan’s 2017 HDI value is discounted for inequality, it falls to 0.387, a loss of almost 31% due to
inequality (United Nations Development Program, 2018b).
Decarbonising South & South East Asia - Country Profile - Pakistan 52.2 Energy System status and historic development
Table 5: Energy system indicators for Pakistan: current status and recent development
Energy system indicators Source 2000 2010 Most recent
Value Year
Primary Energy Energy intensity level of primary
intensity of the energy
WB-WDI* 5.54 4.87 4.57 2017
economy (MJ/$2011 PPP GDP)
(energy / GDP)
Carbon intensity kg CO2 per MJ energy use
WB-WDI 69.57 79.48 77.46 2014
of energy
Carbon emissions t CO2 /population
EDGAR 0.78 0.89 0.92 2016
per capita+
Fossil fuel share Share in total primary energy (%)
WB-WDI 58.57 60.27 61.59 2014
in total energy
Electricity use Electric power consumption (kWh
WB-WDI 372.40 465.16 471.04 2014
per capita)
Fossil fuel share Electricity production from oil, gas
in electricity and coal sources WB-WDI 71.83 62.67 63.09 2015
production (% of total)
Share of coal in Electricity production from coal
electricity sources WB-WDI 0.35 0.09 0.14 2015
production (% of total)
Modern RE share Electricity production from
in electricity renewable sources, excluding
WB-WDI 0.00 0.00 0.76 2015
production hydroelectric
(% of total)
Renewable Installed RE capacity
IRENA
energy capacities (in MW)
Wind (onshore) 0 0 792 2017
Wind (offshore) - - - -
Solar (Concentrated) - - - -
Solar (Photovoltaic) 0 0 730 2017
Biogas 0 0 9 2017
Bioenergy (Solid Biomass) 216 254 365 2017
Hydropower 4,978 6,743 7,407 2017
Geothermal - - - -
Notes:*Calculation of most recent value based on latest available WB-WDI data and growth rates from BP (BP,
2018). +CO2 emissions do not include emissions from LULUCF. PPP – Purchasing Power Parity. GDP – Gross
Domestic Product.
Sources: WB-WDI – World Bank World Development Indicators (The World Bank, 2019). IRENA – International
Renewable Energy Agency Database (IRENA, 2019). EDGAR emissions database (JRC, 2016).
Decarbonising South & South East Asia - Country Profile - Pakistan 6Total energy use in Pakistan has increased by 40% between 2000 and 2014 (The World Bank, 2019). In per capita terms however, Pakistan’s energy use has increased only by about 5% between 2000 and 2014 and was only about a quarter of the world average in 2014 and only about 75% of the average lower middle income country energy use (The World Bank, 2019). Pakistan has managed to substantially decrease the energy intensity of its economy between 2000 and 2017. However, the carbon intensity of energy has increased between 2000 and 2014, Pakistan’s share of fossil fuel sources in total energy consumption has risen from below 59% in 2000 to almost 62% in 2014 (see Table 5). Pakistan’s CO2 emissions per capita5 have risen from 0.78 to 0.92 metric tons of CO2 per capita between 2000 and 2016 (see Table 5), but remaining very low compared to the world’s average of 4.8 tCO2/capita (JRC, 2016). Between 2000 and 2014, electricity consumption per capita has only increased rather moderately in Pakistan. With 471 kWh per capita, Pakistan’s electricity consumption remains comparably low, amounting to below 15% of the world’s average per capita electricity consumption (3127 kWh/capita) and only 61% of the average electricity consumption of lower middle income countries (767 kWh/capita) in 2014 (The World Bank, 2019). The CIA World Factbook estimates that Pakistan’s electricity consumption has risen to 478 kWh/capita in 2016 (CIA, 2019). The share of fossil fuels in electricity production has decreased substantially from close to 72% to 63% between 2000 and 2015, and the share of coal in electricity production has remained at a low level, even decreasing slightly from 0.4% (2000) to 0.1% (2015), as oil and gas are the predominant fuels in Pakistan’s energy mix. At the same time, the share of electricity produced from renewable sources (excluding hydro) has increased slightly from 0% in 2010 to 0.8% in 2015, yet remaining very low despite recent added capacities in wind (onshore), solar PV and also solid biomass. Hydropower capacities have almost doubled between 2000 and 2017 (see Table 5). Including hydro, the share of RE in total electricity output was 31.4% in 2015 (The World Bank, 2019). Between 2000 and 2014, Pakistan achieved to decrease the share of electric output lost due to transmission and distribution losses from 24% to 17% (WDI). However, the World Bank estimates that power sector inefficiencies still cost Pakistan’s economy around 18 billion USD or 6.5% of its GDP (The World Bank, 2018b). 5 Excluding carbon emissions from land-use, land-use change and forestry. Decarbonising South & South East Asia - Country Profile - Pakistan 7
2.3        Energy system and sustainable development – potential for benefits of a
           transition to renewable energy

Table 6: Indicators showing sustainable development implications of the current energy system and potential for benefits of
a transition to renewable energy (co-benefits) (Pakistan)

Indicators for co-benefits potential                                              Source             Most recent
                                                                                                  Value          Year
Fuel import                    Share of national income (GDP) spent on fuel
                                                                                WB-WDI +           4.5          2017
dependency                     imports (%)
                               Public expenditures spent on fuel imports (in
                                                                                WB-WDI +          13.8          2017
                               billion current US$)
Reliability of electricity Share of firms experiencing electrical outages
                                                                                 WB WDI           81.1          2013
supply                     (%)
                               Power outages in firms in a typical month
                                                                                 WB WDI            75           2013
                               (number)
                               Share of sales lost for firms subject to power
                                                                                 WB WDI           33.8          2013
                               outages (%)
Access to modern               Share of population with access to electricity
                                                                                 WB WDI           99.1          2016
energy                         (in %)
                               Share of rural population with access to
                                                                                 WB WDI           98.8          2016
                               electricity (in %)
                               Share of urban population with access to
                                                                                 WB WDI           99.7          2016
                               electricity (in %)
                               Share of primary schools with access to             SDG-
                                                                                                   NA             NA
                               electricity (in %)                                database
                               Share of population with access to clean fuels
                                                                                 WB WDI           43.3          2016
                               or technologies for cooking (in %)
Indoor air pollution           Number of deaths attributed to indoor air           SDG-
                                                                                                  101           2016
and health impacts             pollution* (per 100 000 inhabitants)              database
Outdoor air pollution          Share of population exposed to levels of fine
and health impacts             particulate matter (PM 2.5) exceeding WHO         WB WDI          100.0          2016
                               guidelines (in %)
                               Number of deaths attributed to ambient air          SDG-
                                                                                                   98           2016
                               pollution* (per 100 000 inhabitants)              database

Note: *age standardised mortality rate of WHO. +Own calculations based on WB-WDI. GDP – Gross Domestic Product. WHO –
World Health Organisation.

Sources: WB WDI – World Bank World Development Indicators (The World Bank, 2019). SDG-database -Sustainable
Development Goals data base (United Nations, 2019).

Facing limited possibilities to expand domestic natural gas production, Pakistan has to meet gas demand
by imports. In 2016, it signed a long-term (15 years) import agreement with Qatar on annual liquified
natural gas (LNG) imports (IRENA 2018). Additionally, almost one third of Pakistan’s oil demand needs
to be met by imports (IRENA 2018). The substantial decrease in international oil prices in recent years
has contributed to Pakistan’s success in improving its economic situation, but with natural gas and oil

Decarbonising South & South East Asia - Country Profile - Pakistan                                                       8
being the predominant energy sources in its fuel mix, this increasing import dependency is not only a budgetary burden, it also exposes Pakistan to the risks of price volatility on international markets (IRENA - International Renewable Energy Agency, 2018). In 2017, Pakistan has spent about 4.5% of its GDP on fuel imports, amounting to public expenditures of about 13.8 billion USD (see Table 6). A transition to renewable energy could contribute to reducing energy security concerns and public expenditures on fossil fuel imports freeing resources for other investments. The unreliability of electricity supply is very a serious issue in Pakistan, affecting private households as well as businesses and industry. Electricity supply falls far short of electricity demand with a demand- supply-gap of about 6 GW in 2016 (IRENA 2018), leading to serious load shedding issues. In many regions electricity supply is limited to only a few hours a day (Wakeel & Jahangir, 2016). Over 80% of businesses in Pakistan report to have been affected by power outages in 2013, with on average 75 outages every month (see Table 6). These firms are estimated to have about a third of their sales (33.8%) due to the outages. While official data on the share of population with access to modern energy suggest that Pakistan had almost full coverage in 2016 (around 99% of the population), the IEA energy access database6 estimates the share to be only around 73.6% in 2016 (63.2% in rural areas and 89.6% in urban areas), leaving about 50.9 million people without access to electricity. Given the poor quality and reliability of electricity supply, also many households with access to electricity still suffer from energy poverty. In 2016, the share of people with access to clean cooking fuels was still officially 43.3%, leaving more than four fifths of the population exposed to health hazards from indoor air pollution due to the burning of traditional biomass inside of dwellings. Accounting for age structure, about 101 out of every 100 000 inhabitants in Pakistan die due to indoor air pollution. The World Health Organisation (WHO) estimated the number of deaths attributed to indoor air pollution in Pakistan to amount to over 127 000 in 2016 (World Health Organisation, 2018). Outdoor air pollution is also a serious health concern in Pakistan, especially in urban areas. In 2016, all of its population was exposed to fine particulate matter concentration levels exceeding recommended limits by the WHO. The number of deaths attributed to outdoor air pollution in Pakistan is estimated to amount to about 121 000 in 2016 (World Health Organisation, 2018) – with about 98 out of 100 000 inhabitants dying because of outdoor air pollution. 3 Policies and projections on future development In its NDC Pakistan states that its GHG emissions are expected to increase by 300% between 2015 and 2030. It commits to reduce its 2030 emissions by 20% compared with this scenario. This is conditional on availability of international grants “to meet the total abatement cost for the indicated 20 percent reduction amounting to about US$ 40 billion at current prices” (The Government of Pakistan, 2015). Pakistan’s electrification rate in 2016 was 99.15%, with 99.67% of the urban population and 98.81% of the rural population having access to electricity (ESMAP, 2019). Electricity in Pakistan is generated in roughly equal shares from natural gas, furnace oil and hydropower (Perwez, Sohail, Hassan, & Zia, 2015). To increase the share of other sources of energy in 2006 it adopted Alternative and Renewable Energy Policy 2006, which led to the initiation of renewable energy infrastructure projects (IRENA, 2018). In 2015, NEPRA (National Electric Power Regulatory Authority) approved the implementation of a net metering program, which will allow for solar and wind generators to sell produced electricity back to the national grid, provided the generators have a capacity of less than 1MW. Residential, commercial and industry owners that meet these standards are eligible to engage in the scheme (NEPRA, 2015). The 6 https://www.iea.org/energyaccess/database/ Decarbonising South & South East Asia - Country Profile - Pakistan 9
State Bank of Pakistan also released a financing scheme in 2016 that will finance renewable energy
projects with a capacity of between 1MW and 50MW. Up to 100% refinancing of debt is available
through the project (State Bank of Pakistan, 2016).

    BOX: relevant key policies related to energy supply sector

  • Nationally Determined Contribution: A target of reducing the projected GHG emissions in 2030 by 20%,
    conditional on financial support in the range of USD 40 billion necessary to finance the costs of achieving
    this target (The Government of Pakistan, 2015).
  • Net metering: instituted a net metering program to allow renewable energy generators smaller than 1 MW
    to sell their energy into the national grid at the average off peak rate (NEPRA, 2015).
  • Financing Scheme for Renewable Energy: Financed by the State of The State Bank of Pakistan it is available
    for projects between 1-50 MW (State Bank of Pakistan, 2016).
  • Auctions for wind and solar: The auctions introduced in 2016 replaced the fixed feed-in tariffs. So far a
    limited number of auctions took place (PVTech, 2017).

4          Projections on planning for coal
Pakistan is undertaking a major expansion of electricity generation capacity to meet growing demand,
as energy access progresses. However, despite price advantage and domestic availability of renewable
energy resources, current expansion plans favour fossil fuels based generation, and include a massive
growth in coal capacity. Current plans for construction of polluting power plants relying on fossil fuel
imports poses a number of problems going forward. Growing emissions and other externalities
associated to coal will increase substantially under current plans, exacerbating Pakistan’s vulnerability
to climate change impacts. Moreover, the current energy planning put Pakistan on a path to deepening
its over-reliance on imported fossil fuels, which bring significant risks to the national economy in the
context of its weakening currency, growing current account deficit, declining foreign exchange reserves
and escalating circular debt, thus reducing its energy security (Nicholas & Buckley, 2018).

    Focus: Planned generation capacity additions

    The most recent State of the Industry Report from the National Electric Power Regulatory Authority (NEPRA)
    includes a summary of planned generation capacity additions out to 2025. Pakistan plans to add 35.9 GW of
    generation capacity, of which over 30% is coal-fired capacity, until 2025.

Decarbonising South & South East Asia - Country Profile - Pakistan                                            10
Figure 1: Pakistan’s coal fired power generation capacity
Historically, coal-fired power has played a minor role in Pakistan’s power system but this is set to change
in the future. Pakistan’s coal expansion plans amount to nearly 236% of the current capacity7 (Figure 1).
This expansion accounts for over 3% of the global total. Nearly all the existing capacity is super-critical,
with relatively lower emission intensity. Over 60% of the units which are under construction, or planned
are super-critical.
The committed emissions from coal-fired power plants are likely to peak only by 2055, with an eventual
phase-out only by 2061, reflecting the large expansion status relative to the existing capacity (Figure 2).
This far exceeds any Paris Agreement compatible pathway for the energy sector as discussed in Chapter
3, which requires South Asia countries to phase out coal-fired power by 2040 at the latest.
7 Here, we define current capacity as total operating capacity + capacity under construction, and to expansion plans as planned capacity
(permitted and pre-permitted units that have not started construction) + announced capacity.
Decarbonising South & South East Asia - Country Profile - Pakistan 11Figure 2: Committed emissions from Pakistan’s coal plants
5 Transition to renewable energy – pathway characteristics,
benchmarks, options, potentials, benefits
5.1 Potential and technology options for renewable energy
Potentials and costs
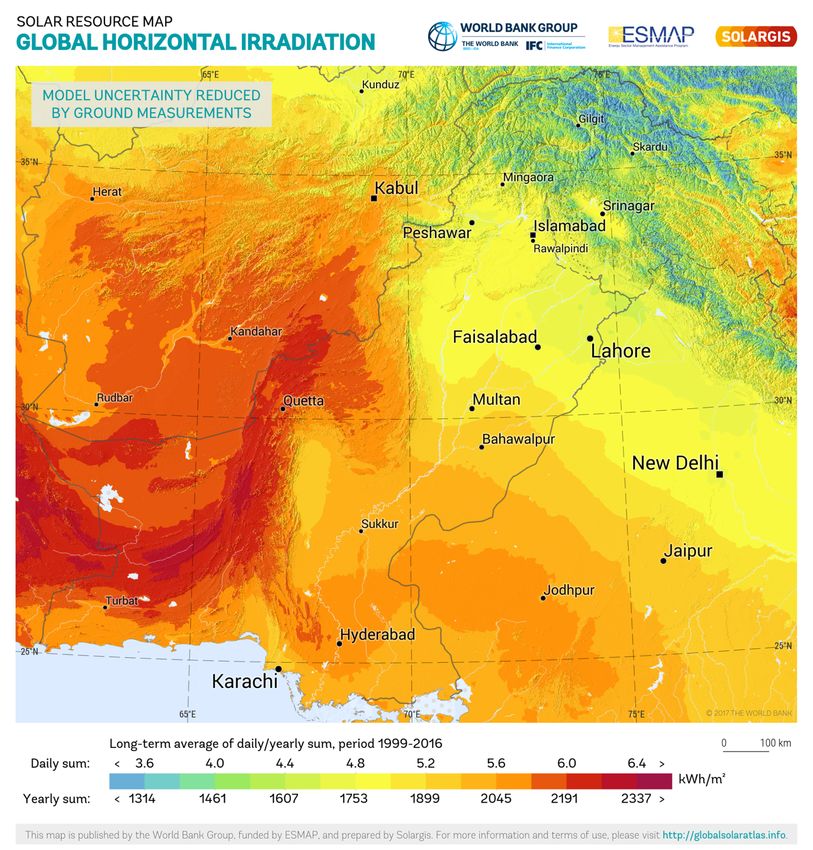
Pakistan has relatively good solar potential, with many regions receiving higher than 6 kWh/m2 of Global
Horizontal Irradiance on an average daily basis as shown in Figure 3. Covering 1.5% of Pakistan’s land
area with optimally oriented PV panels could potentially generate 3011 TWh of electricity, which is
equivalent to 32 times the total consumption of electricity in 2016 (BP, 2018; NREL, 2014). The
Southwestern region of Pakistan also offers significant wind potential, with average wind power
densities greater than 600 W/m2. However, the utilisation of these resources is limited in Pakistan, with
installed capacities of 400 MW (Solar) and 785 GW (Wind) in 2017 (NEPRA, 2018). These represented a
mere 1.5% and 3% of the total installed capacity respectively.
Scenarios for Pakistan in the OneEarth framework (combined in a sub-region with Afghanistan, Nepal
and Bhutan) (Teske et al., 2019) show renewable electricity shares reaching 73% and 88% in 2030 and
2050, respectively. For the non-OECD Asia region as a whole, significant increases in energy efficiency
allow the decarbonisation of the entire energy system. For example, final energy consumption in the
transport sector declines by nearly 50% in 2030 compared to a business-as-usual scenario, and even
further by 2050. Whereas petroleum products still make up the majority of transportation energy by
2030, the transition to a split between electricity and biofuels takes place by 2050. In the heating sector
a mix of energy sources including biomass, electricity, geothermal heat pumps and direct solar heating
are used to achieve 100% renewables by 2050. Both of these sectors demonstrate as well the synergies
Decarbonising South & South East Asia - Country Profile - Pakistan 12found in moving to renewable electricity, which can then also be used for transportation and heat
supply.
Figure 3. Global horizontal irradiation based on Global Solar Atlas (The World Bank Group, 2016)
The Lappeenranta University of Technology (LUT) model (Sadiqa, Gulagi, & Breyer, 2018) achieves 100%
renewable energy for Pakistan and the region. In the case of Pakistan, the model also considers linking
the power sector to desalination and industrial gas production. As is the case with all of their studies,
the LUT group finds lower costs for the electricity in the future system than the current one; in the
OneEarth model electricity generation costs initially rise on the 100% renewable pathway, although less
quickly than for business-as-usual, before falling again somewhat by mid-century.
5.2 Reaping opportunities of transitioning to renewable energy: Implications for
local jobs and affordability of energy
Decarbonising South & South East Asia - Country Profile - Pakistan 13While there are no IRENA estimates of benefits from an energy transition in Pakistan, renewable energy
can contribute to addressing several of the socioeconomic challenges it is facing.
Investing in renewable energy capacities can contribute to strengthening energy independence, leading
to lower expenditures on fossil fuel imports, less susceptibility to international market price fluctuations
or geopolitical shocks.
The decentralised nature of many renewable energy technologies can moreover foster progress with
regard to reliable energy access, addressing load shedding problems and eradication of energy poverty.
Improving access to clean technologies for cooking also contributes to reducing indoor air pollution and
related health hazards. Outdoor air pollution could be reduced as well by shifting away from fossil fuel
combustion.
Moreover, renewable energy technologies provide opportunities for local employment.
6 Gap analysis: targets, projections, and Paris Agreement
benchmarks
Pakistan’s NDC commits the country to a 20% reduction in emissions below Business-as-Usual emissions
by 2030.
According to government reports, Pakistan’s objectives for the power generation sector include
reduced dependence on imported fossil fuels, increased use of renewable energy, diversification of fuel
resources, and security of fuel supply. The current massive expansion of coal-based power generation
stands in stark contrast with all these objectives.
Pakistan has a dedicated ministry of climate change, which recently has fulfilled its commitment under
Bonn Challenge8 of planting one billion trees in one of the provinces, and the government is undertaking
another ambitious plan of planting 10 billion trees across the country, taking pride in the fight against
climate change. Simultaneously however, it is planning to increase the share of fossil fuels in its energy
mix manyfold, hence undermining all its climate friendly initiatives.
An analysis of a Paris Agreement consistent pathway for Asia shows that 75% share of power generation
needs to be decarbonised by 2030, with full decarbonisation by 2050. Scenarios for Pakistan and the
region show that a pathway towards 100% renewable energy is achievable, including a decarbonised
energy system through electrification of end use sectors, direct use of renewable energy for heat, and
linking the power sector with desalination and industrial gas production.
There is thus significant scope for enhanced NDC ambition and developing an ambitious long-term
strategy towards 100% renewable energy power generation and electrification of end-use sectors, to
align Pakistan’s energy future with the goals of the Paris Agreement and reap benefits for sustainable
development.
8 See http://www.bonnchallenge.org/content/challenge
Decarbonising South & South East Asia - Country Profile - Pakistan 14Literature
Bhatia, K., Vecchi, G., Murakami, H., Underwood, S., & Kossin, J. (2018). Projected Response of Tropical Cyclone Intensity and
Intensification in a Global Climate Model. Journal of Climate, 31(20), JCLI-D-17-0898.1. https://doi.org/10.1175/JCLI-D-
17-0898.1
BP. (2018). BP Statistical Review of World Energy 2018. Retrieved from https://www.bp.com/content/dam/bp/business-
sites/en/global/corporate/pdfs/energy-economics/statistical-review/bp-stats-review-2018-full-report.pdf
CIA. (2019). The World Factbook. Retrieved March 14, 2019, from https://www.cia.gov/library/publications/the-world-
factbook/geos/pp.html
Eckstein, D., Hutfils, M.-L., & Winges, M. (2018). Global Climate Risk Index 2019. Who Suffers Most From Extreme Weather
Events? Weather-related Loss Events in 2017 and 1998 to 2017. https://doi.org/978-3-943704-04-4
ESMAP. (2019). Tracking SDG7. Retrieved from https://trackingsdg7.esmap.org/
IRENA. (2018). Renewables Readiness Assessment - Pakistan.
IRENA. (2019). IRENA Dashboard - RE database. Retrieved March 14, 2019, from
http://resourceirena.irena.org/gateway/dashboard/
IRENA - International Renewable Energy Agency. (2018). Renewable readiness assessment Pakistan. Abu Dhabi. Retrieved from
https://irena.org/-/media/Files/IRENA/Agency/Publication/2018/Apr/IRENA_RRA_Pakistan_2018.pdf
JRC. (2016). EDGARv.4.3.2 - Fossil CO2 and GHG emissions of all world countries. Janssens-Maenhout, G., Crippa, M., Guizzardi,
D., Muntean, M., Schaaf, E., Olivier, J.G.J., Peters, J.A.H.W., Schure, K.M. Retrieved from
edgar.jrc.ec.europa.eu/booklet2017/EDGARv432_FT2016_CO2_per_capita_emissions_1970-2016.csv
NEPRA. (2015). Distributed Generation and Net Metering Regulations.
NEPRA. (2018). State of Industry Report 2017. Retrieved March 20, 2019, from https://www.nepra.org.pk/industryreports.htm
Nicholas, S., & Buckley, T. (2018). Pakistan’s Power Future - Renewable Energy Provides a More Diverse , Secure and Cost-
Effective Alternative. Retrieved from http://ieefa.org/wp-content/uploads/2018/11/Pakistans-Power-
Future_December-2018.pdf
NREL. (2014). Solar Resources by Class and Country. Retrieved March 15, 2019, from https://openei.org/doe-
opendata/dataset/solar-resources-by-class-and-country/resource/3e72f32a-7de1-4e5d-a25a-76928769625f
Perwez, U., Sohail, A., Hassan, S. F., & Zia, U. (2015). The long-term forecast of Pakistan’s electricity supply and demand: An
application of long range energy alternatives planning. Energy, 93, 2423–2435.
https://doi.org/10.1016/J.ENERGY.2015.10.103
PVTech. (2017). Pakistan plans first tariff-based solar auction for 50MW in Sindh.
Sadiqa, A., Gulagi, A., & Breyer, C. (2018). Energy transition roadmap towards 100% renewable energy and role of storage
technologies for Pakistan by 2050. Energy, 147, 518–533. https://doi.org/10.1016/J.ENERGY.2018.01.027
Schleussner, C.-F., Lissner, T. K., Fischer, E. M., Wohland, J., Perrette, M., Golly, A., … Schaeffer, M. (2016). Differential climate
impacts for policy relevant limits to global warming: the case of 1.5°C and 2°C. Earth System Dynamics, 7(2), 327–351.
https://doi.org/10.5194/esd-7-327-2016
State Bank of Pakistan. (2016). Revised SBP Financing Scheme for Renewable Energy.
Teske, S., Pregger, T., Naegler, T., Simon, S., Pagenkopf, J., van den Adel, B., & Deniz, Ö. (2019). Energy Scenario Results. In
Achieving the Paris Climate Agreement Goals (pp. 175–401). Cham: Springer International Publishing.
https://doi.org/10.1007/978-3-030-05843-2_8
The Government of Pakistan. (2015). Pakistan’s Intended Nationally Determined Contribution (PAK-INDC).
The World Bank. (2018a). Country Overview - Pakistan. Retrieved March 14, 2019, from
https://www.worldbank.org/en/country/pakistan/overview
The World Bank. (2018b). Power Sector Distortions Cost Pakistan Billions. Retrieved March 14, 2019, from
http://www.worldbank.org/en/news/press-release/2018/12/11/power-sector-distortions-cost-pakistan-billions
The World Bank. (2019). World Development Indicators database. Retrieved January 30, 2019, from
https://databank.worldbank.org/data/reports.aspx?source=world-development-indicators
The World Bank Group. (2016). Global Solar Atlas.
United Nations. (2019). Sustainable Development Goals database. Retrieved February 19, 2019, from
https://unstats.un.org/sdgs/indicators/database/
United Nations Development Program. (2018a). Human Development Index database. Retrieved March 13, 2019, from
http://hdr.undp.org/en/data#
United Nations Development Program. (2018b). Human Development Indices and Indicators: 2018 Statistical Update - Pakistan.
Decarbonising South & South East Asia - Country Profile - Pakistan 15Retrieved from http://hdr.undp.org/sites/all/themes/hdr_theme/country-notes/PAK.pdf
Wakeel, M., & Jahangir, S. (2016). Overview of Energy Portfolio in Pakistan. Energy Procedia, 88, 71–75.
https://doi.org/10.1016/J.EGYPRO.2016.06.024
World Health Organisation. (2018). Global Health Observatory data repository. Retrieved March 15, 2019, from
http://apps.who.int/gho/data/node.main.BODAMBIENTAIR?lang=en;
Decarbonising South & South East Asia - Country Profile - Pakistan 16You can also read