The Impacts of Oil Prices, Exchange Rate and COVID-19 Pandemic on BIST Petrochemical Market
←
→
Page content transcription
If your browser does not render page correctly, please read the page content below
World Journal of Applied Economics (2021), 7(1): 17-33
    doi: 10.22440/wjae.7.1.2                                                           Research Article

    The Impacts of Oil Prices, Exchange Rate and
    COVID-19 Pandemic on BIST Petrochemical
                       Market
                                    Seval Mutlu Çamoğlua

                   Received: 15.04.2021; Revised: 19.05.2021; Accepted: 21.05.2021

      Stock markets are developing with the economic growth of the countries in a liberal
      market economy. Petrochemicals is an indicator of the performance of the coun-
      try’s industry with high inter-industry linkage by providing input to several sectors,
      producing various outputs with a certain number of raw materials. The COVID-19
      pandemic period has affected all markets worldwide and caused fluctuations in the in-
      dex values of large firms in the petrochemical industry in Borsa Istanbul (BIST). This
      study analyzes the impact of the pandemic period and change in the oil prices and
      exchange rate on the petrochemical market in Turkey. The monthly data of petro-
      chemical stock market index, exchange rate, oil prices are used in this time series
      analysis. A pandemic information index representing the COVID-19 pandemic was
      derived and included in the model. According to the results, it is observed that the
      most important determinant of the fluctuations on the BIST petrochemical index is
      the oil prices. While a shock in oil prices negatively affects the BIST petrochemical
      index, the petrochemical index responds positively to the shock in the pandemic index.
      JEL codes:   N50, G10, E4
      Keywords: Petrochemical stock market, Pandemic information index, Oil prices, Time series anal-
      ysis

1 Introduction
    The stock market grows together with the economic developments in free-market economies.
This financial market drives savings and allocates capital to the economy. The increasing
number of institutional and individual financial investors increases the role of this market.
Levine & Zervos (1996, 323) emphasized that there is a positive and strong relationship be-
tween long-term economic growth and the development of stock markets. Financial markets
(stock markets and banks) are the prominent way to channel investment capital into uses
of the highest returns. These markets foster entrepreneurship development and specializa-
tion in the adoption of new technologies with enhanced capital accumulation (Greenwood
& Smith, 1997, 147). As the stock market grows and becomes more institutional, the pos-
sibility of savings to turn into investments increases and economies develop more steadily.

aDepartment of Economics. Ünye Faculty of Economics and Administrative Sciences, Ordu University/-
Turkey. email: smutlu28@gmail.com  https://orcid.org/0000-0003-3056-7895

                                                     17
BIST Petrochemical Market
In recent years, small savers have become more interested in the stock market, which
can have attractive returns, as they are directed to savings through financial instruments
such as interest, gold, foreign exchange. Especially after March 2020, more than two million
new investors entered the stock market (Korcan, 2021). The simplicity of online banking
transactions and the increase in the time spent at home during the COVID-19 pandemic, as
well as more spare time for market monitoring, have led individuals with savings to different
pursuits in terms of financial returns.
Petrochemical firms in the stock market, which are large-scale firms, are producing chem-
ical, petroleum and plastic materials, could be relatively stable compared to the other stock
markets. The petrochemical index is affected by several local and international information.
In addition to the fluctuations in oil prices and exchange rates, the COVID-19 pandemic
has also considerably influenced the sector. Social distancing measures during the pandemic
caused demand shocks by reducing consumption expenditures, resulting in chain reaction
supply shocks and serious ups and downs in the financial markets.
The fluctuations in oil prices could considerably affect the economic indicators. This
is due to the fact that oil is an intermediate input for many sectors. Oil price shocks are
spreading rapidly due to internationally integrated markets, reflecting particularly on pro-
duction costs, creating inflationary effects in oil-importing and highly dependent countries.
Özer (2017) and Gönüllü et al. (2015) stated that oil prices are an effective determinant,
although not the most important, for stock markets.
The pandemic has negatively affected economies, causing sudden declines in stock mar-
kets. Most countries have turned to both fiscal and monetary expansion by implementing
more Keynesian policies in the pandemic. During this period, the scope of government
responsibilities in market economies expanded, and more social policies were implemented
(Çolak, 2020, 3). The COVID-19 pandemic, which started in Turkey in March 2020 and
is still having an impact, has affected the economy completely, driving the implementation
of measures such as travel restrictions, distance education instead of face-to-face education,
and the closure of shopping malls. Commercial life has changed dramatically, and electronic
commerce has become more widespread. Food and drinking establishments have become
unworkable by minimizing social life, while sectors that provide food, health and hygiene
products have become more profitable.
Decreases in household expenditures due to social distance measures taken to prevent the
spread of COVID-19 have caused demand shocks. The demand shocks affected production,
resulting in supply shocks in both final products and intermediate goods. All these also
trigger financial shocks (Aydoğuş, 2020, 11). The sharp ups and downs in the stock market
have caused particularly inexperienced individuals who have just entered the market to live
with high-rate losses (Gürdamar, 2020). The aim of this study is to analyze the interaction
of oil prices and exchange rates, which are the determining variables of the petrochemical
market, as well as the COVID-19 pandemic on the BIST petrochemical stock market.
In this paper, the monthly data for the chemical, petroleum and plastic stock market
index of BIST, the exchange rate of US dollar (USD)/Turkish Lira (TRY), the oil prices
and the information index of COVID-19 for Turkey were analyzed within the framework of
the VAR (Vector Autoregressive) model. The information index of the COVID-19 pandemic
was generated based on the method of the information index developed by Chern & Zuo
(2006) as representing the pandemic period for the analysis in the model of this study.
18World Journal of Applied Economics 2021(1)
In the next section, a literature review is provided. Section 3 discusses the characteristics
of the petrochemical industry. Section 4 describes the data used in the model and sets out a
framework for the empirical approach. Section 5 presents the results of the empirical analysis
by providing impulse response function and variance decomposition. Section 6 concludes.
The appendix provides additional tables regarding the results of the variance decomposition
analysis, lag length selection, and block exogeneity test.
2 Literature Review
There are many studies that examine different sides of the linkages among oil prices,
stock markets and exchange rate. In particular, the effects of the volatility in oil prices on
the markets have been of extra interest.
Mensi (2019) examined the joint movements between crude oil prices and stock market
indices at the sector level in the Saudi market, which is a heavily oil-dependent economy. The
author used the Value at Risk (VaR) and wavelet approach for analysis. The co-movements
among oil prices and the aggregate index (Tadawul) and all sector markets intensified after
the 2008-2009 global financial crisis. The joint movements between Brent crude oil and
the Tadawul were weak due to government spending, high foreign reserves and economic
indicators. The Petrochemical sector index was highly dependent on the oil market.
Gourène & Mendy (2018) examined the co-movements between OPEC oil prices and
Africa’s six largest stock markets. Using the Wavelet approach, they found that with the
exception of emerging stock markets such as South Africa and Egypt, the joint movement
between African stock markets and oil prices was relatively low.
Liu et al. (2020) studied the impacts of oil price jumps on China’s petrochemical markets.
They found evidence that the threat of dynamic shock in oil prices still exists in the post-2008
crisis period. The returns of petrochemical stocks and commodities were negatively affected
by current oil price jumps because of early reflections of the panic caused by excessive risk
information. The effects of lagged jumps on these returns were the opposite due to the
reflection of rationality in speculators.
Öztürk et al. (2013) investigated the relationship between oil and natural gas prices,
the petrochemical industry index and the manufacturing sector index in the Turkish stock
market for the period of 1997-2009. According to the results of the tests with structural
breaks, they found a long-term relationship between the variables.
Gönüllü et al. (2015) conducted regression analyses for the 2003-2012 periods in order
to reveal the return effect of the volatility in oil prices on stock prices. They stated that,
in cases where there is a positive change in oil prices and the Turkish stock market index,
positive returns could also be achieved in the petrochemical industry. Caporale et al. (2015)
estimated the time-varying effect of oil price uncertainty on sectoral stock returns in China
using the VAR-GARCH model. They found that the increase in oil prices positively affected
stock returns during periods of demand-side shocks and that financial, oil and gas stock
returns reacted negatively to oil price uncertainty during periods of supply-side shocks.
Atarodi et al. (2018) examined the effects of exchange rate fluctuations and oil prices on
Iran’s petrochemical industry stock market prices. They took into account the stock market
index of firms in the petrochemical industry using the vector error correction model in the
period 1992-2015. The results show that exchange rate fluctuations and oil prices have a
positive relationship with the stock market prices of the Iranian petrochemical industry.
19BIST Petrochemical Market
3 Petrochemical Industry
Petrochemicals is an industry that produces materials used in many parts of modern daily
life. The growth of the plastics and rubber sectors has been effective in its main development.
The widespread use of plastic and rubber in automobile and all other sectors has significantly
increased petrochemical production. The size of the global petrochemical market was around
$700 billion in 2018 (PAGEV, 2021). Petrochemicals is an industry that provides many
outputs with a certain number of raw materials, has high inter-industry forward connections
and is indicative of the performance of the country’s industry by providing input to many
sectors (Oğuz, 2018, 81).
During the 20th century, the petrochemical industry was dominated by a certain num-
ber of European and U.S. based multinational firms with strong barriers to entry into the
market. By the 2000s, China became the world’s largest producer in the sector, and emerg-
ing economies have also increased their production recently. The petrochemical industry
underperformed for a short while in 2015. This could be attributed to changes in oil prices,
weak global demand, and a decline in Chinese imports (Verbeek & Mah, 2020, 364). Ex-
cessive volatility in oil prices has a dramatic effect on petrochemical stocks and commodity
markets of importing countries in particular due to the fact that petrochemicals are direct
by-products of crude oil (Liu et al., 2020, 2). Petroleum is the main raw material of the
petrochemical industry.
Figure 1: Brent Oil Price
Source: CBRT (2021)
Many products derived from petroleum are used in sectors such as construction, packag-
ing, automotive, electrical electronics and fertilizers. Therefore, oil is an effective commodity
in the development of these industries. The international oil market has a complex struc-
ture that is under the influence of many factors. The activities in the market carried out
with factors such as the interdependent political decisions of the countries, production costs,
technological developments and fluctuations in the spot and futures markets (Bayraç, 2019,
45). During the COVID-19 outbreak, restriction measures in the mobility of individuals
significantly reduced expenditures, outcoming a demand shock in the markets, and the in-
dustrial sector caused reductions in energy demand, fuel consumption and production of
the petrochemical industry. This has led to a sudden drop in oil prices, especially in the
first months of the pandemic. Brent oil price decreased from $50/barrel in February 2020 to
$15/barrel in March 2020 (Figure 1). The increasing fluctuations in commodity prices dur-
ing the pandemic brought speculative movements and severe instability to financial markets.
20World Journal of Applied Economics 2021(1)
Figure 2: BIST Petrochemical Index and BIST100 Index
Source: (Investing, 2021)
In this study, the index value of BIST oil, chemistry and plastics (XKMYA) representing
the petrochemical industry was taken into consideration. This index group includes the
stocks of 31 firms in Borsa Istanbul. In this sector, a wide range of products such as cellulose,
chemical products, fertilizers, insulation materials, packaging, polyester, petroleum refinery
products and so on are produced.
When the aggregate index (BIST100) and the petrochemical index are examined in
Figure 2, it is seen that the index of this sector is below the BIST100 until 2018. However,
many times after 2018, the stock prices of this sector have risen above BIST100. When
the real monthly return of the sector index is evaluated, it is seen that between 2000-2003,
during the 2008 financial crisis, and since 2019, volatilities in real return values have been
quite high. The return of this sector in the stock market was affected by the shocks in
the crisis years, and fluctuations were experienced. The lowest level was recorded with a
Figure 3: Real Returns on the BIST petrochemistry Index (%)
Source: Returns are calculated by the author using data from Investing (2021)
real return loss of 30% in November 2000 and the highest level with a real return of about
33% in November 2002. COVID-19 pandemic in Turkey started in March 2020, and the
sector shares suffered a sudden devaluation of approximately 19%, Figure 3. The pandemic
21BIST Petrochemical Market
has affected oil prices much more deeply. Oil prices, which were already in a downward
trend since the beginning of 2020, fell at a high rate of 71% in March 2020 compared to the
previous month, Figure 1.
4 Data and Method
In this research, the time series monthly data for the BIST petrochemical stock market
index, the dollar exchange rate and oil prices are used for analysis. In addition, after March
2020, the Pandemic index was created and included in the model to analyze the effects of
the COVID-19 pandemic in this market. As the exchange rate variable, the average monthly
data of the purchase value of a U.S. dollar for the Turkish lira is used. Oil prices are the
average monthly price of European Brent oil in dollars per barrel. These are taken from the
Central Bank of the Republic of Turkey database (CBRT, 2021). BIST petrochemical index
was converted to real data by using the domestic producer prices index (TURKSTAT, 2021).
This stock market index is the monthly average value of closing stock data and is taken from
the investing.com website (Investing, 2021). The data required for the Pandemic index,
which was generated to evaluate the effects of the COVID-19 pandemic on the markets, was
obtained from the website of the Ministry of Health of the Republic of Turkey (MoH, 2021).
In this study, the pandemic index variable is generated based on the method developed
by MoH (2021) by using the total number of persons who died due to COVID-19 announced
by the Ministry of Health on a monthly basis in Turkey. Economic decision-making units are
expected to suddenly adjust and change their behaviors when faced with a life-threatening
situation. Time series data is quite appropriate for capturing such changes. Brown &
Schrader (1990) contributed to the literature by generating an information index based
on the number of piece of news published on the subject to show the level of information
dissemination impact of an event. Following their approach, there have been attempts to
construct alternative indices. These studies assume that the level of influence of information
decreases over time after a piece of news is published (Chern & Rickertsen, 2003). The
information index (Ii ) developed by Chern & Zuo (2006) is defined as follows.
n
X
Ii = Wi Nt−i (1)
i=0
where Nt−i is the number of information related to the event in the (t − i)th period, n is
the number of total lagged periods, and Wi indicates the cubic weight function associated
with i during the derived lagged period, equation (1). This method considers not only the
carryover effect but also the decay effect of information. The carryover and decay effects are
captured by specifying a weight function and the total lag period. The following third-degree
or polynomial weight function is used.
2a 12m 6(n + 1 + m) 2 4
Wi = + i − i + i3
(n + 1)b b (n + 1)b (n + 1)b
(2)
a = (n + 1)2 (n + 1 − 3m)
b = (n + 2)[(n + 1)2 − m(2n + 3)]
where m is the lag period with the maximum weight, a and b are calculated from m and n,
equation (2). In general, m and n can take any finite numbers. The trends of the information
22World Journal of Applied Economics 2021(1)
index are not very sensitive to the values of m and n. The validity of these indexes lies in
the assumption that the receiving information should have a finite duration and decaying
effects as a source of consumer information (Chern & Zuo, 2006, 9-12).
In this study, the vector autoregressive (VAR) model was applied according to the find-
ings of unit root tests and cointegration tests to reveal the effects of the variables specified
in the petrochemical market. VAR processes reveal the dynamic interactions of n numbers
of time series variables, where a priori endogeneity is assumed for each variable (Chern &
Zuo, 2006, 95). In its configuration, the current values of the set of variables are formed
to be partially explained by the lagged values of the variables. This model was developed
by Sims (1980). The basic VAR model could be described in the following reduced form,
equation (2), based on Lütkepohl & Kratzig (2004).
yt = A1 yt−1 + . . . + Ap yt−p + t (3)
where yt is a (nx1) vector containing the model variable, Ai is the parameter matrix con-
taining coefficients, and t represents the unobserved error terms that are a vector with
Gauss distribution (Kiss et al. (2020, 95); Johansen (1995)). Traditional VAR models are
generated with stationary variables (Lütkepohl, 2015, 2). Augmented Dickey-Fuller (ADF)
and Phillips Perron (PP) unit root tests were applied to test the stationarity of the data.
The null hypothesis of the ADF and PP tests is “with unit root and not stationary” (Dickey
& Fuller, 1979; Phillips & Perron, 1988). Johansen Cointegration analysis was conducted
to determine the existence of cointegration between non-stationary series. In order to cap-
ture stochastic trends in economic variables, the concept of cointegration was developed by
Engle & Granger (1987), Johansen (1995) and others (Lütkepohl, 2015, 2)). Next, Block
Exogeneity Wald tests were adopted to support the inclusion of endogenous variables for the
set of variables in the VAR system. The Wald statistic is useful in detecting exogeneity or
endogeneity of the dependent variable (Rafiq et al., 2009). Under this test, an endogenous
variable can be treated as exogenous (Constant, 2010). Wald chi-square test was found to
be statistically significant jointly in equations where the dependent variables were exchange
rate and oil prices. The null hypothesis of block exogeneity is rejected for the exchange
rate and oil prices equations in the model. Besides, the variable of oil prices is statistically
significant in the equation, where the dependent variable is the pandemic index. Also, the
petrochemical stock market index and the pandemic index are statistically significant, while
the dependent variable is oil prices. There was evidence of bi-directional causality between
the pandemic index and oil price, which implies that they are influenced by each other. In
the equation where the exchange rate is dependent, the petrochemical stock market index
was found to be significant. According to Wald test results, these variables can be treated
as endogenous variables in the model (Table A.3 in Appendix).
In this study, impulse-response functions and variance decomposition were used as tools
to explain the relationships between the variables in a VAR model. The effect of a unit
shock applied to each variable is measured by the impulse-response functions in order to
determine the response of the variables used in the model to the specific variable. In the
impulse-response graph, the vertical axis measures the magnitude of the response to the
effect by scaling so that 1.0 equals one standard deviation. Confidence bands used to
determine the statistical significance of an impulse-response represent ±2 standard errors.
At points where the confidence bands do not exceed the line at zero, the impulse response is
23BIST Petrochemical Market
considered to be statistically different from zero at a significance level of 5% or less (Ewing
et al., 2007, 609-610). The variance decomposition method is used to determine which
variables are caused by the percentage change in the specific variable (Ataş & Güler, 2020,
528-529). Variance decomposition indicates which shocks are determinant in the short and
long term paths of certain variables, that is, the proportion of uncertainty of the ith variable
to be attributed to the j th shock after the h period Kiss et al. (2020, 97). The variance
decomposition is formulated as follows.
Ph 2
k=0 (kci,j )
ϑDi,j,h = Ph Pn (4)
2
k=0 l=1 (kci,l )
5 Empirical Findings
First, the natural logarithmic transformation of each time series data was performed.
Descriptive statistics for this data are presented in Table 1. The trends of the data used
in the model between 2000-2021 are presented in Figure 4. When the nominal data of the
BIST petrochemical index are examined, it is seen that the stock market has tended to
increase in this sector, particularly after the 2008 Global Financial Crisis. The real BIST
petrochemical index was found to be a more stable series. In the graph of oil prices, it is seen
that oil prices are affected especially by crisis periods and followed a fluctuating. Turkey’s
pandemic index has been increasing since March 2020, with a slight decrease in the summer
period but a significant increase in the last quarter of the year. The TL/dollar exchange
rate was stable in the early 2000s, but after 2016, an increasing trend is observed.
Table 1: Descriptive Statistics
LogPbrentoil Logpandemicindex Logreelbistpetrochemical Logusdtrrate
Mean 1.786 0.147 2.270 0.329
Median 1.803 0.000 2.294 0.232
Maximum 2.141 3.715 2.587 0.903
Minimum 1.172 0.000 1.918 0.068
Observations 229 229 229 229
Source: Calculated by the author by using data of CBRT (2021) and Investing (2021)
Constant and trend-containing ADF and PP tests were applied for unit root analysis of
the series in the study. The results in both tests confirmed each other. Accordingly, it was
determined that oil prices and dollar exchange rates were not stationary at the level. This
suggests that the past shocks of each series continue to have an effect for a certain period.
As a result of the unit root test performed for the differences, the series becomes stationary
and are first-order stationary series, Table 2. The Johansen cointegration test was used
to investigate whether the series were co-integrated, that is, whether the variables have a
long-term equilibrium. As a result of the cointegration test, no long-term relationship was
found between variables, Table 3.
Since there is no co-integrated relationship, it is decided to apply the unconstrained VAR
model and, thus, the relationship between the variables is examined with the simultaneous
equation system. The difference series of oil prices and dollar exchange rates, which are the
series whose first-degree difference is stationary, are created. The BIST petrochemical index
is stationary at the level according to the result of unit root tests, Table 2.
24World Journal of Applied Economics 2021(1)
(a) BIST Petrochemical Index (Real and nominal) (b) Brent Oil Prices
(c) COVID-19 Pandemic Index (d) Turkish Lira/Dollar Exchange Rate
Figure 4: The Evolution of Variables in Interest
Source: Calculated and graphed by the author by using data of CBRT (2021) and Investing (2021)
Based on the assumption that each variable is endogenous, the VAR model was formed
to reveal the dynamic relationship of the variables in the study. In addition, the pandemic
index variable has been added to the model as an endogenous variable. The lag length of the
model is determined as three according to the AIC criterion (Table A.2 in Appendix). It is
Table 2: Unit Root Hypothesis Test Results
ADF testa PP testa
Variables Level 1st Difference Level 1st Difference
logreelbistpetrochemical -3.729** -15.596*** -4.090*** -15.610***
logPbrentoil -2.577 -10.007*** -2.665 -13.676***
logusdtrrate -1.015 -8.148*** -1.024 -9.768***
* %10, ** %5, and *** %1 are significance levels.
a: Lag length is selected based on Akaike Information Criterion. Tests include con-
stant and trend.
important to accurately determine the optimum lag length in order to be consistent in the re-
sults of impulse-response function and variance decomposition analysis (Elmastaş Gültekin
& Aktürk Hayat, 2016, 618). LR autocorrelation test was performed to test whether the
model had a problem with the error terms; it was determined that there was no autocorre-
lation in the model (Table 4). Impulse response functions and variance decomposition were
used to interpret the model estimation results and resolve relationships among variables.
In order to determine the effect of the variables in the model on the BIST petrochemical
index, firstly, the graphical analysis of the impulse response functions was carried out.
Impulse response functions indicate the current and future values of each variable within
25BIST Petrochemical Market
Table 3: Johansen Cointegration Test
λ max λ trace
Model r=0 r=1 r=0 r=1 lag
logPbrentoil & logusdtrrate 7.279 1.128 8.408 1.128 3
* %10, ** %5, and *** %1 are significance levels.
Note: r is the number of cointegrated vectors, λ max is Maximal eigenvalue
test, and λ trace is Trace test.
the VAR model in response to an increase in the system by one standard deviation. It
is assumed that the effect of this shock disappears after a while (Stock & Watson, 2001).
These effects enter the system through the vector of error terms (Lütkepohl, 2015, 16).
In the study, the VAR model was first estimated, and then Impulse-Response Functions
Table 4: LR Autocorrelation Test Results of the VAR model
Lag LRE* stat df Prob. Rao F-stat df Prob.
1 20.692 16 0.191 1.300 (16, 611.6) 0.191
2 13.216 16 0.657 0.825 (16, 611.6) 0.657
3 16.302 16 0.432 1.021 (16, 611.6) 0.432
4 20.474 16 0.199 1.286 (16, 611.6) 0.199
5 20.366 16 0.204 1.279 (16, 611.6) 0.204
Note: Sample covers 2002M01-2021M01, and the number of observations is 224.
H0 : There is no autocorrelation.
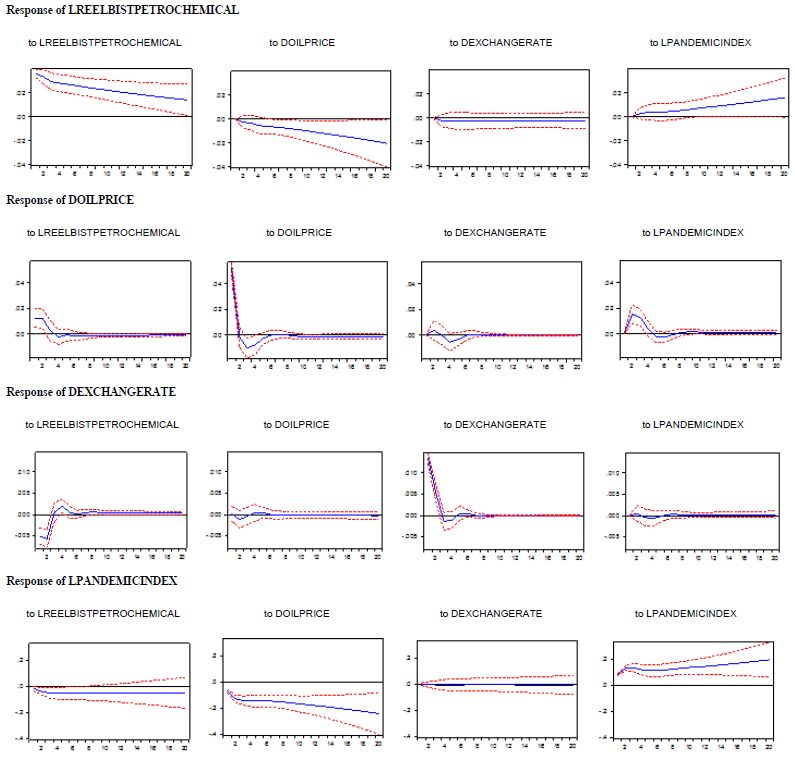
graphs were orthogonalized according to Cholesky decomposition following the ordering
petrochemical index, oil prices, exchange rate, and pandemic index (Figure 5). The impulse
response function is statistically significant when both confidence bands are above or below
zero on the y axis representing plus/minus two standard deviations (Weinhagen, 2002, 7).
At points where the confidence bands do not straddle the line at zero, the impulse response
is considered to be statistically different from zero at the 5% level of significance or less
(Ewing et al., 2007, 609-610).
The impact of an increase in oil prices on the BIST petrochemical index is negative and
has a growing trend, and this effect does not return to its former state in the long period.
Fluctuations in the prices of oil, which is the main raw material of the petrochemical sector,
change the input costs of this sector and affect the profitability of the sector. The shocks in
oil prices have statistically significant reactions to the petrochemical index.
Shocks to the petrochemical index cause statistically significant changes in oil prices and
exchange rates in the first periods. The increases in the exchange rates have a substantial
impact on the production costs of the petrochemical industry, which has import-dependent
input demand. Contractions in the production of industries also led to decreases in input
demand, resulting in decreases in oil prices.
The pandemic index, as an indicator of the public concern for COVID-19, has a positive
effect on the stock market petrochemical index, and there is a response to the increase in
the stock prices of firms in this sector. This effect continues to increase in the following
months. In the first period of the pandemic, the stock market observed a sharp decrease
in the stock market, there was an upward trend in the following period, and the markets
reached their pre-pandemic level.
26World Journal of Applied Economics 2021(1)
Figure 5: The Impulse Response Functions of the Model
Source: Calculated and graphed by the author by using data of CBRT (2021) and Investing (2021)
The BIST petrochemical index is examined according to variance decomposition in Ta-
ble A.1 in Appendix. It is reported that it is most affected by its variability in its own
innovations. The changes in oil prices to explain the variability in the petrochemical index
remains very low in the first months, and the effect reaches 7% in a year. The changes in
the dollar exchange rate to explain the fluctuations in the petrochemical index is quite weak
and remains constant at 0.5-0.6% towards the end of the year. It is observed that approx-
imately 4.2% of the variability in petrochemical index changes is explained by pandemic
index shock at the end of the year, while the influence to explain the variability in the BIST
petrochemical index was quite small in the first months of the year.
While oil prices are examined by variance decomposition, the pandemic index has the
greatest effect on oil prices after its own changes. This effect continues at 11% for a year. The
second influential variable in oil price variability is the stock market index of petrochemical
firms, which continues to have this effect throughout the year at about 9%. In the volatility
in oil prices, the explanatory level of the dollar exchange rate increases throughout the year
and reaches 2%.
27BIST Petrochemical Market
6 Conclusions
This study aims to analyze the effects of the COVID-19 pandemic on the BIST petro-
chemical stock market, as well as the oil prices and exchange rate, which are the influential
variables on the petrochemical market. The VAR model was used to reveal dynamic inter-
actions between the BIST petrochemical index, oil prices, the dollar exchange rate and the
pandemic index variables generated. Impulse response functions and variance decomposi-
tion were used to interpret model results and to explain the relationships between variables.
According to the impulse-response graphs, the effect of the increase in oil prices on the BIST
petrochemical index is negative. The increase in the dollar exchange rate also negatively
affects the index of the sector. The pandemic index is an indicator of the public concern
caused by the impact of the COVID-19 disease. This index had a positive effect on the
stock market petrochemical index.
According to the results of variance decomposition, it is observed that oil prices are the
most important factor in the variability of the BIST petrochemical index. The shock in
oil prices negatively affects the BIST petrochemical index. The most important variable
in the variability in oil prices was found to be the pandemic index. Afterwards, the stock
market index is effective immediately after the exchange rate. The international impact
of the COVID-19 pandemic has led to significant movement in international oil prices. In
the statement of the movements in the dollar exchange rate, the value of the petrochemical
index is seen as significantly important. These variables dynamically interact with each
other. A crisis such as the pandemic has caused a decrease in the demand for consumer
goods and affected oil prices, making the BIST petrochemical index more volatile.
Knowledge about the determinants of stock market volatility is crucial in assisting in-
vestors to choose the appropriate financial investment instruments to minimize risk, espe-
cially in times of uncertainty. As the number of investors increases in the developing stock
markets, the regulations to be made for these markets are also important, especially during
periods of increased risk factors. Crises that change people’s daily lives and consumption
behaviors, such as the pandemic, have intense effects on the markets. Knowing the course
of fluctuations created by these crises in the economy and regulatory taking measures ac-
cordingly will be able to reduce the volume of fluctuations.
References
Atarodi, S., Dehghan, A., & Asgari, M. (2018). The Effect of Exchange Rate Fluctuations
and Oil Prices on the Export-Oriented Industries of the Country’s Capital Market (Case
Study: Stock Companies of Petrochemical Industry). International Journal of Economics
and Financial Issues, 8 (1), 136–42.
Ataş, H., & Güler, H. (2020). Türkiye’nin Doğal Gaz, Petrol ve Kömür Tüketiminin
Büyümeye Etkisi: Ekonometrik Bir Analiz (The Effects of Turkey’s Natural Gas, Oil and
Coal Consumption on Growth: An Econometric Analysis). Çukurova Üniversitesi Sosyal
Bilimler Enstitüsü Dergisi , 29 (3), 524–39.
Aydoğuş, O. (2020). Salgın ve Ekonomik Kriz (Pandemic and Economic Crisis). In İktisat
ve Toplum Dergisi (Vol. 114).
28World Journal of Applied Economics 2021(1)
Bayraç, H. N. (2019). Küresel Petrol Piyasasında Fiyat Oluşumu ve Ekonomik Etkileri
(Price Formation in the Global Petroleum Market and Its Economic Effects). Yalova
Sosyal Bilimler Dergisi , 9 (19), 44–59.
Brown, D. J., & Schrader, L. F. (1990). Cholesterol Information and Shell Egg Consumption.
American Journal of Agricultural Economics, 72 (3), 548–55. doi:10.2307/1243023
Caporale, G. M., Ali, F. M., & Spagnolo, N. (2015). Oil Price Uncertainty and Sectoral
Stock Returns in China: A Time-varying Approach. China Economic Review , 34 , 311–21.
doi:10.1016/j.chieco.2014.09.008
Central Bank of Republic of Turkey (CBRT). (2021). Electronic Data Distribution System.
https://evds2.tcmb.gov.tr/.
Chern, W., & Rickertsen, K. (2003). Health, Nutrition and Food Demand. Cabi Publishing,
Wallingford.
Chern, W., & Zuo, J. (2006). Impacts of Fat and Cholesterol Information on Consumer
Demand: Application of News Indexes (Working Papers No. 28321). The Ohio State
University.
Çolak, Ö. F. (2020). Salgına Karşı Ekonomik Önlemler Artırılmalı (Economic Measures
Against the Pandemic Should be Increased). In İktisat ve Toplum Dergisi (Vol. 114).
Constant, Z. S. (2010). Export-Led Growth Hypothesis: Evidence from Cote d’Ivoire (Work-
ing Papers). SSRN. doi:10.2139/ssrn.2501806
Dickey, D. A., & Fuller, W. A. (1979). Distribution of the Estimators for Autoregressive
Time Series with a Unit Root. Journal of American Statistical Association, 74 (366),
427—31. doi:10.2307/2286348
Elmastaş Gültekin, Ö. and Aktürk Hayat, E. (2016). Altın Fiyatını Etkileyen Faktörlerin
VAR Modeli İle Analizi: 2005-2015 Dönemi (Analysis of Factors Affecting the Gold Price
Through VAR Model: 2005-2015 Period). Ege Academic Review , 16 (4), 611–25.
Engle, R. F., & Granger, C. W. J. (1987). Co-Integration and Error Correction: Represen-
tation, Estimation, and Testing. Econometrica, 55 (2), 251–76. doi:10.2307/1913236
Ewing, B. T., Riggs, K., & Ewing, K. L. (2007). Time Series Analysis of a Predator–prey
System: Application of VAR and Generalized Impulse Response Function. Ecological
Economics, 60 (3), 605–12. doi:10.1016/j.ecolecon.2006.01.002
Gourène, G. A. Z., & Mendy, P. (2018). Oil Prices and African Stock Markets Co-
movement: A Time and Frequency Analysis. Journal of African Trade, 5 (1-2), 55–67.
doi:10.1016/j.joat.2018.03.002
Greenwood, J., & Smith, B. D. (1997). Financial Markets in Development, and the Develop-
ment of Financial Markets. Journal of Economic Dynamics and Control , 21 (1), 145–81.
doi:10.1016/0165-1889(95)00928-0
Gönüllü, Ç. & Otluoğlu, E. & Şengöz, M. (2015). Ham Petrol Fiyatı Değişimlerinin
Petrokimya Sektörü Getirileri Üzerindeki Etkisi (The Impact of Crude Oil Price Changes
on Petrochemical Industry Returns). Uluslararası İktisadi ve İdari İncelemeler Dergisi ,
7 (14), 223–34.
29BIST Petrochemical Market
Gürdamar, B. (2020). Uzmanlardan ‘Yeni Borsa Mağdurları Olmasın’ Uyarısı (‘No New
Stock Market Victims’ Warning from Experts). https://www.aa.com.tr/tr/ekonomi/
uzmanlardan-yeni-borsa-magdurlari-olmasin-uyarisi/2090715.
Investing. (2021). BIST Chemical, Petroleum & Plastic (XKMYA). https://tr.investing
.com/indices/ise-chem.,petrol.,plastic.
Johansen, S. (1995). Likelihood Based Inference in Cointegrated Vector Autoregressive
Models. Oxford University Press.
Kiss, G. D., Tanács, G. Z., Lippai-Makra, E., & Rácz, T. A. (2020). Last Resort: European
Central Bank’s Permanent Engagement in Tackling Foreign Exchange Liquidity Disrup-
tions in the Euro Area Banking System. Financial and Economic Review , 19 (4), 83–106.
doi:10.33893/FER.19.4.83106
Korcan, U. (2021). Temettü Verimi Yüksek Hisseden Çifte Kazanç (Double Earn-
ings from High Dividend Yield). https://www.dunya.com/finans/haberler/borsa/
temettu-verimi-yuksek-hisseden-cifte-kazanc-haberi-610821.
Levine, R., & Zervos, S. (1996). Stock Market Development and Long-run Growth. The
World Bank Economic Review , 10 (2), 323–39. doi:10.1093/wber/10.2.323
Liu, F., Shao, S., & Zhang, C. (2020). How Do China’s Petrochemical Markets React to Oil
Price Jumps? A Comparative Analysis of Stocks and Commodities. Energy Economics,
92 . doi:10.1016/j.eneco.2020.104979
Lütkepohl, H. (2015). Vector Autoregressive Models. In N. Hashimzade & M. A. (Eds.),
Handbook of Research Methods and Applications in Empirical Macroeconomics. Edward
Elgar Publishing.
Lütkepohl, H., & Kratzig, M. (2004). Applied Time Series Econometrics. Cambridge
University Press. doi:10.1017/CBO9780511606885
Mensi, W. (2019). Global Financial Crisis and Co-movements between Oil Prices and Sector
Stock Markets in Saudi Arabia: A VAR based Wavelet. Borsa Istanbul Review , 19 (1),
24–38. doi:10.1016/j.bir.2017.11.005
Ministry of Health of Republic of Turkey (MoH). (2021). General Coronavirus Ta-
ble - COVID-19 Information Page. https://covid19.saglik.gov.tr/TR-66935/genel
-koronavirus-tablosu.html.
Özer, A. (2017). Petrol Fiyatları ile Hisse Senedi Getirileri Arasında Volatilitenin Yayılma
Etkisi: Gelişmiş ve Gelişmekte olan Ülkeler Örneği (Volatility Spillovers between Oil
Prices and Stock Returns: Developed and Developing Countries Case). International
Journal of Management Economics & Business/Uluslararası Yönetim İktisat ve İşletme
Dergisi , 13 (13), 654–62.
Öztürk, M. B. & Gümüş, G. K. & Taşkın, F. D. & Çağlı, E. Ç. (2013). Petrol ve Doğalgaz
Fiyatları ile İmalat ve Kimya-petrol-plastik Sektörlerinin Endeksleri Arasındaki İlişki
(The Relationship between Oil and Natural Gas Prices and Manufacturing and Chemical-
Petroleum-Plastic Industry). Niğde Üniversitesi İktisadi ve İdari Bilimler Fakültesi Der-
gisi , 6 (2), 64–74.
Oğuz, A. (2018). Özelleştirmenin Gerekçesi ve Etkinliği: Petro-Kimya Firmaları Üzerine
Bir Uygulama (Rationale and Effectiveness of Privatization: An Application on Petro-
Chemical Companies). In A. Oğuz (Ed.), Türkiye’de Ekonomi-Yönetim-Siyaset Üzerine
(On Economy-Management-Politics in Turkey). Academia Publishing.
30World Journal of Applied Economics 2021(1)
Phillips, P., & Perron, P. (1988). Testing for a Unit Root in Time Series Regression.
Biometrika, 75 (2), 335–46. doi:10.2307/2336182
Rafiq, S., Salim, R., & Bloch, H. (2009). Impact of Crude Oil Price Volatility on Economic
Activities: An Empirical Investigation in the Thai Economy. Resources Policy, 34 (3),
121–32. doi:10.1016/j.resourpol.2008.09.001
Sims, C. A. (1980). Macroeconomics and Reality. Econometrica, 48 (1), 1–48.
doi:10.2307/1912017
Stock, J. H., & Watson, M. W. (2001). Vector Autoregressions. Journal of Economic
perspectives, 15 (4), 101–15. doi:10.1257/jep.15.4.101
Turkish Plastics Industrialists Research, Development and Education Foundation (PAGEV).
(2021). Petrokimya Endüstrisi ile İlgili Sorular, Cevaplar (Questions and Answers Re-
lated to the Petrochemical Industry). https://pagev.org/petrokimya-endustrisi-ile
-ilgili-sorular-cevaplar.
Turkish Statistical Institute (TURKSTAT). (2021). Producer Price Index. https://
tuikweb.tuik.gov.tr.
Verbeek, T., & Mah, A. (2020). Integration and Isolation in the Global Petrochemical
Industry: A Multiscalar Corporate Network Analysis. Economic Geography, 96 (4), 363–
87. doi:10.1080/00130095.2020.1794809
Weinhagen, J. (2002). An Empirical Analysis of Price Transmission by Stage of Processing.
Monthly Labor Review , 125 (11), 3–11. doi:10.1023/A:1011043120145
31BIST Petrochemical Market
Appendix: Additional Tables
Table A.1: Results of Variance Decomposition for VAR model
Variance Decomposition of Lreelbistpetrochemical
Period S.E. Lreelbistpetro Doilprice Dexchangerate Lpandemicindex
1 0.0361 100.0000 0.0000 0.0000 0.0000
2 0.0493 99.1908 0.2584 0.2302 0.3206
3 0.0575 98.5065 0.5122 0.3041 0.6772
4 0.0643 97.5661 1.1084 0.3596 0.9659
5 0.0702 96.6818 1.6983 0.4461 1.1738
6 0.0754 95.8693 2.2356 0.5185 1.3766
7 0.0799 95.0031 2.7988 0.5541 1.6439
8 0.0841 93.9731 3.4475 0.5728 2.0066
9 0.0879 92.7548 4.2000 0.5879 2.4573
10 0.0916 91.3629 5.0573 0.6017 2.9781
11 0.0950 89.8131 6.0148 0.6136 3.5586
12 0.0983 88.1113 7.0681 0.6233 4.1973
Variance Decomposition of Doilprice:
Period S.E. Lreelbistpetro Doilprice Dexchangerate Lpandemicindex
1 0.0535 5.4239 94.5761 0.0000 0.0000
2 0.0571 9.2699 83.2126 0.4050 7.1124
3 0.0595 8.7104 79.6889 0.3728 11.2279
4 0.0604 8.6097 78.8751 1.2572 11.2580
5 0.0606 8.5699 78.5019 1.5795 11.3486
6 0.0607 8.6123 78.2731 1.5799 11.5348
7 0.0608 8.7004 78.1745 1.5886 11.5365
8 0.0608 8.7463 78.1030 1.5972 11.5535
9 0.0608 8.7683 78.0174 1.5992 11.6151
10 0.0609 8.7907 77.9497 1.5974 11.6621
11 0.0609 8.8173 77.9056 1.5955 11.6816
12 0.0609 8.8449 77.8722 1.5941 11.6887
Variance Decomposition of Dexchangerate
Period S.E. Lreelbistpetro Doilprice Dexchangerate Lpandemicindex
1 0.0142 12.5719 0.0049 87.4233 0.0000
2 0.0163 22.0282 0.5318 77.3615 0.0785
3 0.0164 21.9036 0.5751 77.3689 0.1525
4 0.0166 22.8834 0.6104 76.1693 0.3369
5 0.0166 22.9141 0.6667 76.0658 0.3534
6 0.0166 22.8928 0.6660 76.0702 0.3709
7 0.0166 22.9342 0.6790 75.9892 0.3976
8 0.0166 23.0163 0.6898 75.8882 0.4057
9 0.0166 23.0719 0.6968 75.8239 0.4075
10 0.0166 23.1108 0.7035 75.7769 0.4089
11 0.0166 23.1489 0.7107 75.7287 0.4116
12 0.0166 23.1865 0.7191 75.6779 0.4165
Variance Decomposition of Lpandemicindex
Period S.E. Lreelbistpetro Doilprice Dexchangerate Lpandemicindex
1 0.1075 2.1851 39.3875 0.0000 58.4274
2 0.2165 3.6574 44.8657 0.0342 51.4428
3 0.2956 4.8404 47.1472 0.0469 47.9655
4 0.3551 5.6343 49.6268 0.0583 44.6805
5 0.4031 6.1201 51.5673 0.0691 42.2435
6 0.4458 6.4011 52.7884 0.0722 40.7384
7 0.4868 6.5050 53.4849 0.0660 39.9441
8 0.5279 6.4765 53.9158 0.0580 39.5498
9 0.5695 6.3623 54.2679 0.0517 39.3182
10 0.6111 6.2023 54.6192 0.0480 39.1305
11 0.6527 6.0236 54.9721 0.0463 38.9580
12 0.6943 5.8383 55.3070 0.0456 38.8091
Cholesky Ordering: Lreelbistpetrochemical, Doilprice, Dexchangerate, Lpandemicindex
32World Journal of Applied Economics 2021(1)
Table A.2: Lag length selection in VAR model
Endogenous variables: Lreelbistpetrochemical, Doilprice, Dexchang-
erate, Lpandemicindex
Exogenous variables: C
Sample: 2002M01 2021M01
Observations: 220
Lag LogL LR FPE AIC SC HQ
0 788.204 NA 9.42e-09 -7.129 -7.067 -7.104
1 1551.297 1491.500 1.06e-11 -13.921 -13.612 -13.796
2 1645.155 180.036 5.21e-12 -14.629 -14.073* -14.404*
3 1662.762 33.133* 5.14e-12* -14.643* -13.841 -14.319
4 1676.840 25.980 5.23e-12 -14.626 -13.577 -14.202
5 1687.634 19.528 5.49e-12 -14.578 -13.283 -14.055
* Lag order selected by the criterion.
LR: Sequential modified LR test statistic (each test at 5% level)
FPE: Final Prediction Error
AIC: Akaike Information Criterion
SC: Schwarz Information Criterion
HQ: Hannan-Quinn information criterion
Table A.3: VAR Granger Causality/Block Exogeneity Wald Tests
Excluded Chi-sq df Prob.
Dependent variable: Lbistpetrochemical
Doilprice 0.531 3 0.912
Dexchangerate 0.985 3 0.805
lpandemindex 6.216 3 0.102
All 7.867 9 0.548
Dependent variable: Doilprice
Lbistpetrochemical 14.638 3 0.002
Dexchangerate 4.290 3 0.232
lpandemindex 31.897 3 0.000
All 50.376 9 0.000
Dependent variable: Dexchangerate
Lbistpetrochemical 17.735 3 0.001
Doilprice 0.581 3 0.901
lpandemindex 0.373 3 0.946
All 22.239 9 0.008
Dependent variable: lpandemindex
Lbistpetrochemical 2.150 3 0.542
Doilprice 9.535 3 0.023
Dexchangerate 0.495 3 0.920
All 13.617 9 0.137
33You can also read