Machine Learning-Enabled 30-Day Readmission Model for Stroke Patients
←
→
Page content transcription
If your browser does not render page correctly, please read the page content below
ORIGINAL RESEARCH
                                                                                                                                                 published: 31 March 2021
                                                                                                                                           doi: 10.3389/fneur.2021.638267

                                               Machine Learning-Enabled 30-Day
                                               Readmission Model for Stroke
                                               Patients
                                               Negar Darabi 1 , Niyousha Hosseinichimeh 1*, Anthony Noto 2 , Ramin Zand 2 and
                                               Vida Abedi 3,4*
                                               1
                                                 Department of Industrial and Systems Engineering, Virginia Tech, Falls Church, VA, United States, 2 Geisinger Neuroscience
                                               Institute, Geisinger Health System, Danville, PA, United States, 3 Department of Molecular and Functional Genomics,
                                               Geisinger Health System, Danville, PA, United States, 4 Biocomplexity Institute, Virginia Tech, Blacksburg, VA, United States

                            Edited by:         Background and Purpose: Hospital readmissions impose a substantial burden on
                            Ping Zhou,         the healthcare system. Reducing readmissions after stroke could lead to improved
The University of Rehabilitation, China
                                               quality of care especially since stroke is associated with a high rate of readmission.
                         Reviewed by:
                                               The goal of this study is to enhance our understanding of the predictors of 30-day
                           Harshil Shah,
      Guthrie Robert Packer Hospital,          readmission after ischemic stroke and develop models to identify high-risk individuals
                           United States       for targeted interventions.
                           Varun Kumar,
           University of South Florida,        Methods: We used patient-level data from electronic health records (EHR), five machine
                           United States
                                               learning algorithms (random forest, gradient boosting machine, extreme gradient
                            Jianjun Zou,
  Nanjing Hospital Affiliated to Nanjing       boosting–XGBoost, support vector machine, and logistic regression-LR), data-driven
             Medical University, China         feature selection strategy, and adaptive sampling to develop 15 models of 30-day
             Lucas Alexandre Ramos,
                    Academic Medical
                                               readmission after ischemic stroke. We further identified important clinical variables.
                  Center, Netherlands
                                               Results: We included 3,184 patients with ischemic stroke (mean age: 71 ± 13.90
                   *Correspondence:
                                               years, men: 51.06%). Among the 61 clinical variables included in the model, the National
                           Vida Abedi
                vidaabedi@gmail.com;           Institutes of Health Stroke Scale score above 24, insert indwelling urinary catheter,
                 vabedi@geisinger.edu          hypercoagulable state, and percutaneous gastrostomy had the highest importance
             Niyousha Hosseinichimeh
                     niyousha@vt.edu
                                               score. The Model’s AUC (area under the curve) for predicting 30-day readmission was
                                               0.74 (95%CI: 0.64–0.78) with PPV of 0.43 when the XGBoost algorithm was used with
                    Specialty section:         ROSE-sampling. The balance between specificity and sensitivity improved through the
          This article was submitted to
                                               sampling strategy. The best sensitivity was achieved with LR when optimized with feature
                                Stroke,
                a section of the journal       selection and ROSE-sampling (AUC: 0.64, sensitivity: 0.53, specificity: 0.69).
                 Frontiers in Neurology
                                               Conclusions: Machine learning-based models can be designed to predict 30-day
       Received: 05 December 2020
          Accepted: 08 March 2021
                                               readmission after stroke using structured data from EHR. Among the algorithms
         Published: 31 March 2021              analyzed, XGBoost with ROSE-sampling had the best performance in terms of AUC
                             Citation:         while LR with ROSE-sampling and feature selection had the best sensitivity. Clinical
 Darabi N, Hosseinichimeh N, Noto A,
                                               variables highly associated with 30-day readmission could be targeted for personalized
 Zand R and Abedi V (2021) Machine
            Learning-Enabled 30-Day            interventions. Depending on healthcare systems’ resources and criteria, models with
        Readmission Model for Stroke           optimized performance metrics can be implemented to improve outcomes.
  Patients. Front. Neurol. 12:638267.
     doi: 10.3389/fneur.2021.638267            Keywords: ischemic stroke, 30-day readmissions, machine learning, statistical analysis, patient readmission

Frontiers in Neurology | www.frontiersin.org                                          1                                            March 2021 | Volume 12 | Article 638267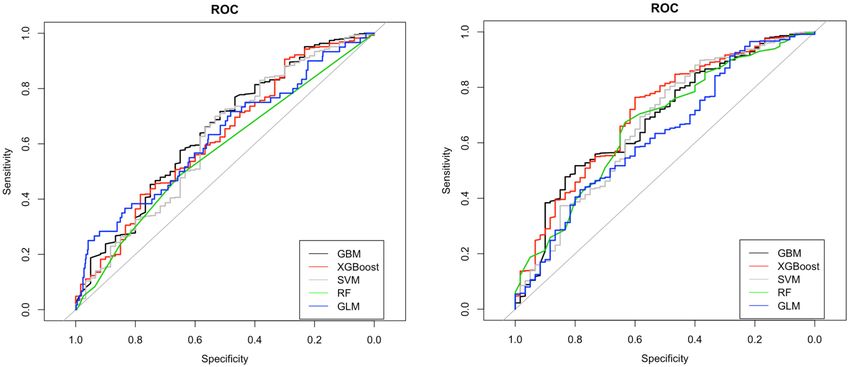
Darabi et al. Machine Learning for 30-Day Readmission
INTRODUCTION compensation, and other government payers) were also included.
Other variables in this study were six discharge destinations
Hospital readmissions impose a substantial financial burden, (discharged to the home health organizations; discharged to
costing Medicare about $26 billion annually (1). Centers for home, court, or against medical advice; discharged to hospice-
Medicare and Medicaid Services (CMS) has made reducing 30- home/hospice-medical facility; discharged or transferred to other
day readmission rates a national healthcare reform goal (2) as a facilities; discharged or transferred to Skilled Nursing Facility,
way to improve hospital care. Reducing readmissions after stroke SNF; discharged or transferred to another rehab facility), and
could lead to improved quality of care especially since stroke is five clinical interventions (intravenous thrombolysis; insert
associated with a high rate of readmission (3). indwelling urinary catheter; endotracheal tube; percutaneous
Studies have found that stroke severity (3, 4), being gastrostomy; and hemodialysis). In addition, a total of 47
discharged to skilled nursing, intermediate care facility, hospice, comorbidities were included (see Table 1).
or left against doctor’s advice (2, 3, 5–7), being enrolled in
Medicaid/Medicare (4, 6, 8, 9), and being married (5) were Data Processing, Feature Selection, and
associated with higher readmissions. A longer length of hospital Sampling
stay was associated with lower readmissions among stroke Pearson’s correlation coefficient was applied to continuous
patients (5). Heart failure (2, 6, 9), coronary artery disease variables to identify those with high collinearity. The correlation
(10, 11), and dysphagia (4) were also correlated with stroke matrix between all the predictors along with a list of correlations
readmissions. Additionally, patients with anemia, dementia, above 30 and 50% is provided in Supplementary Figure I and
malnutrition, and diabetes were more likely to be readmitted Supplementary Table II (12), respectively. The complete list
within 30-day (2, 5, 6, 9). of variables along with their descriptive statistics and level of
However, previous studies [Supplementary Table I (12)] missingness was provided in Table 1. Student’s t-test was applied
included a limited number of variables and used logistic to identify the significant difference between two groups of
regression which restricts the number of included interactions patients (i.e., readmitted and not readmitted) for each predictor
among the variables (13, 14), thus limiting the model and the test statistics and P-values were reported in Table 1.
performance. Machine learning (ML), more appropriate for Some of the variables were suffering from missing
high-dimensional datasets (15, 16), has been successfully applied observations (see Table 1). Imputation, using Multivariate
for predicting readmissions after heart failure (17–19), heart Imputation by Chained Equations (MICE) package in R (25),
attack (20), and other causes of readmissions (21, 22). The was performed separately on the training and testing sets to
goal of this study was to develop prediction models of 30- ensure an unbiased evaluation of the final model. For the
day readmission among patients with ischemic stroke and variables with high missingness, we performed an assessment
identify associated predictors for the development of a more of the distribution of the variable before and after imputation.
targeted intervention. We used two sets of variables, set one was the comprehensive
set including all the variables, and set two included variables
METHODS selected based on data-driven feature selection, where variables
with high collinearity were removed. We used the random
Study Population forest classification algorithm by Boruta package in RStudio
This study was based on the retrospective analysis of (26) for our data-driven feature selection. Further, to avoid
prospectively collected data from acute ischemic stroke the poor performance of the minority class compared to the
(AIS) patients at two tertiary centers in Geisinger Health System dominant class, we applied an adaptive sampling strategy, where
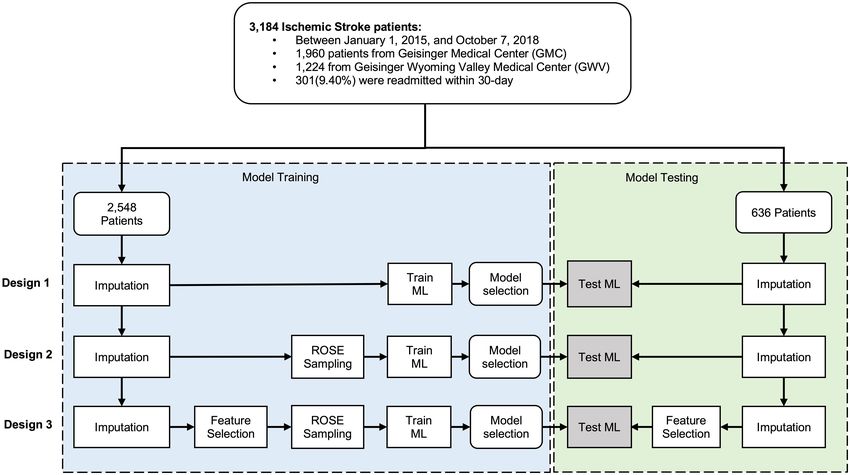
between January 1, 2015, and October 7, 2018 (23). The data were we balanced the dataset by applying the Random Over-Sampling
extracted from electronic health records and de-identified. As a Examples (ROSE) algorithm on the minority class (27). The data
part of the de-identification process, the age of patients older than cleaning and preparation were performed in STATA 14.0 (28)
89 years old was masked. Patients younger than 18 years of age and the analyses were performed using R 3.6.0 (29) in R studio.
were excluded from this study. Patients with transient ischemic Figure 1 shows the processing and modeling pipeline.
attack were not included in this study due to the high rate of
overdiagnosis (24). The study was reviewed and approved by Model Development
the Geisinger Institutional Review Board to meet “Non-human The de-identified dataset was randomly split into the train set
subject research,” for using de-identified information. (80%) and test set (20%). We developed models to predict 30-
day readmission of ischemic stroke using the training dataset
Data Elements and used ten-fold cross-validation to select the best performing
The outcome measure was hospital readmission within 30- model. Overall, we built fifteen models – based on five different
day after discharge among patients with AIS. Independent algorithms – following three study designs (Design 1, 2, and 3, see
variables included patient age, length of stay (LOS), gender, Figure 1). The five algorithms included logistic regression (LR),
marital status (married, single, and previously married), and the random forest (RF), gradient boosting machine (GBM), extreme
National Institutes of Health Stroke Scale (NIHSS). The types gradient boosting (XGBoost), and support vector machines
of health insurance at the time of first admission (Medicare, (SVM). Parameter tuning was performed by an automatic grid
Medicaid, private, direct employer contract, self-pay, worker search with ten different values to randomly try for each
Frontiers in Neurology | www.frontiersin.org 2 March 2021 | Volume 12 | Article 638267Darabi et al. Machine Learning for 30-Day Readmission
TABLE 1 | Descriptive statistics of variables.
Variables Missing Not Readmitted Readmitted t statistics P-value
(n = 2883) (n = 301)
Age (y), Mean (SD) 12 71.10(13.90) 71.50(12.90) −0.52 0.60
LOSa (d), Median (IQR) 319 3 (1, 76) 4 (1, 24) −4.03 0.00
All gender 12 2873 299 – –
Gender, n (%) Female 1406 (48.80) 155 (51.50) −0.90 0.39
Male 1467 (50.90) 144 (47.80) 1.00 0.31
Total 12 2873 299
Marital Status, n (%) Married 1349 (46.80) 124 (41.20) 1.85 0.06
Single 425 (14.70) 45 (15.00) −010 0.92
Previously married 1099 (38.10) 130 (43.20) −1.72 0.08
0 to above 24 2545 580 59 – –
NIHSS Score, n (%) 0 to 4 330 (11.40) 31 (10.30) 0.60 0.55
5 to 11 150 (5.20) 17 (5.60) −0.33 0.74
12 to 23 75 (2.60) 10 (3.30) −0.74 0.46
Above 24 25 (0.90) 1 (0.30) 0.98 0.33
Total - 291 36 – –
Procedures, n (%) Intravenous thrombolysis 71 (3.00) 2 (0.80) 2.06 0.04
Insert indwelling urinary catheters 3 (0.10) 1 (0.30) −1.07 0.28
Insert endotracheal tube 148 (5.10) 10 (3.30) 1.35 0.17
Percutaneous gastrostomy 42 (1.50) 16 (5.40) −4.81 0.00
Hemodialysis 27 (0.90) 7 (2.30) −2.25 0.02
All centers - 2883 301 – –
Hospital, n (%) GMCb 1784 (61.90) 176 (58.50) 1.08 0.27
GWVc 1099 (38.10) 125 (41.50) −1.16 0.25
Total 492 2418 274 – –
Discharge Status, n (%) Discharged to home health organization 346 (12.00) 37 (12.30) −0.15 0.88
Discharged to home, court, or against 902 (31.30) 57 (18.90) 4.46 0.00
medical advice
Discharged to 82 (2.80) 4 (1.30) 1.54 0.12
hospice-home/hospice-medical facility
Discharged/transferred to other facilities 27 (0.90) 2 (0.70) 0.47 0.63
Discharged/transferred to SNF d 447 (15.50) 91 (30.20) −6.53 0.00
Discharged/transferred to another rehab 614 (21.30) 83 (27.60) −2.51 0.01
facility
Total 51 2836 297 – –
Payer, n (%) Direct employer contract 65 (2.30) 9 (3.00) −0.80 0.42
Medicaid 216 (7.50) 22 (7.30) 0.11 0.91
Medicare 2037 (70.70) 230 (76.40) −2.10 0.03
Other government payers 58 (2.00) 4 (1.30) 0.81 0.41
Private 425 (14.70) 30 (1.00) 2.25 0.02
Self-pay 32 (1.10) 1 (0.30) 1.27 0.20
Workers compensation 3 (0.10) 1 (0.30) −1.06 0.29
Diagnoses, n (%) Anemia - 319 (13.70) 67 (26.40) −5.42 0.00
Atrial fibrillation 691 (29.40) 93 (36.30) −2.29 0.02
Anxiety disorders 328 (14.00) 53 (20.70) −2.90 0.00
Cerebral arterial dissection 23 (1.00) 6 (2.30) −1.98 0.05
Coronary artery disease 684 (29.10) 77 (30.10) −0.32 0.75
Delirium 44 (1.90) 12 (4.70) −2.95 0.00
Dementia 222 (9.50) 35 (13.70) −2.15 0.03
Diabetes 642 (27.50) 86 (33.90) −2.13 0.03
Dysphagia 150 (6.40) 29 (11.30) −2.97 0.00
Heart failure 426 (18.30) 64 (25.20) −2.67 0.00
(Continued)
Frontiers in Neurology | www.frontiersin.org 3 March 2021 | Volume 12 | Article 638267Darabi et al. Machine Learning for 30-Day Readmission
TABLE 1 | Continued
Variables Missing Not Readmitted Readmitted t statistics P-value
(n = 2883) (n = 301)
Hypercoagulable state 17 (0.70) 7 (2.70) −3.20 0.00
Hypertension 1308 (56.10) 131 (51.60) 1.38 0.17
Hypotension 55 (2.30) 13 (5.10) −2.61 0.00
Kidney disease 670 (28.50) 101 (39.50) −3.65 0.00
Malignancy 286 (12.20) 47 (18.40) −2.82 0.00
Malnutrition 105 (4.50) 32 (12.50) −5.49 0.00
Migraine 69 (2.90) 13 (5.10) −1.86 0.06
Overweight 58 (2.50) 16 (6.20) −3.46 0.00
Tobacco use 1171 (49.90) 143 (55.90) −1.83 0.07
Venous thrombosis 81 (3.40) 18 (7.00) −2.85 0.00
Acute myocardial infarction 36 (1.50) 9 (3.50) −2.31 0.02
Alcohol use 95 (4.00) 10(3.90) 0.11 0.91
Arrhythmias 99 (4.20) 15 (5.90) −1.22 0.22
Blindness 14 (0.60) 1 (0.40) 0.41 0.68
Cardiac valvular disease 159 (6.80) 22 (8.60) −1.09 0.27
Cardiomyopathy 131 (5.60) 23 (9.00) −2.20 0.03
Cerebral atherosclerosis 93 (4.00) 13 (5.10) −0.86 0.39
Chronic kidney disease 583 (25.00) 89 (35.00) −3.47 0.00
Chronic liver disease 49 (2.10) 2 (0.80) 1.43 0.15
Chronic lung disease 476 (20.30) 69 (27.00) −2.50 0.01
Dysautonomia 16 (0.70) 2 (0.80) −0.18 0.85
Hyperlipidemia 1537 (65.40) 177 (69.10) −1.19 0.23
Intracerebral hemorrhage 521 (22.20) 51 (19.90) 0.83 0.41
Inflammatory disorders 66 (2.80) 5 (2.00) 0.80 0.42
Mood disorders 372 (15.80) 58 (22.70) −2.79 0.00
Non-compliance 107 (4.60) 12 (4.70) −0.09 0.92
Normal weight 44 (1.90) 11 (4.30) −2.56 0.01
Obese 466 (19.80) 62 (24.20) −1.65 0.09
Palliative care on board 254 (10.80) 12 (4.70) 3.08 0.00
Peripheral vascular disease 125 (5.30) 17 (6.60) −0.88 0.38
Respiratory failure 164 (7.00) 19 (7.40) −0.26 0.79
Seizure disorders 96 (4.10) 15 (5.90) −1.33 0.18
Sleep apnea 216 (9.20) 25 (9.80) −0.30 0.76
Systemic infection 63 (2.70) 16 (6.20) −3.17 0.00
Thyroid disease 445 (18.90) 54 (21.10) −0.83 0.41
Underweight 34 (1.40) 9 (3.50) −2.47 0.01
Use of steroids 72 (3.10) 11 (4.30) −1.06 0.29
Year, Median (IQR) – 2016 (2015, 2018) 2016 (2015, 2018) −0.36 0.72
a, length of stay; b , geisinger medical center, c , Geisinger wyoming valley, d , skilled nursing facility.
algorithm parameter. All the hyperparameter evaluation and as sensitivity or recall, specificity, and positive predictive value
model development were performed using the Caret package in (PPV) as well as training time.
R Studio (30). We ran the SVM with and without normalization
of the dataset. In normalization, we scaled the data to calculate RESULTS
the standard deviation for an attribute and divided each value by
that standard deviation. Then we centered the data to calculate Study Design and Population
the mean for an attribute and subtracted it from each value. The Characteristics
performance measures of the models were evaluated using the A total number of 3,184 AIS patients [1,960 patients from
20% test set. To compare the performance of the applied models, Geisinger Medical Center (GMC) and 1,224 from Geisinger
we calculated the area under the receiver operating characteristic Wyoming Valley Medical Center (GWV)] were included in
curve (AUC). We also used other performance measures such this study.
Frontiers in Neurology | www.frontiersin.org 4 March 2021 | Volume 12 | Article 638267Darabi et al. Machine Learning for 30-Day Readmission
FIGURE 1 | Data processing flowchart.
Among 3,184 patients with ischemic stroke, 301(9.40%) and Supplementary Figures II, III (12)]. Feature selection
were readmitted within 30-day. The train set and test set was performed using the Boruta package which reduced the
included 2,548 (80%) and 636 (20%) patient-level observations, number of features from 52 to 14 [see green variables in
respectively. In Table 1, the patients were compared based on Supplementary Figure IV (12)]. These 14 attributes were used
diverse characteristics including demographic characteristics, in the third design while all features were included in the
medical history prior to the ischemic stroke event, and stroke other designs.
severity using the NIHSS score. Continuous variables were The ROC curves for LR, RF, GBM, XGBoost, and SVM
presented as mean and standard deviation and as median with without feature selection and sampling (Design 1) and with
interquartile range (IQR). The average age of patients was 71 ROSE-sampling (Design 2) were shown in the top and
(interquartile range, IQR: 18–89) and 1,611(50.60%) patients bottom side of Figure 2 accordingly. In the absence of
were men. There was a significant difference between patients sampling and feature selection, GBM provided the highest
who were readmitted and those who were not in terms of AUC (0.68), specificity (0.95), and PPV (0.33) when compared
median LOS, being married or previously married, discharged to the other models (Figure 2 and Table 2). However, the
to SNF or against medical advice, and having Medicare or best AUC (0.74), PPV (0.43), and specificity (0.98) were
private insurance. reached when ROSE-sampling was applied. The optimal model
parameters for ROSE-sampled XGBoost were max-depth =
Models Can Be Trained to Predict 30-Day 4, subsample = 0.50, colsample_bytree = 0.80, gamma = 0,
Readmission Using EHR and min_child_weight = 10. In terms of AUC, specificity, and
The performance metrics—AUC and its 95% confidence interval PPV, the LR in Design 2 had poor performance compared
(CI), sensitivity, specificity, PPV, and the training time —for to XGBoost and GBM models. However, LR with feature
all the 15 models with and without ROSE-sampling (Design selection and ROSE-sampling (Design 3) provided the highest
2, and 1), and with feature selection and ROSE-sampling sensitivity (0.53) relative to other models. We also performed
(Design 3) were reported in Table 2. The CIs for the test SVM with normalized data and the results are provided
sets were calculated using bootstrapping. We also provided the in Supplementary Table IV.
confusion matrices of all 15 models in Supplementary Table V. The training times for LR, RF, and GBM were faster when
The results showed that applying ROSE for addressing class compared to models based on XGBoost and SVM (see Table 2).
imbalance during the model training improved the AUC, PPV, The model training was performed using MacBook Pro14,2, four
and specificity of models during the testing phase. However, thunderbolt 3 ports with 3.1 GHz Dual-Core Intel Core i5, and 8
feature selection did not improve the results [see Table 2, GB memory. Overall, the addition of the sampling step increased
Frontiers in Neurology | www.frontiersin.org 5 March 2021 | Volume 12 | Article 638267Darabi et al. Machine Learning for 30-Day Readmission
TABLE 2 | Performance metrics for machine learning models.
Train set Test set
Method AUC Training Time (s) AUC 95% CI for AUC Sensitivity Specificity PPV
No feature selection and sampling (Design 1)
LR 0.76 3 0.60 (0.52, 0.67) 0.32 0.86 0.19
RF 0.82 42 0.57 (0.50, 0.64) 0.09 0.93 0.12
GBM 0.70 48 0.68 (0.52, 0.76) 0.23 0.95 0.33
XGBoost 0.76 1,752 0.62 (0.56, 0.69) 0.30 0.88 0.21
SVM 0.98 990 0.62 (0.56, 0.70) 0.30 0.86 0.18
With ROSE-sampling (Design 2)
LR 0.74 3 0.63 (0.55, 0.70) 0.38 0.72 0.12
RF 0.74 33 0.67 (0.51, 0.76) 0.09 0.97 0.26
GBM 0.74 48 0.70 (0.61, 0.75) 0.09 0.98 0.45
XGBoost 0.76 2,340 0.74 (0.64, 0.78) 0.20 0.98 0.43
SVM 0.83 1,689 0.67 (0.59, 0.74) 0.38 0.89 0.27
With feature selection and ROSE-sampling (Design 3)
LR 0.70 3 0.64 (0.56, 0.72) 0.53 0.69 0.15
RF 0.70 12 0.65 (0.56, 0.70) 0.30 0.89 0.24
GBM 0.69 30 0.66 (0.58, 0.74) 0.17 0.95 0.26
XGBoost 0.70 2,130 0.65 (0.56, 0.73) 0.17 0.95 0.27
SVM 0.72 960 0.64 (0.56, 0.72) 0.42 0.77 0.16
FIGURE 2 | ROC curves for machine learning models with (bottom) and without (top) ROSE-sampling. GBM, gradient boosting machine; XGBoost, extreme gradient
boosting; SVM, support vector machines; RF, random forest; and GLM, generalized linear model with logit link which is logistic regression in our study.
the training time, while having fewer features resulted in faster According to the variable importance scores for XGBoost in
training as expected. Design 2 (Table 3), the top 10 predictors of 30-day readmission
were NIHSS above 24, insert indwelling urinary catheter,
NIHSS, Insert Indwelling Urinary Catheter, hypercoagulable state, percutaneous gastrostomy, using workers
compensation as insurance, hemodialysis, overweight, cerebral
Hypercoagulable State, and Percutaneous arterial dissection, malnutrition, intravenous thrombolysis, and
Gastrostomy Are the Top Predictors of venous thrombosis.
30-Day Readmission We also reported the result of LR in the third design.
Using XGBoost in Design 2, the best predictive model, we In the latter, the multicollinearity was addressed by feature
identified the most important predictors of 30-day readmission. selection (Table 4). The odds ratios (OR), log odds, 95% CI,
Frontiers in Neurology | www.frontiersin.org 6 March 2021 | Volume 12 | Article 638267Darabi et al. Machine Learning for 30-Day Readmission
TABLE 3 | Variable importance scores of the XGBoost model with TABLE 4 | Logistic regression results for predictors of 30-day readmission in
ROSE-sampling (Design 2). ischemic stroke patients (Design 3).
No. Variable Importance Variables OR Log 95% CI P-value
Score Odds (2.5%, 97.5%)
(out of 100)
(Intercept) 0.25 −1.39 −2.55 −0.30 0.01
1 NIHSS above 24 100.00 Age 0.99 −0.01 −0.03 0.00 0.07
2 Insert Indwelling Urinary Catheter 89.94 Discharged to home health 1.61 0.47 −0.01 0.94 0.05
3 Hypercoagulable State 61.95 organization
4 Percutaneous Gastrostomy 40.04 Discharged to hospice-home or 0.44 −0.83 −2.04 0.28 0.16
5 Payer Workers Compensation 37.78 hospice-medical facility
6 Hemodialysis 35.13 Discharged/transferred to other 0.49 −0.70 −2.62 0.66 0.38
facilities
7 Overweight 33.35
Discharged/transferred to another 1.79 0.58 0.17 0.99 0.01
8 Cerebral Arterial Dissection 30.61
rehab facility
9 Malnutrition 25.74
Discharged/transferred to SNF 2.77 1.02 0.56 1.48 0.00
10 intravenous thrombolysis 24.15
Medicaid 0.41 −0.89 −1.79 0.07 0.06
11 Venous Thrombosis 22.94
Medicare 0.57 −0.55 −1.31 0.30 0.17
12 Discharged to Hospice-Home or Hospice-Medical Facility 17.15
Other government payers 0.39 −0.93 −2.33 0.32 0.16
13 Palliative Care on Board 14.92
Private insurance 0.40 −0.91 −1.75 −0.00 0.04
14 Delirium 14.54
Self-pay 0.29 −1.23 −4.21 0.59 0.27
15 Payer Self-Pay 14.42
Workers compensation 1.82 0.60 −2.59 3.04 0.65
Chronic kidney disease 1.28 0.24 −0.36 0.89 0.44
Hypercoagulable state 3.09 1.13 0.18 1.99 0.01
and P-values were reported in this table. This analysis revealed Kidney disease 1.15 0.14 −0.49 0.72 0.65
that being discharged to SNF, malignancy, and malnutrition were Malignancy 2.10 0.74 0.37 1.09 0.00
significantly associated with stroke readmission within 30-day (p- Malnutrition 2.51 0.92 0.39 1.42 0.00
value < 0.0001). Also, being discharged to a rehabilitation facility Palliative care on board 1.13 0.13 −0.73 0.90 0.76
and stroke severity above twelve were significantly associated Respiratory failure 0.74 −0.30 −1.06 0.39 0.41
with 30-day readmission at 0.001 significance level. Underweight 1.00 0.00 −1.01 0.91 0.99
Insert endotracheal tube 0.86 −0.15 −1.11 0.74 0.76
Percutaneous gastrostomy 1.39 0.33 −0.51 1.09 0.42
DISCUSSION
NIHSS 12 to 23 1.76 0.57 0.14 0.99 0.01
We have taken a comprehensive approach to identify and NIHSS 5 to 11 0.65 −0.43 −0.79 −0.08 0.02
prioritize factors associated with 30-day readmissions after NIHSS above 24 0.17 −1.77 −3.25 −0.65 0.01
ischemic stroke. We aimed to find the most effective predictive
model by comparing the results of different ML techniques and
LR. There have been multiple readmission studies that developed
predictive models for the chances of 30-day readmission in stroke structured data from EHR. ML algorithms can include higher-
patients. However, most of these models used LR (31) which order interactions among variables, handle multicollinearity, and
limits the inclusion of higher-order interactions among variables improve readmission predictions when applied to large and high-
and does not perform well in the presence of collinearity. dimensional datasets (15). This study was the first in predicting
Also, many studies considered readmission after 90 days or the associated variables of 30-day ischemic stroke readmission
1 year as a dependent variable which is a long follow-up using ML techniques. Our findings indicated that the best
period, as CMS penalizes healthcare systems for readmission performance in terms of AUC, specificity, and PPV was obtained
under 30 days. In this study, we addressed these gaps and when XGBoost was used with ROSE-sampling.
improved the prediction performance of readmissions in stroke Past studies that used ML techniques to improve the
patients using a wide range of potential risk factors and the prediction power, either performed their analysis on readmission
proper ML techniques. Our results show that depending on the more than 30-day or studied other causes of readmission such as
resources and criteria of healthcare systems, a predictive model heart failure (17, 18, 21). However, our best performing model
with optimized performance metrics can be used to improve (XGBoost in Design 2) provides higher AUC and PPV compared
decision making. to these studies [See Supplementary Table III (12)].
Machine Learning-Based Models Can Be Clinical Features Highly Associated With
Trained to Predict 30-Day Readmission 30-Day Readmission
The results of this study indicate that ML-based models can The results of our best performing model (XGBoost in Design
be designed to predict 30-day readmission after stroke using 2) showed that NIHSS score above 24, insert indwelling urinary
Frontiers in Neurology | www.frontiersin.org 7 March 2021 | Volume 12 | Article 638267Darabi et al. Machine Learning for 30-Day Readmission
catheter, hypercoagulable state, percutaneous gastrostomy, and achieved comparable AUC for the testing and training sets,
insurance type are among factors with the highest importance. confirming that these models did not suffer from overfitting
The common significant predictors of the 30-day readmission in (Design 2 in Table 2). However, the SVM-based models had the
both XGBoost in Design 2 and LR in Design 3 included NIHSS largest difference between testing and training AUC, leading to
score above 24, hypercoagulable state, and malnutrition. Since the possibility of overfitting given this dataset. Overall, ML-based
NIHSS is an important variable and this variable also suffered models such as GBM and XGBoost improved the prediction of
from high missingness, we assessed its distribution before and 30-day readmission in stroke patients compared to traditional
after imputation for both train and test sets. Our results LR [see Table 2, Supplementary Figures II, III (12)]. However,
corroborate that the distribution of this variable remains the LR with feature selection and ROSE-sampling provided the best
same after applying imputation (see Supplementary Table VI, sensitivity which implies that healthcare systems can choose their
Supplementary Figures V, VI). decision models based on their resources and criteria.
Additionally, malignancy, NIHSS scores between 5 and 23,
private insurance type, and being discharged to a rehabilitation
facility or SNF were only significant in the LR, and they LIMITATIONS
had low importance scores in the XGBoost model. Among all
variables, stroke severity and malnutrition were found significant One of the important strengths of this study was that we analyzed
predictors of 30-day readmission in ischemic stroke patients in a diverse list of potential predictors including an extensive
past studies and our results corroborated the previous findings number of clinical interventions and patient’s comorbidities. To
(2–6, 9). the best of our knowledge, this was the first attempt to apply
It has been shown in previous studies that heart failure and ML techniques to predict the 30-day readmission for ischemic
being Medicare or Medicaid user were significantly correlated stroke patients. Considering a large number of included variables
with 30-day readmission (2, 4, 6, 8, 9). However, we found no in our dataset, these ML techniques could include higher-order
evidence in favor of these assertions. Past studies provided mixed interactions among variables, and improve the prediction power
results on the importance of age, hypertension, and gender; some when compared to LR.
studies found that patients of older age were more likely to Our analysis had several limitations. Although our dataset
be readmitted (2, 5) while others showed that age was not a was rich in the number of variables, the number of patients was
significant predictor (3, 32). Also, hypertension was found as a relatively small compared to the included independent variables.
significant risk factor of readmission in a study (8) while in other Therefore, the small number of observations might result in
works authors claimed that hypertension was not significantly overfitting in the models. However, comparable AUC measures
associated with 30-day readmission (13, 32). Several studies provided by XGBoost for the testing and training sets rule out the
conducted on data from Taipei, China, and Western Australia possibility of overfitting in this model. Another limitation of this
found that gender of patients was not significantly associated work was missing data specifically for the NIHSS score. The most
with the chances of being readmitted (3, 5, 32); however, studies missing data points belonged to the NIHSS score before 2016
based on U.S. data have found women were significantly at and we applied imputation to not lose any observation or cause
higher risk of readmission (2, 8, 13). The results of the ROSE- sampling bias. Additionally, due to the unique demographic
sampled XGBoost model indicated that age, hypertension, and characteristics of this dataset (the majority of patients were white
gender–in this specific cohort–were not significantly associated and from non-urban areas), the results may not be generalizable
with 30-day readmission after ischemic stroke. We have also to other health systems.
performed a detailed analysis of our Geisinger cohort and
identified that sex was not an independent risk factor for all-
cause mortality and ischemic stroke recurrence (33). Finally, the FUTURE DIRECTIONS
identification of malnutrition provides potential new venues to
improve secondary prevention and outcome (34). In this study, we only considered ischemic stroke as the cause
of readmission. Therefore, future avenues of research can be
done by considering other stroke types and subtypes. However,
Model Performance Metrics Optimized considering the size of our dataset which came from two
Based on the Target Goals health centers from central Pennsylvania, further work needs
According to our results, the best performing predictive model, to focus on a larger population with diverse demographics to
which was ROSE-sampled XGBoost, had a 17.5% improvement introduce a generalizable model. Additionally, to improve the
in AUC compared to LR. This XGBoost performed better in prediction power, future studies may include the application of
comparison with other models of 30-day readmission in the deep learning techniques (35) as well as the integration of features
literature (17, 18, 21). We improved the AUC up to 0.74 (95% from unstructured sources such as clinical notes and imaging
CI: 0.64, 0.78) for the test set with 0.43 PPV (see Design 2 reports. Finally, improvement in parameter optimization, by
in Table 2). In the absence of sampling and feature selection, using sensitivity analysis (SA)-based approaches (36, 37) and
GBM returned very close AUC for the training and testing sets, improving the imputation for laboratory values for EHR-mining
corroborating that the models did not suffer from overfitting (38) can lead to an improvement in outcome prediction models
(Design 1 in Table 2). XGBoost and GBM with ROSE-sampling using administrative datasets. These strategies will help in model
Frontiers in Neurology | www.frontiersin.org 8 March 2021 | Volume 12 | Article 638267Darabi et al. Machine Learning for 30-Day Readmission
generalizability, improve patient representation, and reduce of the data. ND, VA, and NH: analysis of the data. ND:
algorithmic bias. implementation of the code and Drafting a significant portion of
the manuscript or figures. NH, VA, ND and RZ: interpretation
CONCLUSION of the findings. VA, RZ, and NH: editing the manuscript. ND,
NH, VA, RZ, and AN: participation in discussions on the model
Our results showed that machine learning-based predictive and results. All authors contributed to the article and approved
models perform better than traditional logistic regression, the submitted version.
enabling the inclusion of a more comprehensive set of variables
into the model. The insights from this work can assist with FUNDING
the identification of ischemic stroke patients who are at higher
risk of readmission for more targeted preventive strategies. VA had financial research support from the National
Our study also indicated the importance of including multiple Institute of Health (NIH) grant no. R56HL116832 sub-
performance metrics for empowering the healthcare system to awarded to Geisinger during the study period. RZ had
choose a predictive model for implementation as an assistive financial research support from Bucknell University Initiative
decision support tool into their EHR based on their resources Program, Roche – Genentech Biotechnology Company,
and criteria. the Geisinger Health Plan Quality fund, and receives
institutional support from Geisinger Health System during
DATA AVAILABILITY STATEMENT the study period.
All relevant data are available in the ACKNOWLEDGMENTS
article/Supplementary Material. Due to privacy and other
restrictions, the primary data cannot be made openly available. The authors would like to thank Venkatesh Avula, Durgesh
Deidentified data may be available subject to data-sharing Chaudhary, and Jiang Li for thoughtful discussion during the
agreement with Geisinger Health System. Details about modeling development and Matthew C. Gass for data de-
requesting access to the data are available from the Geisinger’s identification.
corresponding author Vida Abedi.
SUPPLEMENTARY MATERIAL
AUTHOR CONTRIBUTIONS
The Supplementary Material for this article can be found
NH, VA, and RZ: conception and design of the study. VA online at: https://www.frontiersin.org/articles/10.3389/fneur.
and NH: supervision of the project. AN and VA acquisition 2021.638267/full#supplementary-material
REFERENCES 9. Smith MA, Frytak JR, Liou J-I, Finch MD. Rehospitalization and survival for
stroke patients in managed care and traditional medicare plans. Med Care.
1. LaPointe J. 3 Strategies to Reduce Hospital Readmission Rates, Costs. (2018). (2005) 43:902. doi: 10.1097/01.mlr.0000173597.97232.a0
Available online at: https://revcycleintelligence.com/news/3-strategies-to- 10. Heller RF, Fisher JD, O’Este CA, Lim LLY, Dobson AJ, Porter R. Death
reduce-hospital-readmission-rates-costs (accessed January 08, 2018). and readmission in the year after hospital admission with cardiovascular
2. Lichtman JH, Leifheit-Limson EC, Jones SB, Wang Y, Goldstein disease: the hunter area heart and stroke register. Med J Aust. (2000) 172:261–
LB. Preventable readmissions within 30 days of ischemic 5. doi: 10.5694/j.1326-5377.2000.tb123940.x
stroke among medicare beneficiaries. Stroke. (2013) 44:3429– 11. Lin H-J, Chang W-L, Tseng M-C. Readmission after stroke in a hospital-
35. doi: 10.1161/STROKEAHA.113.003165 based registry: risk, etiologies, and risk factors. Neurology. (2011) 76:438–
3. Chuang K-Y, Wu S-C, Ma A-HS, Chen Y-H, Wu C-L. Identifying factors 43. doi: 10.1212/WNL.0b013e31820a0cd8
associated with hospital readmissions among stroke patients in Taipei. J Nurs 12. Supplemental Material. Available online at: https://www.ahajournals.org/
Res. (2005) 13:117–28. doi: 10.1097/01.JNR.0000387533.07395.42 journal/str (accessed March 19, 2021).
4. Jia H, Zheng Y, Reker DM, Cowper DC, Wu SS, Vogel WB, et al. Multiple 13. Lichtman JH, Leifheit-Limson EC, Jones SB, Watanabe E, Bernheim SM,
system utilization and mortality for veterans with stroke. Stroke. (2007) Phipps MS, et al. Predictors of hospital readmission after stroke: a systematic
38:355–60. doi: 10.1161/01.STR.0000254457.38901.fb review. Stroke. (2010) 41:2525–33. doi: 10.1161/STROKEAHA.110.5
5. Wen T, Liu B, Wan X, Zhang X, Zhang J, Zhou X, et al. Risk factors associated 99159
with 31-day unplanned readmission in 50,912 discharged patients after stroke 14. Ouwerkerk W, Voors AA, Zwinderman AH. Factors influencing the
in China. BMC Neurol. (2018) 18:218. doi: 10.1186/s12883-018-1209-y predictive power of models for predicting mortality and/or heart failure
6. Smith MA, Liou J-I, Frytak JR, Finch MD. 30-day survival and hospitalization in patients with heart failure. JACC Heart Fail. (2014) 2:429–
rehospitalization for stroke patients according to physician specialty. 36. doi: 10.1016/j.jchf.2014.04.006
Cerebrovasc Dis. (2006) 22:21–6. doi: 10.1159/000092333 15. Friedman J, Hastie T, Tibshirani R. The Elements of Statistical Learning. New
7. Burke JF, Skolarus LE, Adelman EE, Reeves MJ, Brown DL. Influence York, NY; Springer series in statistics (2001).
of hospital-level practices on readmission after ischemic stroke. 16. Noorbakhsh-Sabet N, Zand R, Zhang Y, Abedi V. Artificial intelligence
Neurology. (2014) 82:2196–204. doi: 10.1212/WNL.00000000000 transforms the future of health care. Am J Med. (2019) 132:795–
00514 801. doi: 10.1016/j.amjmed.2019.01.017
8. Kennedy BS. Does race predict stroke readmission? An analysis using the 17. Mortazavi BJ, Downing NS, Bucholz EM, Dharmarajan K, Manhapra
truncated negative binomial model. J Natl Med Assoc. (2005) 97:699. A, Li S-X, et al. Analysis of machine learning techniques for heart
Frontiers in Neurology | www.frontiersin.org 9 March 2021 | Volume 12 | Article 638267Darabi et al. Machine Learning for 30-Day Readmission
failure readmissions. Circ Cardiovasc Qual Outcomes. (2016) 9:629– 31. Bambhroliya AB, Donnelly JP, Thomas EJ, Tyson JE, Miller CC, McCullough
40. doi: 10.1161/CIRCOUTCOMES.116.003039 LD, et al. Estimates and temporal trend for US nationwide 30-day hospital
18. Golas SB, Shibahara T, Agboola S, Otaki H, Sato J, Nakae T, et al. A readmission among patients with ischemic and hemorrhagic stroke. JAMA
machine learning model to predict the risk of 30-day readmissions in patients Netw open. (2018) 1:e181190. doi: 10.1001/jamanetworkopen.2018.1190
with heart failure: a retrospective analysis of electronic medical records 32. Lee AH, Yau KK, Wang K. Recurrent ischaemic stroke hospitalisations: a
data. BMC Med Inform Decis Mak. (2018) 18:44. doi: 10.1186/s12911-018- retrospective cohort study using Western Australia linked patient records. Eur
0620-z J Epidemiol. (2004) 19:999–1003. doi: 10.1007/s10654-004-0157-6
19. Frizzell JD, Liang L, Schulte PJ, Yancy CW, Heidenreich PA, 33. Lambert C, Chaudhary D, Olulana O, Shahjouei S, Avula V, Li J, Abedi V,
Hernandez AF, et al. Prediction of 30-day all-cause readmissions Zand R. Sex Disparity in Long-term Stroke Recurrence and Mortality in
in patients hospitalized for heart failure: comparison of machine a Rural Population in the United States. Ther Adv Neurol Disord. (2020)
learning and other statistical approaches. JAMA Cardiol. (2017) 13:1–12. doi: 10.1177/1756286420971895
2:204–9. doi: 10.1001/jamacardio.2016.3956 34. Sharma V, Sharma V, Khan A, Wassmer DJ, Schoenholtz MD, Hontecillas R,
20. Francisco A, Stabler ME, Hisey W, Mackenzie TA, Dorn C, Denton J, et al. Malnutrition, health and the role of machine learning in clinical setting.
et al. Using machine learning to predict 30-day readmission of patients Front Nutr. (2020) 7:44. doi: 10.3389/fnut.2020.00044
hospitalized with an acute myocardial infarction. Circulation. (2018) 35. Ding L, Liu C, Li Z, Wang Y. Incorporating artificial
138(Suppl. 1):A15808. intelligence into stroke care and research. Stroke. (2020) 51:e351–
21. Wolff P, Graña M, Ríos SA, Yarza MB. Machine learning readmission 4. doi: 10.1161/STROKEAHA.120.031295
risk modeling: a pediatric case study. Bio Med Res Int. (2019) 2019:1– 36. Alam M, Deng X, Philipson C, Bassaganya-Riera J, Bisset K, Carbo A, et al.
19. doi: 10.1155/2019/8532892 Sensitivity analysis of an enteric immunity simulator (ENISI)-based model
22. Kalagara S, Eltorai AE, Durand WM, DePasse JM, Daniels AH. of immune responses to helicobacter pylori infection. PLoS ONE. (2015)
Machine learning modeling for predicting hospital readmission 10:e0136139. doi: 10.1371/journal.pone.0136139
following lumbar laminectomy. J Neurosurg Spine. (2018) 37. Chen X, Wang W, Xie G, Hontecillas R, Verma M, Leber A,
30:344–52. doi: 10.3171/2018.8.SPINE1869 et al. Multi-resolution sensitivity analysis of model of immune
23. Chaudhary D, Khan A, Shahjouei S, Gupta M, Lambert C, Avula V, et al. response to helicobacter pylori infection via spatio-temporal
Trends in ischemic stroke outcomes in a rural population in the United States. metamodeling. Front Appl Math Stat. (2019) 5:4. doi: 10.3389/fams.2019.
J Neurol Sci. (2021) 422:117339. doi: 10.1016/j.jns.2021.117339 00004
24. Sadighi A, Stanciu A, Banciu M, Abedi V, El Andary N, Holland N, 38. Abedi V, Li J, Shivakumar MK, Avula V, Chaudhary DP, Shellenberger
et al. Rate and associated factors of transient ischemic attack misdiagnosis. MJ, et al. Increasing the density of laboratory measures for machine
Eneurologicalsci. (2019) 15:100193. doi: 10.1016/j.ensci.2019.100193 learning applications. J Clin Med. (2021) 10:103. doi: 10.3390/jcm100
25. Zhang Z. Multiple imputation with multivariate imputation by 10103
chained equation (MICE) package. Ann Transl Med. (2016)
4:30. doi: 10.3978/j.issn.2305-5839.2015.12.63 Conflict of Interest: The authors declare that the research was conducted in the
26. Kursa MB, Rudnicki WR. Feature selection with the boruta package. J Stat absence of any commercial or financial relationships that could be construed as a
Softw. (2010) 36:1–13. doi: 10.18637/jss.v036.i11 potential conflict of interest.
27. Lunardon N, Menardi G, Torelli N. ROSE: a package for binary imbalanced
learning. R journal. (2014) 6:79–89. doi: 10.32614/RJ-2014-008 Copyright © 2021 Darabi, Hosseinichimeh, Noto, Zand and Abedi. This is an open-
28. STATA. STATA 14. (2015). Available online at: https://www.stata.com/stata14/ access article distributed under the terms of the Creative Commons Attribution
(accessed March 19, 2021). License (CC BY). The use, distribution or reproduction in other forums is permitted,
29. R. R 3.6.0. (2019). Available online at: https://cran.r-project.org/bin/windows/ provided the original author(s) and the copyright owner(s) are credited and that the
base/old/3.6.0/ (accessed April 26, 2019). original publication in this journal is cited, in accordance with accepted academic
30. Kuhn M. Building predictive models in R using the caret package. J Stat Softw. practice. No use, distribution or reproduction is permitted which does not comply
(2008) 28:1–26. doi: 10.18637/jss.v028.i05 with these terms.
Frontiers in Neurology | www.frontiersin.org 10 March 2021 | Volume 12 | Article 638267You can also read


