Only a small population of adult Sertoli cells actively proliferates in culture
←
→
Page content transcription
If your browser does not render page correctly, please read the page content below
REPRODUCTION
    RESEARCH

Only a small population of adult Sertoli cells actively
proliferates in culture
Andrey Yu Kulibin1,* and Ekaterina A Malolina1,2,*
1
Koltzov Institute of Developmental Biology of Russian Academy of Sciences, Moscow, The Russian Federation and
2
Ivanovsky Institute of Virology, N.F. Gamaleya Research Institute of Epidemiology and Microbiology, Ministry of
Health of the Russian Federation, Moscow, The Russian Federation
Correspondence should be addressed to A Yu Kulibin; Email: kulibin.a.bkrj@gmail.com
*(A Yu Kulibin and E A Malolina contributed equally to this work)

Abstract
Adult mammalian Sertoli cells (SCs) have been considered to be quiescent terminal differentiated cells for many years, but recently,
proliferation of adult SCs was demonstrated in vitro and in vivo. We further examined mouse SC behavior in culture and found that
there are two populations of adult SCs. The first population is SCs from seminiferous tubules that hardly proliferate in vitro. The
second population is small and consists of SCs with atypical nuclear morphology from the terminal segments of seminiferous tubules,
a transitional zone (TZ). TZ SCs multiply in culture and form colonies, display mixture of mature and immature SC characteristics,
and generate cord-like structures in a collagen matrix. The specific features of TZ SCs are ACTA2 expression in vitro and DMRT1 low
levels in vivo and in vitro. Although the in vivo function of TZ SCs still remains unclear, this finding has significant implications for
our understanding of SC differentiation and functioning in adult mammals.
Reproduction (2016) 152 271–281

Introduction                                                              Early light and electron microscopic studies on testes
                                                                       of different species (Dym 1974, Osman 1978, Nykänen
It has been suggested for many years that Sertoli cells
(SCs) in mammals do not proliferate after puberty                      1979, Wrobel et al. 1986) demonstrated that the
(Cupp & Skinner 2005). However, during the last                        population of adult SCs is not homogeneous. So-called
decade, some in vivo and in vitro studies have shown                   modified SCs were found in terminal segments of
that adult SCs can resume proliferation (Tarulli                       seminiferous tubules, connecting them with rete testis.
et al. 2012). Expression of proliferating cell nuclear                 According to terminology proposed by Dym (1974),
antigen (PCNA) was demonstrated in SCs of seasonal                     this testis region was called the transitional zone (TZ),
breeding Djungarian hamsters after gonadotropin                        and the extension of rete testis connecting with it was
suppression and subsequent FSH replacement (Tarulli                    called the tubulus rectus. Later, many authors (Naito
et al. 2006) and in SCs from healthy adult men after                   et al. 2009, Aiyama et al. 2015) began to call TZ tubulus
prolonged gonadotropin suppression (Tarulli et al.                     rectus, and the former tubulus rectus was classified as
2013). Proliferation of cultured adult mouse and                       the rete testis tubule. In this study, we follow the earlier
human SCs was reported by Ahmed and colleges                           Dym’s nomenclature.
(2009). The authors showed that, as early as 3 days in                    In the TZ of seminiferous tubules, a gradual depletion
culture, 10% of murine SCs incorporated BrdU, and                      of germ cells occurs, until finally tubules are lined only
the number of BrdU-positive SCs reached 36% after                      by SCs and a few spermatogonia (Dym 1974). Then, SCs
20 days. SC proliferative activity was associated with a               form the terminal valve protruding into the tubulus rectus
decrease in the cell cycle inhibitor p27kip1 expression                lined by a simple cuboidal or columnar epithelium.
and an increase in the proliferation inducer ID2 levels.               According to the electron microscopic study (Nykänen
Reinitiation of proliferation was also demonstrated                    1979), modified SCs of TZ have a multilobed nucleus
in a primary SC culture of 20-day postpartum rats                      with the typical nucleolus, but there is more peripheral
treated with activin (Nicholls et al. 2012). Therefore,                heterochromatin than in SCs from seminiferous tubules,
it was concluded that adult SCs were not terminally                    and nuclear lobulation seems to be more pronounced.
differentiated cells, but a fine balance between cell                     Early studies showed no evidence for proliferation
cycle inducers and inhibitors exists in a postpubertal                 of modified SCs in the adult testis; however, later it
testis and prevents SCs from resuming proliferation.                   was observed that some unidentified cells of murine
© 2016 Society for Reproduction and Fertility                                                                      DOI: 10.1530/REP-16-0013
ISSN 1470–1626 (paper) 1741–7899 (online)                                                      Online version via www.reproduction-online.org
                                                                                                  Downloaded from Bioscientifica.com at 11/06/2021 09:22:47PM
                                                                                                                                                via free access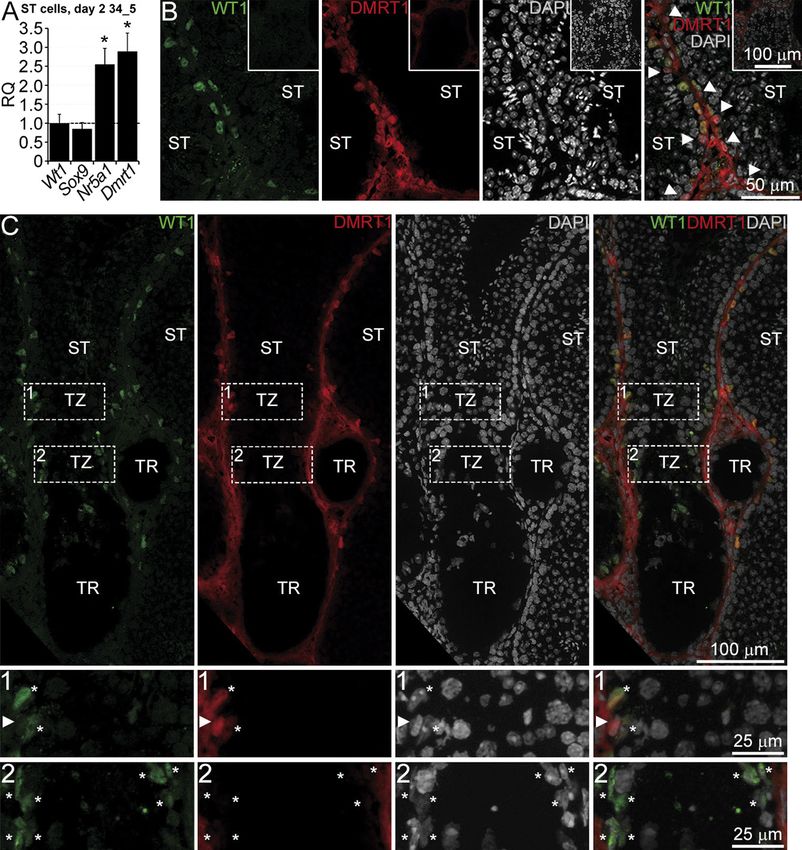
272     A Yu Kulibin and E A Malolina

TZ incorporated BrdU after experimental autoimmune                     with the National Institute of Health Guide for the Care and
orchitis induction (Naito et al. 2009). Proliferation of               Use of Laboratory Animals (NIH Publications No. 80-23)
some TZ SCs was clearly demonstrated in testes of                      revised 1996 and the UK Animals (Scientific Procedures)
adult Syrian hamsters under normal conditions (Aiyama                  Act 1986 and were approved by the Animal Care and Use
et al. 2015). Moreover, some BrdU-positive SCs at                      Committee of Koltzov Institute of Developmental Biology RAS.
3 months after BrdU injection moved into the regions of
seminiferous tubules with active spermatogenesis.                      SC isolation and culture
   Summarizing the above findings, we hypothesized
that adult SCs from seminiferous tubules (ST SCs) and                  SCs were isolated either from the whole adult mouse testis or
                                                                       separately from ST and from TZ. In the last case, a testis was cut
modified TZ SCs should behave differently in culture.
                                                                       into two parts. One part was approximately a quarter of the testis
To test our hypothesis, we cultivated cells from TZ and
                                                                       around the vascular pedicle and contained rete testis, tubuli
ST separately and demonstrated that ST SCs hardly
                                                                       recti, TZ, and fragments of seminiferous tubules; another part
proliferate in vitro, whereas TZ SCs actively multiply,                contained only seminiferous tubules. Enzymatic digestion was
form colonies, display a mixture of mature and                         performed according to Ahmed et al. (2009) with modifications
immature SC features, and generate seminiferous cord-                  described in the Supplementary Materials and methods, see
like structures after embedding into a collagen matrix.                section on supplementary data given at the end of this article.
                                                                       Cells were plated on culture dishes in alphaMEM/F12 medium
                                                                       (PanEco, Moscow, Russia) with 5% (v/v) FBS (HyClone;
Materials and methods                                                  Logan, UT, USA) at a concentration of 2.0 × 10⁵ cells/cm2
Animals                                                                (for the whole testis and ST isolation) and 1.0 × 10⁵ cells/cm2
                                                                       (for TZ isolation). The dishes were maintained either at 37°C
Adult male C57Bl/6J mice that were 8–12 weeks of age and               under standard 21% O2 atmosphere (37_21) or at 34°C under
mouse pups that were 4–6 days of age were used in the study.           lower 5% O2 culture atmosphere (34_5). After 24 h, the culture
Animals were housed under standard conditions of care. All             was washed from unattached germ cells and fresh medium
manipulations with animals were carried out in accordance              containing 1% FBS was added; the medium was then changed
                                                                       every 3 days.

                                                                       3D cell culture in a collagen matrix
                                                                       SCs isolated from TZ were harvested using a trypsin solution
                                                                       after 10 days in culture and mixed at a ratio of 3:7 (Sang et al.
                                                                       1990) with peritubular myoid cells (PMCs) obtained from the
                                                                       supernatant fraction after trypsin digestion of adult ST and
                                                                       cultivated with 10% FBS at 37°C under 21% O2 for 3 days.
                                                                       Cells were embedded into a collagen matrix according to
                                                                       Zhang et al. (2014) with some modifications described in the
                                                                       Supplementary Materials and methods and maintained in 3D
                                                                       culture at 34°C under 5% O2 culture atmosphere for 7 days.
                                                                       As a positive control, freshly isolated pup testicular cells or
                                                                       pup SCs cultured for 10 days were used, as described in the
                                                                       Supplementary Materials and methods. As a negative control,
                                                                       ST SCs were embedded into a collagen.

                                                                       Immunofluorescence and histology
                                                                       Immunofluorescence staining of testis sections, cultured
                                                                       cells, and cell aggregates in a collagen matrix was performed
                                                                       according to protocols described in the Supplementary Materials
                                                                       and methods. Samples were photographed using a Keyence
Figure 1 Adult mouse SCs isolated from the whole testis, ST, and TZ
on day 10 of culture. (A–C) Phase contrast views of SC cultures.       Table 1 The percentage of WT1+ cells in the adult mouse SC cultures
Colonies are present in the whole testis (A, arrow) and the TZ         on day 10.
(C) cultures but not in the ST culture (B). Hereinafter, unless
                                                                       Culture          The whole testis         ST                         TZ
otherwise specified, images represent the 37_21 culture.
(D–F) Anti-WT1 immunostaining of the whole testis (D), ST (E), and     37_21 (n = 5)       37.0 ± 10.1           Sporadic cells        80.8 ± 2.8a
TZ (F) cultures; arrows indicate single WT1+SCs outside the colonies   34_5 (n = 7)        45.9 ± 8.8            Sporadic cells        50.1 ± 5.8b
in (D and F). (G and H) Anti-SOX9 immunostaining of the ST (G) and     a
                                                                        P < 0.05 compared with the 37_21 whole testis culture, bP < 0.05
TZ (H) cultures. Insets in (D and G) represent negative controls       compared to the 37_21 TZ culture (Mann–Whitney U test; data
without first antibodies.                                              represent mean ± s.e.m.).

Reproduction (2016) 152 271–281                                                                                      www.reproduction-online.org

                                                                                                  Downloaded from Bioscientifica.com at 11/06/2021 09:22:47PM
                                                                                                                                                via free access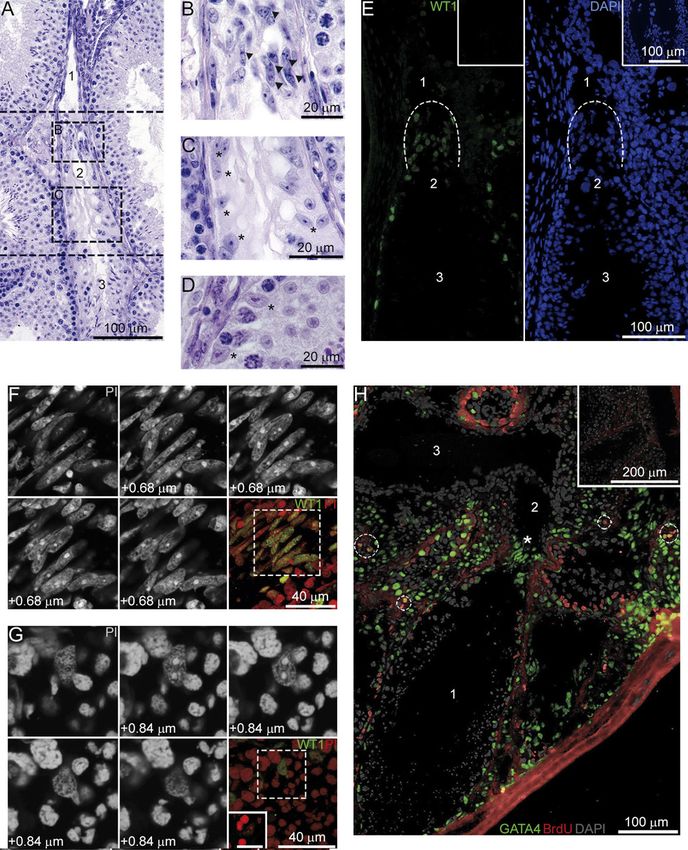
TZ SC population proliferating in vitro           273

Figure 2 Quantitative analysis of colonies and qRT-PCR assay in the TZ culture. (A) A graph of the total colony area per sm2 vs culture type.
(B, C) Histograms of the individual colony area distributions in the 37_21 (B) and 34_5 (C) cultures summed from three independent
experiments. (D) A graph of the colony number per sm2 vs culture type. Bars in (A) and (D) indicate mean ± s.e.m; *P < 0.05 (Mann–Whitney
U test, n = 3). (E, F) qRT-PCR assay for the indicated genes in the 34_5 and 37_21 TZ cultures on day 10 (E), and at passage 2 of the 37_21 TZ
culture (F). Relative quantification of RNA (RQ) was normalized with Wt1. Bars indicate mean ± s.e.m.; dotted lines represent levels of gene
expression in the TZ culture on day 2 (34_5 culture). *P < 0.05 (Mann–Whitney U test, n = 3).

(Model BZ-9000, Osaka, Japan) or an Olympus (IX51, Japan)                  fixed with modified Davidson’s fluid for 24 h and embedded in
microscopes and a confocal microscope (TCS SP5 STED; Leica                 paraffin; sections (7 µm) were stained with Caracci’s hematoxylin
Microsystems, Wetzlar, Germany). For histology, testes were                and eosin and photographed using a Keyence microscope.

www.reproduction-online.org                                                                                        Reproduction (2016) 152 271–281

                                                                                                       Downloaded from Bioscientifica.com at 11/06/2021 09:22:47PM
                                                                                                                                                     via free access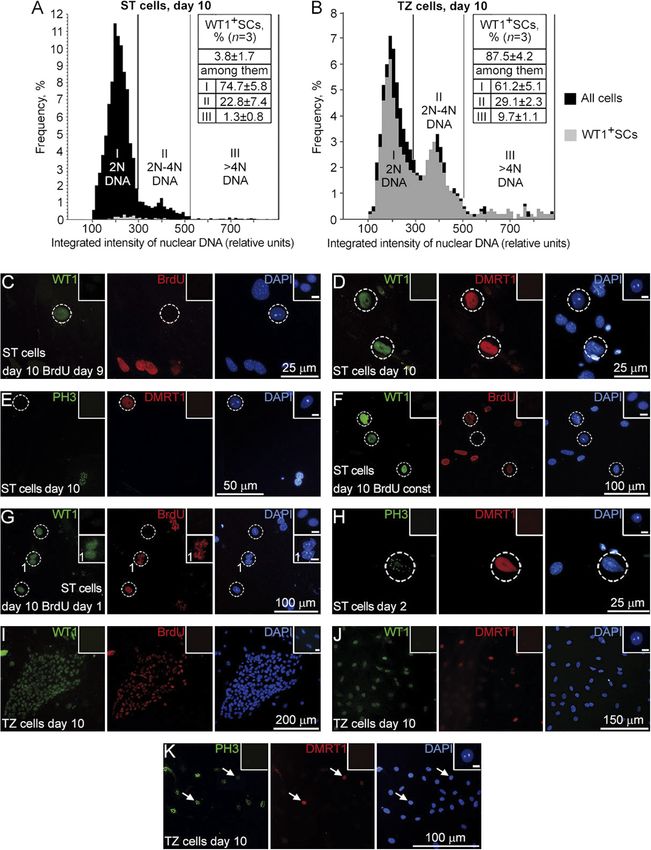
274     A Yu Kulibin and E A Malolina

BrdU labeling                                                   formation for the 37_21 TZ cultures was also performed;
                                                                the procedure is described in the Supplementary Materials
For in vivo BrdU labeling, a BrdU solution (0.1 mg/g body
                                                                and methods.
weight; Sigma) was injected intraperitoneally into five adult
male mice once per day for 5 days. Mice were killed and a
testis from each mouse was isolated and snap-frozen on day      DNA image cytometry
1 after the last BrdU injection. Three frozen sections were
                                                                Cultures of cells isolated from ST and TZ were immunostained
cut from a rete testis zone of each testis with an interval
                                                                for WT1 on day 10 of culture. Nuclear DNA was stained
of 80 µm between sections, double stained for GATA4 and
                                                                with propidium iodide (PI, Sigma). Cells were photographed
BrdU, photographed using a Keyence microscope, and
                                                                using an Olympus microscope. Then, the integrated PI
analyzed. For in vitro labeling, BrdU (3 µg/mL) was added
                                                                staining intensity was measured by automated image analysis
to the cell culture.
                                                                (CellProfiler software), and DNA content histograms were
                                                                built, as described (Carpenter et al. 2006) (Supplementary
                                                                Fig. 1). The percentage of WT1-positive cells with 2N, 2-4N
Analysis of colonies in the TZ cultures                         and >4N DNA content was calculated.
TZ cells were photographed under phase contrast using
a Keyence microscope on day 10 of culture. Image
                                                                RNA isolation and qRT-PCR
processing was performed with ImageJ (NIH) software.
The number of colonies, their total area, and the areas of      Total RNA was extracted from samples using the RNeasy
individual colonies were measured. Live imaging of colony       Mini Kit (Qiagen) and reverse-transcribed using the MMLV

                                                                                    Figure 3 Proliferation of ST and TZ SCs in
                                                                                    culture. (A and B) Representative histograms
                                                                                    of DNA content in ST (A) and TZ (B) cultures
                                                                                    built using CellProfiler. (C-K) Double
                                                                                    immunostaining of the ST (C–H) and the TZ
                                                                                    (I–K) cultures for WT1 and BrdU (C, F, G, and
                                                                                    I), for WT1 and DMRT1 (D and J), and for
                                                                                    WT1 and PH3 (E, H, and K). Stainings were
                                                                                    performed on days 10 (C–G and I–K) and 2
                                                                                    (H). BrdU was added to the cultures on day 9
                                                                                    (C and I), once per day from day 1 to day 9
                                                                                    (F), or on day 1 (G). Inset 1 represents an
                                                                                    enlarged view of SCs with punctate BrdU
                                                                                    staining (G). Dashed circles outline ST SCs.
                                                                                    Arrows point to Dmrt1+/PH3+ TZ SCs in (K).
                                                                                    Insets represent negative controls without first
                                                                                    antibodies. Scale bars in all insets: 10 μm.

Reproduction (2016) 152 271–281                                                                           www.reproduction-online.org

                                                                                       Downloaded from Bioscientifica.com at 11/06/2021 09:22:47PM
                                                                                                                                     via free access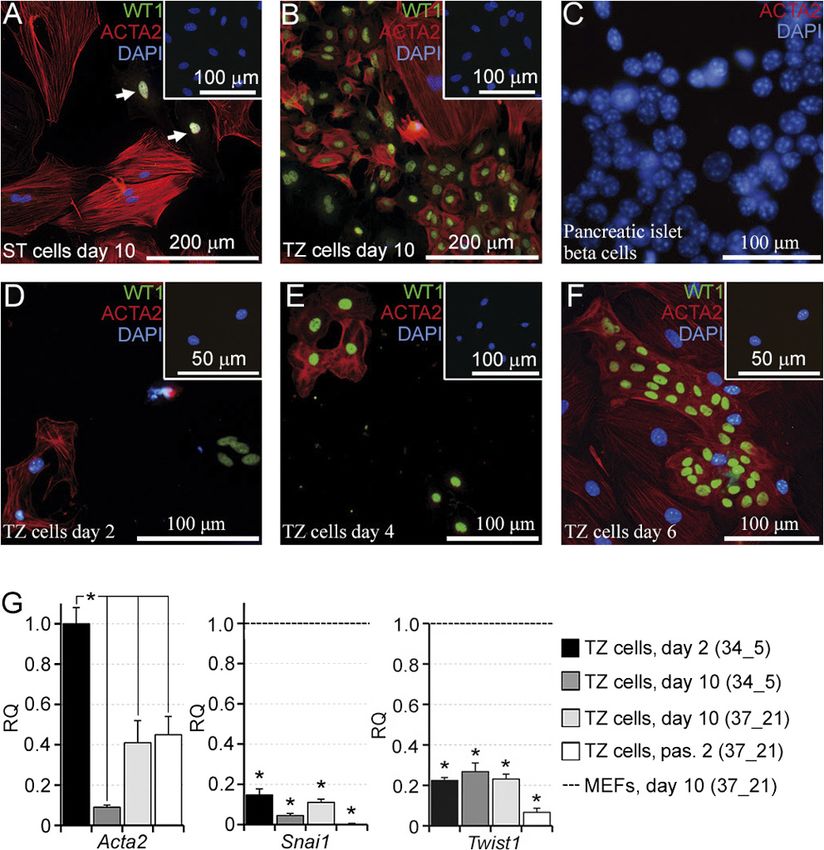
TZ SC population proliferating in vitro           275

Table 2 The percentage of WT1+ and BrdU+ cells in the adult mouse TZ and ST cultures on day 6.
Culture type                             WT1+ cells           BrdU+ cells            WT1+BrdU+ cells                 WT1+BrdU+/WT1+ cells
                  37_21 (n = 3)          47.2 ± 4.6            47.1 ± 7.3              26.8 ± 6.4                            56.0 ± 11.0
TZ
                   34_5 (n = 3)          12.0 ± 1.8a           41.8 ± 1.0               9.6 ± 2.4a                           77.5 ± 9.6
                  37_21 (n = 3)           3.8 ± 0.7a           47.0 ± 5.2                   0a                                    0a
ST                 34_5 (n = 3)           4.7 ± 0.9b           32.7 ± 3.1b                  0b                                    0b
a
 P < 0.05 compared with 37_21 TZ culture, bP < 0.05 compared with 34_21 TZ culture (Mann–Whitney U test; data represent mean ± s.e.m.).

RT kit (Evrogen, Moscow, Russia). Oligonucleotide primers                confirmed by using mouse testis sections as positive
(Supplementary Table) were ordered from Evrogen. Real-time               controls (Supplementary Fig. 2A and C).
PCR analysis was performed in triplicates using SYBR green                  We maintained SCs at two culture conditions: at
qPCRmix-HS with ROX (Evrogen) with a StepOnePlus Real-                   37°C in an atmosphere of 21% O2 and 5% CO2 (37_21,
Time PCR System (Applied Biosystems). Mean Ct values for                 standard conditions) or under lowered temperature
Wt1 (for SC-specific genes) and Hprt (for Acta2, Snai1 and               (34°C) and oxygen (5%). The last conditions (34_5) are
Twist1) were used to calculate ΔCt values for each sample.               considered to be more physiological for testes (Harrison
Wt1 is considered to be a stable SC marker and, according                & Weiner 1949, Vaupel et al. 1989). No significant
to our immunofluorescent data, it is continuously expressed
                                                                         difference between the 37_21 and 34_5 whole testis
in SCs throughout culture time. The melting curves for Wt1,
                                                                         cultures was observed in the number of WT1+ cells on
Hprt. and genes analyzed gave only a single, unique peak for
                                                                         day 10 (Table 1). By contrast, the number of WT1+ cells
each primer set. ΔΔCt values for each sample were calculated
by subtracting the mean ΔCt of the 34_5 TZ culture on day 2,
                                                                         in the 37_21 TZ culture was 1.6-fold higher than in the
except Snai1 and Twist1 for which the mean ΔCt of cultured               34_5 TZ culture, and in some cases, it reached 85%. The
mouse embryonic fibroblasts (MEF) was used. Relative                     37_21 TZ culture also demonstrated a >twofold increase
quantification of RNA (RQ) was calculated using the 2−ΔΔCt               in the total area of colonies compared with the 34_5
method (Livak & Schmittgen 2001).

Statistical analysis
All quantitative data were presented as mean ± s.e.m. (n
represents independent experiments) and analyzed using
the non-parametric Mann–Whitney U test.

Results
There are two SC populations in an adult testis:
ST, TZ SCs
We cultured SCs isolated from the whole testis and SCs
isolated separately from ST and TZ. After 10 days, cells
from all cultures formed a subconfluent monolayer,
which in the case of the whole testis isolation
consisted of large irregular-shaped cells and colonies
of smaller cells (Fig. 1A, arrow). Cells obtained from
ST formed a monolayer consisting of large polygonal
cells, and no colonies were present (Fig. 1B). By
contrast, cells from TZ formed large colonies (Fig. 1C).
All cells from all cultures were positive for vimentin
and GATA4, markers of somatic testicular cells (data                     Figure 4 ACTA2 expression in SC cultures. (A and B) Double
not shown). After staining for a SC marker WT1, it                       immunostaining of the ST (A) and TZ (B) cultures for ACTA2 and WT1
was demonstrated that cells in colonies from the                         on day 10; arrows point to WT1+/ACTA2-SCs in the ST culture. (C)
whole testis culture (Fig. 1D) and from the TZ culture                   ACTA2 staining of pancreatic β cell line TC-6 (ATCC, CRL-11506,
(Fig. 1F) were WT1+SCs. A few WT1+SCs were also                          Manassas, VA, USA) for negative control. (D–F) Double
detected outside the colonies (Fig. 1D and F, arrows).                   immunostaining of the TZ culture for ACTA2 and WT1 on day 2 (D),
                                                                         day 4 (E), and day 6 (F). Insets represent negative controls without
WT1+SCs were rarely detected in the ST culture and
                                                                         first antibodies. (G) qRT-PCR analysis for Acta2, Snai1, and Twist1 in
always lied separately (Fig. 1E). The same results were                  TZ cells. Relative quantification of RNA (RQ) was normalized with
obtained after immunostaining the ST and the TZ                          the reference gene encoding Hprt. Bars indicate mean ± s.e.m.
cultures for another SC marker SOX9 (Fig. 1G and H).                     Dotted lines indicate levels of gene expression in MEFs. *P < 0.05
The specificity of the WT1 and SOX9 antibodies was                       (Mann–Whitney U test, n = 3).

www.reproduction-online.org                                                                                       Reproduction (2016) 152 271–281

                                                                                                      Downloaded from Bioscientifica.com at 11/06/2021 09:22:47PM
                                                                                                                                                    via free access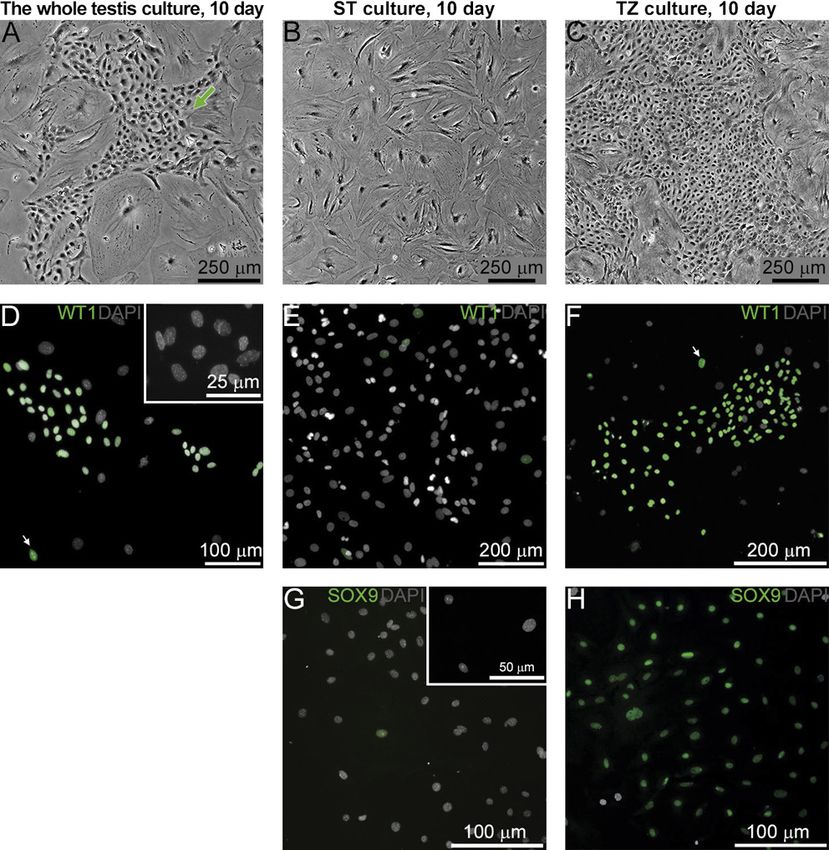
276 A Yu Kulibin and E A Malolina
culture (Fig. 2A). Size distribution histograms of colonies upregulated, whereas Amh was slightly downregulated
(Fig. 2B and C) show that colonies in the 37_21 TZ in the 34_5 culture compared with the 37_21 culture. At
culture were larger than in the 34_5 culture. However, passage 2, on day 26 of culture, when 95.1 ± 5.3% cells
the number of colonies per sm2 in the 34_5 TZ culture were WT1+SCs, Nr5a1, Dmrt1, Fshr, Amh and Gata1
was 1.5-fold higher than in the 37_21 culture (Fig. 2D). expressions decreased dramatically (Fig. 2F), whereas
To further compare two types of culture conditions, Sox9 and Trf levels were only insignificantly changed.
the expression of some SC genes was measured in the
TZ cultures on day 10 (Fig. 2E), the 34_5 TZ culture
ST SCs hardly proliferate in vitro, whereas TZ SCs
on day 2 was used as control. The TZ SCs were found proliferate actively
to express all key SC transcriptional factors (Buganim
et al. 2012): Wt1, Sox9, Nr5a1 and Dmrt1 as well as To estimate the proliferative capacity of ST and TZ SCs,
mature (Gata1 and Trf) and immature (Amh) SC markers. DNA image cytometry was performed on day 10 of
The FSH receptor (Fshr) expression was inhibited in culture. Representative histograms of DNA content
both the cultures. The Nr5a1 and Trf expressions were (Fig. 3A and B) demonstrate that 22.8 ± 7.4% of ST SCs
and 29.1 ± 2.3% of TZ SCs contained DNA in the range
between 2N and 4N. However, when BrdU was added
to the ST culture on day 9, and cells were double stained
for WT1 and BrdU after 18 h, there were not BrdU-
positive SCs (Fig. 3C). Moreover, no ST SCs, identified by
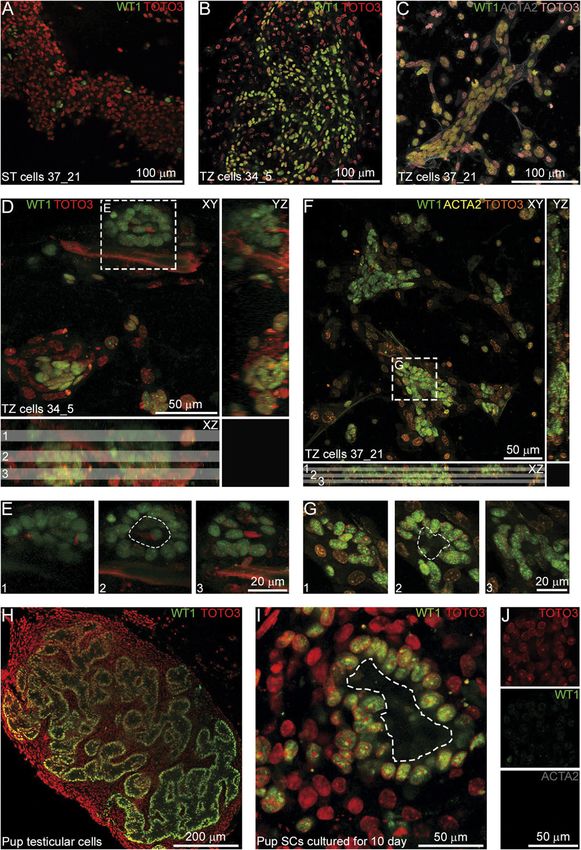
Figure 5 3D culture of SCs in a collagen matrix. (A) The 37_21 ST
culture maintained in a collagen for 1 week, no cord-like structures Figure 6 SC nuclear morphology in vitro. (A) A WT1+ ST SC with
were present. (B–I) Cord-like structures formed by TZ SCs from the typical nuclear morphology on day 3 of culture. (B) A colony
34_5 (B, D, and E) and 37_21 (C, F, and G) cultures, freshly isolated fragment of WT1+ TZ SCs with atypical nuclei on day 10 of culture.
pup testicular cells (H), and cultured pup SCs (I) that were (C) An enlarged image of an area denoted by the dash box in (B). (D)
maintained in a collagen for 1 week. Samples were immunostained WT1+/BrdU+ cells have atypical nuclei with several heterochromatin
for WT1 (A, B, D, E, H, and I) or for WT1 and ACTA2 (C, F, and G), clusters on day 2 of culture. (E) A seminiferous tubule from a
nuclei were co-stained with TOTO3. Then, confocal microscopy was 4-day-old mouse pup testis, hematoxylin and eosin staining. (F) An
performed. In (D and F), the right and bottom panels represent enlarged image of an area denoted by the dash box in (E).
orthogonal projections; optical sections (1–3) of areas denoted by Arrowheads point to a gonocyte, asterisks indicate SC nuclei. Insets
dashed boxes are shown in (E and G). Dashed lines mark borders of in (A, B, and D) represent negative controls without first antibodies, a
cavities. (J) A negative control without first antibodies. scale bar in (D): 10 μm.
Reproduction (2016) 152 271–281 www.reproduction-online.org
Downloaded from Bioscientifica.com at 11/06/2021 09:22:47PM
via free access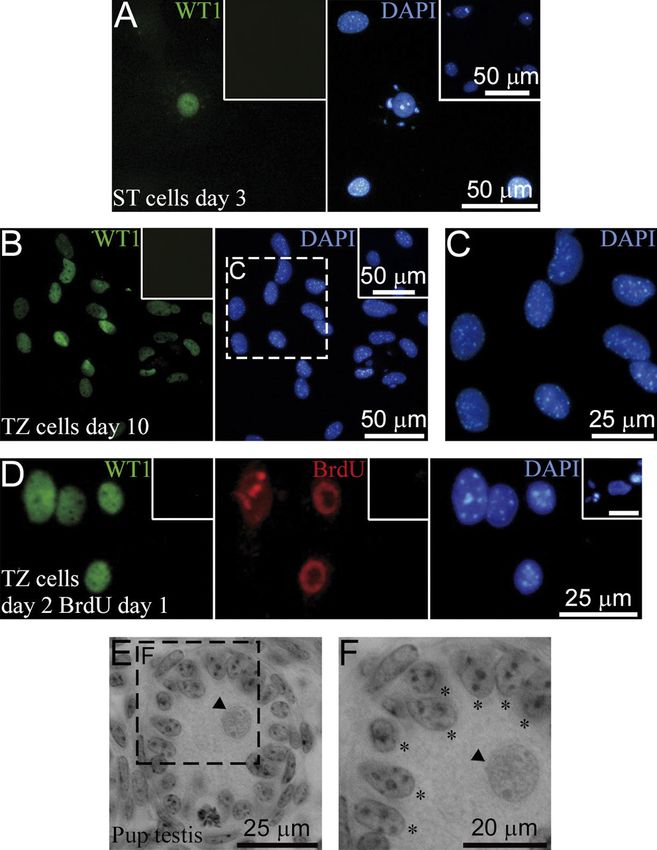
TZ SC population proliferating in vitro            277

immunostaining for another SC marker DMRT1 (Fig. 3D),        (Fig. 4B). The specificity of ACTA2 antibodies used
were positive on the phosphohistone H3-Ser10 (PH3),          was verified by staining pancreatic islet β cells that did
mitosis marker (Fig. 3E). Hence, it is likely that 2-4N ST   not express ACTA2 as a negative control (Fig. 4C) and
SCs represent cell cycle-arrested cells.                     staining a mouse testis section as a positive control
   To further investigate the ST SC cell cycle, BrdU was     (Supplementary Fig. 2B).
added to the ST culture once per day from day 1 to day          We observed that all WT1+ cells in the TZ culture
9, and immunostaining was performed on day 10. Some          were ACTA2 negative on day 2 (Fig. 4D), but on day
SCs were found to be BrdU positive (Fig. 3F), but most       4, some WT1+ cells began to express ACTA2 (Fig. 4E),
SCs did not incorporate BrdU and remained quiescent          and on day 6, most WT1+ colonies were stained for
throughout the culture period. When cells were treated       it (Fig. 4F). However, according to the PCR analysis,
with BrdU for 18 h from day 1 to day 2 of culture and        Acta2 mRNA in the TZ cultures on day 10 and after
immunostained on day 10, most of the WT1- cells had          passaging was significantly downregulated compared
punctate BrdU staining because of the label dilution         with the TZ culture on day 2 (Fig. 4G). As Acta2 is
during cell divisions after BrdU incorporation; however,     a mesenchymal marker and could be evidence of
SCs were stained solidly, and only one pair of SCs with
punctate staining was observed (Fig. 3G, 1). No WT1+/
BrdU+ cells were detected in the 34_5 and 37_21 ST
cultures when BrdU was added to the culture on days
3 and 5 and immunostainings were performed on days
4 (data not shown) and 6 (Table 2) correspondingly.
PH3+SCs were present only on days 2 and 3 (Fig. 3H).
These data gave evidence that ST SCs did not proliferate
more than once (or perhaps twice) and that DNA
synthesis took place within the narrow time interval
from day 1 to day 3 of culture. The same results were
obtained when SCs were maintained in 10% FBS, so the
serum did not affect their proliferation.
   As opposed to ST SCs, TZ SCs actively incorporated
BrdU on day 10 (Fig. 3I). Hence, 2-4N TZ SCs (Fig. 3B)
represent cells in the S-phase. To investigate the
difference between the two types of culture conditions,
a BrdU incorporation assay was performed on day 6 at
about 50% confluence. The percentage of WT1+/BrdU+
cells as well as the percentage of WT1+ cells were
significantly higher in the 37_21 culture compared with
the 34_5 culture (Table 2). However, the percentage
of BrdU+ cells among WT1+ cells was higher in the
34_5 culture, although not significantly (Table 2). It is
interesting that some cells in colonies were DMRT1
negative, and other cells expressed DMRT1 in a low
level, although all of them expressed WT1 (Fig. 3J).
Nevertheless, the presence of Dmrt1+/PH3+ cells in the
TZ colonies (Fig. 3K) clearly demonstrates that TZ SCs       Figure 7 Morphological and immunofluorescence characterization of
are able to enter mitosis, and as opposed to ST SCs, not     the TZ in the adult mouse testis. (A) TZ (2), a terminal segment of a
cell cycle arrested on day 10.                               seminiferous tubule (3), TZ is adjacent to a tubulus rectus (1),
                                                             hematoxylin and eosin staining. (B and C) Enlarged images of areas
                                                             in the TZ denoted by dash boxes in (A). (D) An enlarged image of the
TZ SCs begin to express a-smooth muscle actin                seminiferous tubule. Arrowheads point to modified SCs; asterisks
in culture                                                   mark typical SCs in (B–D). (E) Anti-WT1 immunostaining of the TZ,
                                                             dashed curves indicate the proximal end of the TZ. WT1 expression
Double immunostaining for WT1 and α-smooth muscle            is absent in the tubulus rectus (1). (F and G) Serial confocal images of
actin (ACTA2), a marker of PMCs, was performed               modified SC nuclei (F) and a typical SC nucleus (G) stained with PI.
on day 10. Most cells in the ST culture were found           The last images represent maximum projection views of these cells,
to be WT1-/ACTA2+PMCs; WT1+ SCs did not express              positively stained for WT1 (surrounded by dash boxes). (H) Double
                                                             immunostaining of the TZ for GATA4 and BrdU. 1 – seminiferous
ACTA2 (Fig. 4A, arrows). In the TZ culture, most cells
                                                             tubule, 2 – tubulus rectus, 3 – rete testis, an asterisk marks the TZ,
outside the colonies, except a few WT1+/ACTA2-SCs,           dashed circles outline GATA4+/BrdU+ cells in the testis interstitium.
were WT1-/ACTA2+PMCs (Fig. 4B). Strikingly, most             Insets in (E, G, and H) represent negative controls without first
WT1+SCs in colonies were also positive for ACTA2             antibodies; a scale bar in (G): 15 μm.

www.reproduction-online.org                                                                           Reproduction (2016) 152 271–281

                                                                                          Downloaded from Bioscientifica.com at 11/06/2021 09:22:47PM
                                                                                                                                        via free access
278 A Yu Kulibin and E A Malolina
epithelial to mesenchymal transition (EMT), Snai1 and cords that the freshly isolated pup testicular cells
Twist1, two markers of EMT, were analyzed in cultures generated (Fig. 5H). However, pup SCs cultured for
(Fig. 4G). However, the low level of their expression in 10 days behaved like TZ SCs and were able to form
the TZ cultures on days 2, 10, and after passaging was only small cord-like structures (Fig. 5I). Therefore, it
observed compared with the MEFs. is possible that other testicular cell populations (i.e.,
endothelial cells), which were present among pup cells,
were needed for efficient cord formation as it occurs
TZ SCs organize into cord-like structures in the
3D culture during embryonal testis development (Cool et al. 2012).
It could also be presumed that SCs lose some essential
It is well known that dissociated immature testicular cells characteristics during culturing, and more optimal
can reaggregate and form seminiferous tubule- or cord- culture conditions should be found.
like structures. To test whether SCs can form testicular
cords, we mixed them with an additional number of
PMCs, which contribute to cord formation as well and TZ SCs have atypical nuclear morphology in vitro and
in vivo
embedded them in a collagen matrix. The ST cultures
did not form any structures after a week (Fig. 5A). By Most ST SCs in culture, except those entering the cell
contrast, TZ SCs from the 34_5 (Fig. 5B) and the 37_21 cycle, displayed typical adult SC nuclear morphology
(Fig. 5C) cultures were organized into WT1+ cord-like with two large DAPI bright perinucleolar chromocenters
structures. They often were surrounded by ACTA2+PMCs (Fig. 6A). However, TZ SCs in colonies had atypical
(Fig. 5C). In many cases, these structures resembled nuclei with many smaller DAPI bright heterochromatin
seminiferous tubules (Fig. 5D and F, dashed boxes). clusters (Fig. 6B and C). Such cells could either originate
Serial optical sections (Fig. 5E and G) collected by using from typical SCs or be present in culture from the start.
confocal microscopy showed the presence of a cavity To determine this, we examined early time points and
inside. detected WT1+ cells with atypical nuclei as early as day
All observed SC aggregates were small and did not 1 of culture. From day 1 to day 2, these cells began to
form a network of elongated anastomotic seminiferous incorporate BrdU (Fig. 6D). Their nuclei were similar to
Figure 8 DMRT1 expression in the TZ SCs. (A)
qRT-PCR analysis for the indicated genes in
the 34_5 TZ and ST cultures on day 2.
Relative quantification of RNA (RQ) was
normalized with Wt1. A dotted line indicates
levels of gene expression in the TZ SCs. All
bars indicate mean ± s.e.m. *P < 0.05
(Mann–Whitney U test, n = 3). (B, C) Double
immunostaining of seminiferous tubules (ST)
(B) and TZ (C) for WT1 and DMRT1. TR –
tubulus rectus, asterisks indicate SCs,
arrowheads point to spermatogonia. (1, 2)
Enlarged images of areas denoted by the dash
boxes in (C). Insets in (B) represent negative
controls without first antibodies.
Reproduction (2016) 152 271–281 www.reproduction-online.org
Downloaded from Bioscientifica.com at 11/06/2021 09:22:47PM
via free accessTZ SC population proliferating in vitro 279
those of immature SCs (Fig. 6E and F, asterisks). Using previous studies where loss of the tight junction protein
live imaging of the TZ culture from day 1 to day 7, we claudin 11 (Mazaud-Guittot et al. 2010), the gap
demonstrated that cells forming WT1+ colonies had junction protein connexin-43 (Sridharan et al. 2007),
atypical nuclei from the start of the culture, and SCs and retinoblastoma protein (RB), the cell cycle regulator
exhibiting a typical morphology did not form colonies (Nalam et al. 2009), caused mouse ST SCs proliferate
(Supplementary Fig. 3). in vivo after puberty. However, the number of cycling SCs
Histological analysis of adult murine testes revealed was extremely low. A few ST SCs enter the cell cycle in
that in the distal part of the TZ (adjacent to the human testes after prolonged gonadotropin suppression
seminiferous tubules) where some germ cells still occur, (Tarulli et al. 2013). In in vitro studies, 17β-estradiol
SCs are morphologically indistinguishable from SCs of (Lucas et al. 2008) and activin A (Nicholls et al. 2012)
the seminiferous tubules (Fig. 7A, C, and D, asterisks). were found to induce active proliferation of SCs from
However, in the proximal part of the TZ, especially in 15- and 20-day-old rats respectively. However, authors
the valve-like terminal segment, some SCs have atypical isolated cells from the whole testes, so it is not obvious
nuclei with several heterochromatin clusters (Fig. 7A and ST or TZ SCs proliferate in culture. Further research is
B, arrowheads). Such modified SCs are positively stained needed to clarify the ability of such factors as activin
for WT1 (Fig. 7E). Confocal optical serial sections of their and estradiol to stimulate ST SC proliferation.
nuclei (Fig. 7F) clearly demonstrate their difference from SCs isolated from TZ, by contrast, do actively
“normal” SCs of the seminiferous tubules (Fig. 7G) and proliferate in culture and form colonies of epithelial-like
their similarity to the TZ SCs forming colonies in culture cells. Culture conditions affect their growth: the total
(Fig. 6D). However, immunofluorescence analysis of the area of colonies and, correspondingly, the percentage
testes from adult mice treated with BrdU for 5 days did of SCs (WT1+ cells) were higher in the 37_21 culture,
not detect BrdU+SCs in the TZ (Fig. 7H) as well as in the whereas in the 34_5 culture, colonies were smaller in
seminiferous tubules. size but larger in number. We suggest that under more
physiological conditions (34_5 culture), cells attach to
TZ SCs express DMRT1 at a low level the culture surface more efficiently, and therefore more
colonies are generated. However, it was previously found
To compare ST and TZ SCs, expression of some that SC growth is highly affected by cell concentration
essential SC transcription factors was measured on (Schlatt et al. 1996), so at early time points, SCs in the
day 2 of culture. Dmrt1 as well as Nr5a1 was found 34_5 culture surrounded by larger amounts of cells
to be downregulated in TZ SCs (Fig. 8A). Low DMRT1 proliferate more slowly than SCs in the 37_21 culture.
expression in the TZ culture was described above Later, the culture surface is occupied by more numerous
(Fig. 3J). Double immunostaining of testis sections PMCs, which also attached more efficiently, and SCs
for WT1 and DMRT1 confirmed those data. SCs from stop proliferating because of contact inhibition.
seminiferous tubules were positively stained for DMRT1 Immunofluorescence and qRT-PCR analysis of
(Fig. 8B) as well as spermatogonia (Fig. 8B, arrowheads). TZ SCs demonstrated that they express Gata4, Wt1,
SCs from the part of the TZ where round spermatids Sox9, Nr5a1, and Dmrt1, which could be considered
were present were DMRT1 positive too (Fig. 8C, 1, as key SC transcriptional factors because their
asterisks). By contrast, there was no detectable DMRT1 concomitant expression is necessary and sufficient
signal in the SCs from the more proximal areas of the TZ for efficient reprogramming of MEFs into Sertoli-like
(Fig. 8C, 2, asterisks). DMRT1 is essential to maintain cells (Buganim et al. 2012). The degree of TZ SC
testis determination; a complete loss of DMRT1 differentiation in culture is not obvious; it seems that
activates FOXL2, a female-specific transcription factor they have a mixed phenotype. They proliferate like
and reprograms SCs into granulosa cells (Matson et al. neonatal SCs, display immature nuclear morphology,
2011). However, we did not observe any positive signal and generate cord-like structures in the 3D culture.
in the TZ SCs when immunostaining testis sections for However, at the same time, they highly express the
FOXL2 (Supplementary Fig. 2D and E). mature SC markers Gata1 and Trf.
The interesting feature of TZ SCs is the ACTA2
expression that appears in these cells from day 4 of
Discussion
culture. In the postnatal testis, ACTA2 expression is
Our results show that most of the SCs isolated from restricted to PMCs and smooth muscle cells of the
seminiferous tubules remain quiescent in vitro. Only vascular walls, but in the embryonal development,
a few of them incorporated BrdU at early time points ACTA2 is expressed at a low level in most interstitial cells
but did not proliferate more than once or twice; some of the testis (Cool et al. 2008), which are derived from
of them are likely to be cell cycle arrested. Neither cells of the coelomic epithelium that earlier gave rise to
higher serum concentration nor changing culture SCs (Cool et al. 2012). Therefore, ACTA2 expression in
conditions (temperature and oxygen level) enhance TZ SCs could be a sign of their dedifferentiation to the
their proliferation. This finding is in accordance with early precursors.
www.reproduction-online.org Reproduction (2016) 152 271–281
Downloaded from Bioscientifica.com at 11/06/2021 09:22:47PM
via free access280 A Yu Kulibin and E A Malolina
Table 3 The main characteristics of the two SC populations in the adult mouse testis.
Characteristics ST SCs TZ SCs
Proliferation in vitro Extremely low High
Proliferation in vivo No No
Nuclear morphology Typical with two large perinucleolar Atypical with several smaller heterochromatin
chromocenters clusters
WT1, SOX9, GATA4, and vimentin expression Yes Yes
DMRT1 expression High Low
ACTA2 expression in vitro No Yes
Cord formation No Yes
Live imaging data of colony formation in the TZ infertility (Salameh & Swerdloff 2005). For example, we
culture and its immunostaining at early time points generated a mouse model of viral testicular infection
provided evidence that atypical WT1+SCs with several that mimics human orchitis and demonstrated massive
heterochromatin clusters in the nucleus were present SC death and subsequent infertility (Malolina et al.
from the very start of the culture and gave rise to the 2014). Such spermatogenic defects could be corrected
colonies. Such SCs were revealed in vivo: in the valve- with combined transplantation of SCs and germ cells
like terminal segment of TZ just at the border between (Shinohara et al. 2003, Zhang et al. 2009, Malolina
the seminiferous tubule and the tubulus rectus. They et al. 2016). Furthermore, SCs were demonstrated to
correspond to “modified” SCs described in the early support and protect nontesticular cell grafts, such as
electron microscopic studies (Dym 1974, Osman 1978, pancreatic islet cells and neurons (Mital et al. 2010).
Nykänen 1979, Wrobel et al. 1986) and proliferating A limiting factor for using SCs for cell therapy was that
SCs in Syrian hamster testes (Aiyama et al. 2015). In immature SCs suitable for transplantation can only be
this study, we did not observe any BrdU+SCs in the TZ obtained from neonatal donors. However, in this study,
in vivo. There may be a principal difference between we demonstrated that adult SCs from TZ can be an
mouse and hamster TZ SCs: hamster cells proliferate alternative source of immature SCs and hence may be
in vivo and then probably become typical SCs that applied to clinical applications in the future.
support germ cell development (Aiyama et al. 2015),
but mouse cells lost this ability, although they are still
able to proliferate in culture. It is also possible that Supplementary data
mouse TZ SCs can divide only after testis injury when This is linked to the online version of the paper at http://dx.doi.
new SCs are required. org/10.1530/REP-16-0013.
In this study, we paid special attention to one of the
key SC transcriptional factors: DMRT1. Its expression
in TZ SCs in vivo and at early time points in culture Declaration of interest
significantly decreased, according to qRT-PCR and
The authors declare that there is no conflict of interest that
immunofluorescence data. As Dmrt1 expression is
could be perceived as prejudicing the impartiality of the
increased during SC maturation (Chen & Heckert
research reported.
2001), and SCs from mice with knockout of Dmrt1
did not differentiate properly during postnatal
development and fail to cease proliferation (Raymond
Funding
et al. 2000, Fahrioglu et al. 2007), we speculate that
the ability TZ SCs to proliferate in culture and exhibit The study was supported by the grant of the Presidium RAS
other immature characteristics may be caused by Program “Fundamental research for biomedical technologies”
decreased DMRT1 levels. and the grant from the Russian Foundation for Basic Research
In conclusion, our results indicate the presence of (RFBR), research project no. 16-34-60119. The research was
two SC populations, ST and TZ SCs, in the adult testis, done using equipment of the Core Centrum of Insitute of
whose main characteristics are summarized in Table 3. It Developmental Biology RAS.
is obvious that TZ SCs are not completely differentiated.
The in vivo role of this population is not clear, but it
References
may contribute to the restoration of SC number after
testicular injury and during aging. Such SC renewal Ahmed EA, Barten-van Rijbroek AD, Kal HB, Sadri-Ardekani H, Mizrak SC,
van Pelt AM & de Rooij DG 2009 Proliferative activity in vitro and
could even occur under normal circumstances, as DNA repair indicate that adult mouse and human Sertoli cells are not
indirect data from Syrian hamster testes suggest (Aiyama terminally differentiated, quiescent cells. Biology of Reproduction 80
et al. 2015). Besides its fundamental significance, our 1084–1091. (doi:10.1095/biolreprod.108.071662)
Aiyama Y, Tsunekawa N, Kishi K, Kawasumi M, Suzuki H,
finding could be important for medical science. It Kanai-Azuma M, Kurohmaru M & Kanai Y 2015 A Niche for GFRα1-
is known that alterations in SC function and SC loss positive spermatogonia in the terminal segments of the seminiferous tubules
lead to impaired spermatogenesis and irreversible in Hamster testes. Stem Cells 33 2811–2824. (doi:10.1002/stem.v33.9)
Reproduction (2016) 152 271–281 www.reproduction-online.org
Downloaded from Bioscientifica.com at 11/06/2021 09:22:47PM
via free accessTZ SC population proliferating in vitro 281
Buganim Y, Itskovich E, Hu YC, Cheng AW, Ganz K, Sarkar S, Fu D, Nicholls PK, Stanton PG, Chen JL, Olcorn JS, Haverfield JT, Qian H,
Welstead GG, Page DC & Jaenisch R 2012 Direct reprogramming of Walton KL, Gregorevic P & Harrison CA 2012 Activin signaling regulates
fibroblasts into embryonic Sertoli-like cells by defined factors. Cell Stem Sertoli cell differentiation and function. Endocrinology 153 6065–6077.
Cell 11 373–386. (doi:10.1016/j.stem.2012.07.019) (doi:10.1210/en.2012-1821)
Carpenter AE, Jones TR, Lamprecht MR, Clarke C, Kang IH, Friman O, Nykänen M 1979 Fine structure of the transitional zone of the rat
Guertin DA, Chang JH, Lindquist RA, Moffat J et al. 2006 CellProfiler: seminiferous tubule. Cell and Tissue Research 198 441–454.
image analysis software for identifying and quantifying cell phenotypes. (doi:10.1007/BF00234189)
Genome Biology 7 R100. (doi:10.1186/gb-2006-7-10-r100) Osman DI 1978 On the ultrastructure of modified Sertoli cells in the
Chen JK & Heckert LL 2001 Dmrt1 expression is regulated by follicle- terminal segment of seminiferous tubules in the boar. Journal of Anatomy
stimulating hormone and phorbol esters in postnatal Sertoli cells. 127 603–613.
Endocrinology 142 1167–1178. (doi: 10.1210/en.142.3.1167) Raymond CS, Murphy MW, O’Sullivan MG, Bardwell VJ & Zarkower D
Cool J, Carmona FD, Szucsik JC & Capel B 2008 Peritubular myoid cells 2000 Dmrt1, a gene related to worm and fly sexual regulators, is
are not the migrating population required for testis cord formation in the required for mammalian testis differentiation. Genes and Development
XY gonad. Sexual Development 2 128–133. (doi:10.1159/000143430) 14 2587–2595. (doi:10.1101/gad.834100)
Cool J, DeFalco T & Capel B 2012 Testis formation in the fetal mouse: Salameh WA & Swerdloff RS 2005 Conditions affecting Sertoli cells.
dynamic and complex de novo tubulogenesis. Wiley Interdisciplinary In Sertoli Cell Biology, edn 1, pp 383–413. Eds MK Skinner & MD
Reviews: Developmental Biology 1 847–859. (doi:10.1002/wdev.v1.6) Griswold. San Diego and London: Elsevier Academic Press.
Cupp AS & Skinner MK 2005 Embryonic Sertoli cell differentiation. Sang QX, Dym M & Byers SW 1990 Secreted metalloproteinases
In Sertoli Cell Biology, edn 1, pp 43–70. Eds MK Skinner & MD Griswold. in testicular cell culture. Biology of Reproduction 43 946–955.
San Diego and London: Elsevier Academic Press. (doi:10.1095/biolreprod43.6.946)
Dym M 1974 The fine structure of monkey Sertoli cells in the transitional Schlatt S, de Kretser DM & Loveland KL 1996 Discriminative analysis of
zone at the junction of the seminiferous tubules with the tubuli recti. rat Sertoli and peritubular cells and their proliferation in vitro: evidence
American Journal of Anatomy 140 1–25. (doi:10.1002/(ISSN)1553-0795) for follicle-stimulating hormone-mediated contact inhibition of Sertoli
Fahrioglu U, Murphy MW, Zarkower D & Bardwell VJ 2007 mRNA cell mitosis. Biology of Reproduction 55 227–235. (doi:10.1095/
expression analysis and the molecular basis of neonatal testis biolreprod55.2.227)
defects in Dmrt1 mutant mice. Sexual Development 1 42–58. Shinohara T, Orwig KE, Avarbock MR & Brinster RL 2003 Restoration of
(doi:10.1159/000096238) spermatogenesis in infertile mice by Sertoli cell transplantation. Biology
Harrison RG & Weiner JS 1949 Vascular patterns of the mammalian testis of Reproduction 68 1064–1071. (doi:10.1095/biolreprod.102.009977)
and their functional significance. Journal of Experimental Biology 26 Sridharan S, Simon L, Meling DD, Cyr DG, Gutstein DE, Fishman GI,
304–316. Guillou F & Cooke PS 2007 Proliferation of adult sertoli cells following
Livak KJ & Schmittgen TD 2001 Analysis of relative gene expression data conditional knockout of the Gap junctional protein GJA1 (connexin
using real-time quantitative PCR and the 2(-Delta Delta C(T)) method. 43) in mice. Biology of Reproduction 76 804–812. (doi:10.1095/
Methods 4 402–408. (doi:10.1006/meth.2001.1262) biolreprod.106.059212)
Lucas TF, Siu ER, Esteves CA, Monteiro HP, Oliveira CA, Porto CS Tarulli GA, Stanton PG, Lerchl A & Meachem SJ 2006 Adult sertoli cells are
& Lazari MF 2008 17beta-estradiol induces the translocation not terminally differentiated in the Djungarian hamster: effect of FSH on
of the estrogen receptors ESR1 and ESR2 to the cell membrane, proliferation and junction protein organization. Biology of Reproduction
MAPK3/1 phosphorylation and proliferation of cultured immature 74 798–806. (doi:10.1095/biolreprod.105.050450)
rat Sertoli cells. Biology of Reproduction 78 101–114. (doi:10.1095/ Tarulli GA, Stanton PG & Meachem SJ 2012 Is the adult Sertoli cell
biolreprod.107.063909) terminally differentiated? Biology of Reproduction 87 1–11. (doi:10.1095/
Malolina EA, Kulibin AYu, Naumenko VA, Gushchina EA, Zavalishina LE biolreprod.112.101691)
& Kushch AA 2014 Herpes simplex virus inoculation in murine rete Tarulli GA, Stanton PG, Loveland KL, Rajpert-De Meyts E, McLachlan RI
testis results in irreversible testicular damage. International Journal & Meachem SJ 2013 A survey of Sertoli cell differentiation in men after
of Experimental Pathology 95 120–130. (doi:10.1111/iep.2014.95. gonadotropin suppression and in testicular cancer. Spermatogenesis
issue-2) 3 e24014. (doi: 10.4161/spmg.24014)
Malolina EA, Kulibin AY & Kushch AA 2016 Neonatal testicular cell Vaupel P, Kallinowski F & Okunieff P 1989 Blood flow, oxygen and nutrient
transplantation restores murine spermatogenesis damaged in the course supply, and metabolic microenvironment of human tumors: a review.
of herpes simplex virus-induced orchitis. Reproduction, Fertility and Cancer Research 49 6449–6465.
Development 28 757–764. (doi:10.1071/RD14255) Wrobel KH, Schilling E & Zwack M 1986 Postnatal development of the
Matson CK, Murphy MW, Sarver AL, Griswold MD, Bardwell VJ & connexion between tubulus seminiferous and tubulus rectus in the
Zarkower D 2011 DMRT1 prevents female reprogramming in the bovine testis. Cell and Tissue Research 246 387–400. (doi:10.1007/
postnatal mammalian testis. Nature 476 101–104. (doi:10.1038/ BF00215902)
nature10239) Zhang Z, Shao S, Shetty G & Meistrich ML 2009 Donor Sertoli cells
Mazaud-Guittot S, Meugnier E, Pesenti S, Wu X, Vidal H, Gow A & transplanted into irradiated rat testes stimulate partial recovery
Le Magueresse-Battistoni B 2010 Claudin 11 deficiency in mice results of endogenous spermatogenesis. Reproduction 137 497–508.
in loss of the Sertoli cell epithelial phenotype in the testis. Biology of (doi:10.1530/REP-08-0120)
Reproduction 82 202–213. (doi:10.1095/biolreprod.109.078907) Zhang J, Hatakeyama J, Eto K & Abe S 2014 Reconstruction of a
Mital P, Kaur G & Dufour JM 2010 Immunoprotective sertoli cells: making seminiferous tubule-like structure in a 3 dimensional culture system of
allogeneic and xenogeneic transplantation feasible. Reproduction 139 re-aggregated mouse neonatal testicular cells within a collagen matrix.
495–504. (doi:10.1530/REP-09-0384) General and Comparative Endocrinology 205 121–132. (doi:10.1016/j.
Naito M, Terayama H, Hirai S, Qu N, Kawata S & Itoh M 2009 Histopathology ygcen.2014.03.030)
of the tubuli recti at the start of experimental autoimmune orchitis in
mice. Medical Molecular Morphology 42 230–235. (doi:10.1007/
s00795-009-0469-4) Received 10 January 2016
Nalam RL, Andreu-Vieyra C, Braun RE, Akiyama H & Matzuk MM 2009
First decision 12 February 2016
Retinoblastoma protein plays multiple essential roles in the terminal
differentiation of Sertoli cells. Molecular Endocrinology 23 1900–1913. Revised manuscript received 5 June 2016
(doi:10.1210/me.2009-0184) Accepted 4 July 2016
www.reproduction-online.org Reproduction (2016) 152 271–281
Downloaded from Bioscientifica.com at 11/06/2021 09:22:47PM
via free accessYou can also read