Obtaining and Characterization of Biodiesel from Castor Oil (Ricinus communis) and Sunflower (Helianthus annuus) Grown in Tabasco, Mexico
←
→
Page content transcription
If your browser does not render page correctly, please read the page content below
International Journal of Applied Science and Technology Vol. 2 No. 9; November 2012
Obtaining and Characterization of Biodiesel from Castor Oil (Ricinus communis)
and Sunflower (Helianthus annuus) Grown in Tabasco, Mexico
María Juana García Marín
División Academic of Engineering and Architecture. Juarez Autonomous University of Tabasco.
Cunduacán-road Km 1 Jalpa de Méndez, Tabasco, Mexico.
Francisco Prieto García
Yolanda Marmolejo Santillán
Área Academic Chemistry. University of the State of Hidalgo. Pachuca-Tulancingo
Road Km 4.5, Pachuca, Hidalgo, Mexico.
Abstract
The use of biodiesel represents a much lower environmental impact caused by the petroleum diesel. It offers a
high lubricity to engines extending its useful life, non-toxic and readily biodegradable. In the present work were
two transesterification reactions to compare and select the best result, the first from castor oil (Ricinus
communis) and the second with sunflower oil (Helianthus annuus), with sodium hydroxide catalyst and as a basis
for carrying out the reaction, methanol. According to the results showed that the best in quality is the sunflower
oil, but in performance of biodiesel obtained is castor oil. Both products were characterized by instrumental
techniques confirming its quality. In conclusion, we considered it better to use castor oil for its ease of production
and is not used in the State of Tabasco.
Keywords: Transesterification reactions, Helianthus annuus, Ricinus communis, biodegradable, methanol.
1.0 Introduction
The use of biodiesel represents a much lower environmental impact caused by the petroleum diesel as it is a
technology that fits within the guidelines for reducing greenhouse gases (GHG) and applied as Clean
Development Mechanisms (CDM) 1-3. It offers a high lubrication for extended life engines, non-toxic and
readily biodegradable 4-6.
Biodiesel is derived from the transesterification reaction, this process consisting in combining an oil (typically
vegetable oil) with a light alcohol and glycerol byproduct is obtained that can be used by various industries
including cosmetics industry 7 .
Although the transesterification reaction of triglycerides is relatively simple, have not been fully identified
conditions in which the use of methanol or ethanol are more suitable vegetable oil used. The aim of this work was
to identify the optimal concentrations of reagents, which will provide higher yields in the production of biodiesel
compared to the products of the transesterification reaction, using sunflower oil (Helianthus annuus), one of the
best studied plant 8 and compare these results with castor oil (Ricinus communis), the latter was selected
because in the state of Tabasco, is not used or is given a specific application and is also easy to produce. Likewise
perform the characterization of both products obtained in order to confirm the quality thereof.
2.0 Materials and methods
2.1 Stages of obtaining Biodiesel
It took castor oil and sunflower commercially. For obtaining biodiesel used a volume of 200 ml of base oil, which
was poured into a 500 ml Erlenmeyer flask, was introduced a magnetic stirrer, the flask was placed with the oil
and stirrer in a heating grid Cimarec mark with stirring, and SP131325 SP131015 model, a temperature of 110°C
and stirring at 1000 rpm to remove particulates from water that may be oil, this was for 5 min.
58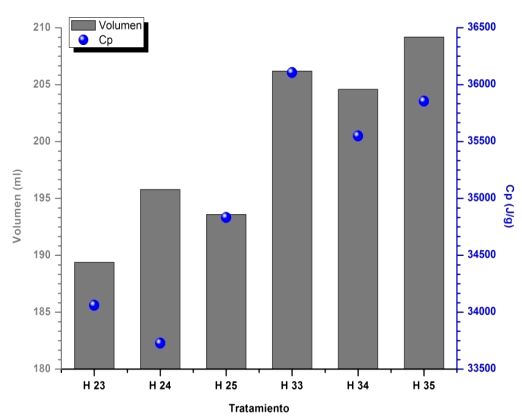
© Centre for Promoting Ideas, USA www.ijastnet.com
After preheating the oil conducted for the elimination of humidity, the temperature stabilized at 50°C to carry out
the transesterification reaction and to avoid higher temperatures which allows the methanol evaporate. With
stirring was sought to have the uniform temperature, all this is performed at atmospheric pressure.
After preheating the oil base, methoxide was prepared by adding NaOH reagent grade methanol, according to the
values given in Table 1. Once hydroxide dissolved in methanol, poured oil methoxide, maintaining constant
temperature of 50°C and atmospheric pressure with agitation was continued at 1000 rpm for 45 min. To try to
prevent alcohol loss by evaporation tape was placed on parafilm mouth of the flask during the transesterification
process. The reaction time is directly proportional to it, however this also may suffer variations depending on the
base oil used, as well as the catalyst 9. During the first minutes of the reaction, with good agitation, the
formation of methyl esters is abundant, after 90 min of reaction progress is almost zero 10, 11. The stirring time
to carry out the transesterification during the experiment was 45 min at 1 000 rpm.
Table 1. Experimental treatments
Factors
Treatments
Oil (200 ml) Methanol (% volumen) NaOH (% w)
0.3% H 13
levels
10% 0.4% H14
0.5% H 15
0.3% H 23
levels
levels
Higuerilla 20% 0.4% H 24
0.5% H 25
0.3% H 33
levels
30% 0.4% H 34
0.5% H 35
0.3% G 13
levels
10% 0.4% G 14
0.5% G 15
0.3% G 23
levels
levels
Girasol 20% 0.4% G 24
0.5% G 25
0.3% G 33
levels
30% 0.4% G 34
0.5% G 35
Once the reaction mixture was poured into a separatory funnel of 500 ml, the mixture was allowed to stand 24 h at
room temperature, after this time was able to appreciate the two phases formed (biodiesel, glycerol), subsequently
separated biodiesel and glycerol.
2.2 Purification of biodiesel
After performing phase separation, purification was performed by washing the biodiesel by adding 30% volume
of distilled water based on the total volume of biodiesel obtained by each treatment, immediately the mixture was
stirred using a water-biodiesel mixer with blades long speed of 1000 rpm for 10 min in glass vessel. 24 hours was
allowed to stand in a separating funnel and was observed after this time phases of biodiesel and water.
59International Journal of Applied Science and Technology Vol. 2 No. 9; November 2012
We proceeded to decant for separating biodiesel, three washes were performed for each experimental unit,
following the same procedure and confirming that in the last wash water separated out as clearly as possible,
which indicated the removal of waste sample NaOH 12.
2.3 Drying and storage
To remove any water that may have remained in the washing treatment during the biodiesel was poured into a
beaker of 250 ml with a magnetic stirrer and subjected to heating at 110°C and stirring between 150 and 200 rpm
during 5 min. Later the measurement of the volume of pure biodiesel obtained by using a 250 ml graduated
cylinder, then the storage of the effected tests cap glass bottles with a capacity of 355 ml.
2.4 Experimental design
We used a factorial experimental design 13 asymmetric. Independent variables were established (Table 1):
• Oil (two levels: castor and sunflower)
• Methanol (three levels: 10%, 20% and 30% volume)
• NaOH (three levels: 0.1%, 0.2% and 0.3% by weight)
And as dependent variables
• Volume
• pH
• Bulk Density
• Kinematic Viscosity
• Heat Capacity
• Infrared Spectroscopy
We determined the number of treatments derived from that there were three factors, of which one of them had two
levels and the other with three levels each, we obtained the following equation:
L = 21 * 32 = 18 (Eq. 1)
In total there were 18 experimental runs or treatments, each treatment had five replicates. By using the statistical
program SAS 9.1.3 were introduced biodiesel volume data obtained in each of the experimental units and so the
best treatments were obtained from the level statistically achieved.
2.5 Physicochemical characterization
Oils (castor, sunflower) used as raw materials, were subjected to several characterization tests, because the labels
of the containers containing them, did not provide significant information. To perform characterizations to oils,
eliminated any residue that may contain water, by heating with stirring at 110°C for 10 min. These tests were also
conducted to commercial diesel, aiming to know their characteristics and reference values have 14.
After having carried out obtaining biodiesel samples, having measured the volume of the biodiesel obtained in
each of the treatments and treatments have selected which during the transesterification reaction is achieved a
higher production of biodiesel, are following characterizations carried out:
a) Determination of pH
For biodiesel pH value before the first washing and final washing at the end of a pH meter was used brand Hanna
Instruments, Model HI 9813-6, with a resolution and accuracy of 0.1 (20°C) ± 0.2. The pH meter was calibrated
previously according to manufacturer's recommendations. Once calibrated pH meter was poured 50 ml of
biodiesel sample was introduced electrode, and measurements were performed for 5 min until the readings
stabilized.
b) Determination of Kinematic Viscosity
The kinematic viscosity was measured by capillary viscometer Cannon Instrument brand, model 2B, determining
the time required for a given volume of the biodiesel sample flow through the capillary. The viscometer used was
Ubbelohde type and by using Equation 2 is obtained from the kinematic viscosity value:
60© Centre for Promoting Ideas, USA www.ijastnet.com
= (Eq. 2)
where:
η = Viscosity (cSt)
K = capillary viscometer constant supplied by the manufacturer (cSt / s)
t = time in the fluid flowing through the capillary (s)
The capillary viscometer constant (K) was provided by the manufacturer (0.52 cSt/s) as calibration certificate.
The calibration was carried out using water as sample at a temperature of 40°C and under ASTM D445 15. It
should be mentioned that biodiesel is classified as transparent liquid.
To maintain a constant temperature during the determination is used a constant temperature bath mark Cannon
Instrument, model CT-500 and a recirculating, constant temperature controller Polyscience brand, model 9712.
The capillary viscometer was washed with soap and water, washed once with dry acetone for removing any grease
or contaminant.
Completely dry the capillary viscometer, are supplied to 15 ml of biodiesel sample to be analyzed is introduced
into the viscometer constant temperature bath and was left for 20 min before the test, to have a uniform
temperature in the test; for temperature control, a digital thermometer was placed outside. Kinematic viscosity
analyzes were performed at 40°C as prescribed in the ASTM D445 standards 15 and EN ISO 310416. Was
performed by connecting the circulator constant temperature bath and thereby to have more control of the
temperature, the recirculator contained a volume mixture of 60% water and 40% volume ethylene glycol. With the
help of a plastic knob sucked fluid in the viscometer (taking due care to avoid the formation of bubbles) to the
crest of the sample exceeded the capacity of the upper mark located in the viscometer using a timer after
measured the time it took the sample flow from the higher capacity to the mark with lower capillary viscometer.
Once the elapsed time data, Equation 2 was applied.
c) Determination of Heat Capacity
For the heat capacity of each sample was used oxygen bomb calorimeter Shanghai Changji Geological mark
Instruments, model XRY-1B, coupled with microcomputer. ASTM D240 15 explains the procedure for
determining the heat capacity of liquid oils and transparent. The equipment was calibrated using benzoic acid pill
(provided by your computer manufacturer) with predetermined weight. For analysis of the data is entered
biodiesel weight of the sample. For operation of the equipment used 18 Kg of distilled water, supplied through an
opening located in the upper right of the equipment, this water has the function of trying to keep the temperature
constant within the tub where it was the analysis, in this vat there is a stainless steel container which is introduced
into the bomb calorimeter with the sample inside the holder.
Few drops were placed in the sample holder of biodiesel in the sample and its mass was obtained using an
analytical balance, in the bomb calorimeter was placed 9 cm of copper-nickel wire, properly positioned without
touching the walls of the sample holder , then placed 10 ml of distilled water with a 20 ml pipette. Then we
proceeded to the bomb calorimeter closed, filled with oxygen through two gauges, a connector towards the tank of
oxygen (99% purity), the other towards the pump 2.5 MPa is supplied to the pump pressure, then held a
hydrostatic test to verify that there was no leak in the pump.
When container is in the tub the calorimeter and into which was placed the bomb calorimeter, were added 6 kg of
distilled water and placed the bomb in it, this bowl with the bomb was placed inside the calorimeter tub, the pump
is connected by electrodes which are held in the sample ignition. Close the lid of the calorimeter, which include
an indicator had thermocouple for reading temperatures, since the variation of temperature was mainly in
performing this analysis also had a small motor with propeller blades and to homogenize temperature of the water
inside container. Measuring the team had three stages: initial period (temperature stabilization), initial test
(combustion of the sample) and final period. You enter the data of the sample mass and the computer is
programmed to perform the analysis, the team has two methods for adjusting the temperature variations, the
method Regnault and the method Regnault-Pfaundler, in this case Regnault method used. The computer
automatically performs the analysis and at the end, in the control panel displays the final result in units of J/g.
61International Journal of Applied Science and Technology Vol. 2 No. 9; November 2012
d) Determination of density
For the determination of density of the samples was used brand team Anton Paar, model DMA 4500M with
screen touchscreen control and programming, has different functions for measuring °Brix, °API, acid
concentrations sulfuric, density, relative density, among others, the computer performs the analysis of the density
at which the operator wishes temperature in a range of 0°C to 90°C. The equipment was used to measure the
density at a temperature of 15°C as determined by the EN ISO 3675 and ASTM D1298 15-16, although the
latter does not provide a value range to establish the quality of biodiesel in based on this property. The equipment
was calibrated previously with distilled water at 25°C.
Before loading the sample, the U-tube cleaned with isopropyl alcohol and air was supplied for 15 min to remove
any residual liquid. The computer is programmed by setting the density measurement and the measurement
temperature (15°C) for approximately 30 min was allowed to stabilize at the set temperature equipment. After the
set temperature, the sample was introduced in the borosilicate glass tube in the form of U (sample holder) by
syringe, the sample holder was slightly within the densimeter oscillating at a certain frequency. The frequency
changes depend on the density of the sample, due to these changes in oscillation and a mathematical conversion is
possible to measure the density. This is calculated from the ratio between the period of the oscillations of the U-
glass tube that is located inside the equipment and the reference oscillator. During delivery of the sample to the U-
tube, be careful not to introduce bubbles. Because the sample was at room temperature than the temperature set on
the computer, you have to let the temperature stabilize what happened in a span of 5-8 min, then the team marked
the density calculation, the result was shown after about 40 seconds, the results are expressed in the density and
specific gravity and temperature of the sample when the measurement was performed.
e) Infrared Spectroscopy Study
FTIR spectroscopy analysis gave the possibility to characterize simple treatments from their vibrational spectrum
thus be able to meet the functional groups that should contain the treatments. This characterization was performed
at room temperature and confirming that the sample was completely dried as this could interfere with the results.
FTIR spectrophotometry was carried out in KBr. We used a Perkin-Elmer FT-IR Spectrum GX system, all FTIR
spectra were obtained in the range from 4000 to 370 cm-1.
f) Determination of Elemental Analysis
With this determination composition is known in quantitative terms, the presence of carbon, hydrogen and
nitrogen that will help us determine the variations that are according to the variables involved in Table 1.
Determinacionbes ESTs were performed on an elemental analyzer, Perkin Elmer, Model 2400 Series CHN/SO
g) Analysis ultraviolet-visible UV-Vis
UV-vis spectroscopy was performed using a Perkin Elmer spectrophotometer model Lambda 40, using dilutions
1:100 (v/v) in n-hexane. All data were collected in the range of 220-300 nm.
3.0 Results and discussion
3.1 Characterization of the raw material
Castor oil mainly consists ricinoleic acid (80-85%, 12-hydroxy-cis-octadec-9-enoic acid, Figure 1), linoleic acid
(3-6%), oleic acid (2-4%) and unsaturated acids (1-5%). Due to its chemical composition, has certain particular
physical and chemical properties that are exploited in various processes in the chemical industry, for example in
the manufacture of paints, coatings, lubricants, cosmetics and resins 17-19.
1
12
Figure 1. Ricinoleic acid structure
62© Centre for Promoting Ideas, USA www.ijastnet.com
Sunflower oil consists mainly linoleic acid (63-67% cis, cis, cis-9,12,15-octadecatrienoic Figure 2), oleic acid
(20-24%), palmitic acid (5-8% ) and stearic acid (3-5%). It is observed that despite being both 18 carbon atoms in
the linoleic acid is present three unsaturations.
Figure 2. Linoleic acid structure
Table 2 shows the main results of characterization of the raw materials used. As can be seen, the variation was
between these oils was only 0.1 pH unit, which is not significant, slightly acidic obtaining values very close to
what Forero and colleagues have reported 20 when indicate that in one well refined sunflower oil is obtained a
pH of 6.3. The values of kinematic viscosities of the oils at 1 atm pressure were very different, note that the value
obtained from castor oil is 7 times higher than that obtained for sunflower oil, which is explained by three
unsaturations present in its composition majority of linoleic acid and oxygen unless ricinoleic acid from castor oil,
for the same reasons that explain this lower density.
The results of the heat capacities of the oil showed that the oil was a higher heat capacity of sunflower oil 3 624 /
g greater than the castor oil Cp. The absolute density values obtained from the analysis of the oils at 15 ° C, had a
difference of 0.041 g/cm3. Arancibi and Calero and 21 Guerrero et al 22 reported a value 0.960 g/cm3 for the
density of castor oil at 25°C, and 0.919 g/cm3 for the density of sunflower oil the same temperature, which
corresponds to the one found in this work.
Table 2. Physical chemical characterization of the oils used as raw material
Characteristic Castor Oil Sunflower Oil
pH 6.00 6.10
Kinetic viscosity at 40°C (mm2/s) 115.58 16.17
Heat capacity (J/g) 34509 38133
Heat capacity (J/g) 0.963 0.921
3.2 Physicochemical characterization of Biodiesel
Of all the experimental units made only one repetition was selected from each treatment, they were selected based
on the highest volume of biodiesel obtained after washing made for disposal of NaOH that may have been left
after carrying the transesterification. Table 3 shows the average values of each volume of the treatments of
biodiesel produced from castor oil, were obtained through the SAS statistical program 9.1.3.
One can observe that the values obtained in the treatment volume H33, H34 and H35 no significant difference
was found (R2 = 0.7755, α = ≤ 0.05, Tukey) as well as between treatments H23, H24 and H25, however between
both treatment groups for significant differences. The transesterification reaction does not successfully completed
with 10% by volume of methanol (H13, H14 and H15 in Table 1), with castor oil and only one point of
saponification attained because the amount of alcohol supplied was not sufficient for will carry out the reaction.
Unlike treatments with sunflower oil (G13, G14 and G15 in Table 1), in this case all experimental units were
obtained satisfactorily.
According to what reported in Table 3 and the analysis of variance, significant treatment differences sample G33
(R2 = 0.9077, α = ≤ 0.05, Tukey) compared to other treatments (G34 and G35) obtained from oil sunflower. The
volume percentage of biodiesel obtained (yield) than the total volume of the reaction mixture prior to each of the
samples was:
• Coming from castor oil: Minimum: 86.1% High 91.0%.
• Coming from sunflower oil: Minimum: 77.8% Maximum: 89.6%.
63International Journal of Applied Science and Technology Vol. 2 No. 9; November 2012
With regard to the above, Benjumea et al 23 in their study of biodiesel production from crude palm oil using
NaOH or KOH as catalysts and methanol, mentioned that after making an analysis of the performance of the
procurement process , including washing and drying of the biodiesel obtained an average value of 86.6%. The
value found in this study is in line with those reported by these authors.
The best evidence of all treatments in general with respect to volume, treatments were H33, H34 and H35 (89-
91% yield), without significant differences between them (R 2 = 0.9165, α = ≤ 0.05, Tukey). Regarding H34 and
G33 treatments including no significant differences, however slightly significant differences regarding treatments
appointed in the first instance. H34 and G33 treatments have significant (R 2 = 0.9165, α = ≤ 0.05, Tukey) to all
other treatments performed.
Table 3. Volumes of biodiesel obtained from the different treatments derived from castor oils and sunflower.
Castor oils
Sample Vol (ml) Performance (%)
a
H 23 189.4 86.1
a
H 24 195.8 89.0
H 25 193.6a 88.0
H 33 206.2b 89.7
H 34 204.6b 89.0
H 35 209.2b 91.0
Sunflower
Sample Vol (ml) Performance (%)
G 13 172.6a 82.2
G 14 165.6a 78.9
G 15 188.2a 89.6
G 23 192.8b 87.6
G 24 188.6b 85.7
G 25 171.2b 77.8
G 33 194.2c 88.8
G 34 187.8b 81.7
b
G35 185.7 80.7
Different letters in columns indicate significant differences
3.3 Determination of pH
The pH values of the samples of biodiesel obtained from castor oil showed the lowest value that was obtained was
6.0 in H33 treatment, while the highest value obtained H23 and H35 treatments, this value being 6.5.
Within treatments sunflower oil obtained the lowest value was 6.0, which was obtained in four different
treatments (G13, G33, G34 and G25) and the highest value was 6.3 in G14 and G24 treatments. Having the above
results, we can notice that the pH values of biodiesel samples from the two types of oils are very similar and differ
from the pH of the starting raw materials.
64© Centre for Promoting Ideas, USA www.ijastnet.com
Within this analysis also determined the pH of commercial diesel and was taking as reference, the value obtained
was 6.02, this indicated that pH values of biodiesel obtained are close to the pH of commercial diesel. In analyzes
conducted with cooking oils (corn and canola), using methanol and sulfuric acid, was obtained having a pH of
7.19 and 7.03 respectively for each oil 24. However it should be noted that according Kac 25, biodiesel pH
should be neutral (pH 7), or vary between 6 and 8.
3.4 Kinematic Viscosity Determination
According to ASTM D445 15, viscosity at 40 ° C of a biodiesel, should be between 1.9 and 6.0 mm2/s, however,
according to the European standard EN ISO 3104 16to 40 ° C must be between 3.5 and 5 mm2/s. As seen in
Figure 3, and also according to EN ISO 3104 16, none of the evidence obtained from castor oil, are within the
range, are above the set maximum value, however with respect to the standard ASTM D445 15 only 4 samples
fall within the range (H25, H33, H34 and H35) and 2 of them (H23 and H24) are off, indicating that the obtained
oil biodiesel castor is slightly more viscous in combination with 20% by volume of methanol unlike the samples
which were used 30%.
Figure 3. Values of kinematic viscosities at 40 ° C, samples of biodiesel obtained from castor oil. - - - - - - - Max
ASTM D445; ______ Maximum of European standard EN ISO 3104
Values shown in Figure 4 note that unlike castor obtained treatments, samples obtained from sunflower oil are
less viscous. Therefore according to EN ISO 3104 four treatments (G25, G33, G34 and G35) sunflower oil
obtained are below the minimum limit. All others are within the range of this rule. However, all samples meet the
range set by ASTM D445.
Figure 4. Values of kinematic viscosities at 40 ° C, samples of biodiesel obtained from sunflower oil.
- - - - - - Maximum of European standard EN ISO 3104
65International Journal of Applied Science and Technology Vol. 2 No. 9; November 2012
The viscosity obtained from the analysis to commercial diesel sample temperature of 40°C, was of 2,802 mm 2/s,
based on the provisions of PEMEX in the MSDS for diesel, in Section IV, physicochemical properties 26, the
value of commercial diesel viscosity at 40°C should be between 1.9 and 4.1 mm2/s, according to this, the data
obtained was within the diesel range, however in this case none of the samples obtained biodiesel from castor oil
resembles this value, only those obtained from sunflower oil.
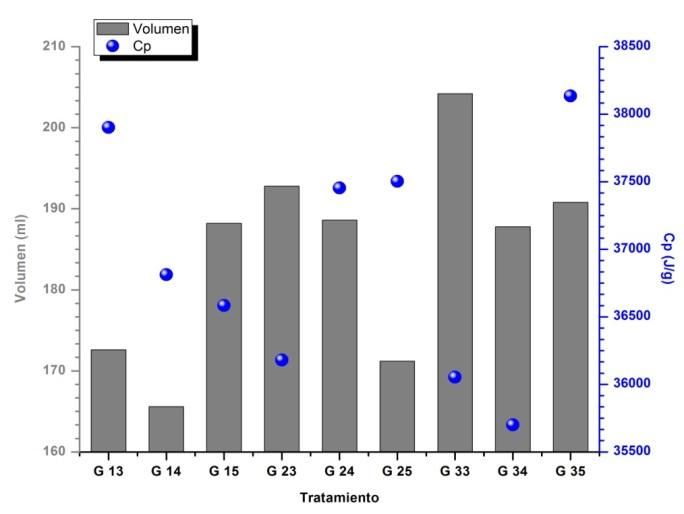
3.5 Determination of heat capacity (Cp)
The calorific value of commercial diesel is about 43 330 J/g 27, the values obtained in this study are within the
range. In Figure 5 a) A comparison of the values of Cp with respect to the volume in each treatment carried out
with castor oil, according to Figure 5 b) the best of these treatments based on their Cp was H33 (36 107 J/g), with
error bars show standard deviation so. Regarding the value of Cp obtained from commercial diesel these
treatments have a 15 to 17% less.
1
2
3
4
5
6
7
8
9
10
11
12
13
14
15
16
17
18
19
20 Treatement
Figure 5. a) Heat capacities of biodiesel obtained from castor oil obtained compared to the volume of the same
66© Centre for Promoting Ideas, USA www.ijastnet.com
1
2
3
4
5
6
7
8
9
10
11
12
13
14
15
16
17
18 Treatments
19 Figure 5. b) Heat capacities with error bars and standard deviation.
20
In Figure 6 a), to carefully analyze the values can be seen that in treatment decreases the value of Cp under
increased concentration of NaOH. However according to the error bars with standard deviation (Figure 6 b) was
the best treatment G35 (38136 J/g). It should be mentioned that although the G13 treatment is within the best in
the question of Cp, in Figure 6 a) may be observed that the volume obtained in this treatment is the third lowest.
The heat capacities of biodiesel from sunflower oil, with respect to the Cp value obtained from commercial diesel
have a 15 to 16% less. According to the literature on the production of biodiesel from crude palm oil 23, referral
Cp value was 40 192 J/g, however, in another analysis 27, shows a value of 38 020 J/g for biodiesel obtained. It
should be mentioned that previous studies were carried out using an oxygen bomb calorimeter.
1 Treatments
2
3 Figure 6. a) Heat capacities of the samples of biodiesel from sunflower oil compared with the same volume
obtained
67International Journal of Applied Science and Technology Vol. 2 No. 9; November 2012
1
2
3
4
5
6
7
8
9
10
11
12
13
14
15
16 Treatments
17 Figure 6. b) Capacidades caloríficas con barras de error y desviación estándar.
18 3.6 Bulk Density Determination
According to the European standard EN ISO 12185, the value of the density at 15°C should be between 0.86 and
0.90 g/cm3, however, ASTM D1298 15 does not indicate a parameter for measuring this property . According to
Figure 7, the densities of the samples obtained from castor oil, are outside the range of European standard,
however between these values are very similar, with only ranging from 0.901 g/cm3 to 0.908 g/cm3, this study was
performed at the temperature specified by the standard (15°C). According to the values shown in Figure 8, all
samples obtained from sunflower oil are within the range of the standard mentioned.
1
2 Treatment
3 Figure 7. Density of the samples of biodiesel from castor oil
68© Centre for Promoting Ideas, USA www.ijastnet.com 1 Treatment 2 Figure 8. Density of the samples of biodiesel from sunflower oil. 3 4 While NaOH concentration increased in all treatments, the density was decreased slightly. This is indicative of the effect of NaOH used as catalyst directly influences the density to obtain biodiesel. Density analysis performed by commercial diesel yielded a value of 0.834 g/cm3 at 15°C, in accordance with the provisions of PEMEX 26, the value of the density at 15°C should be
International Journal of Applied Science and Technology Vol. 2 No. 9; November 2012
Table 5. Analysis results percentage (% m/m) of elements C, H and N in the biodiesel obtained by treatment
Samples weight Carbon Hidrogen Nitrogen
G13 3.288 77.17 12.69 0.09
G14 2.890 77.35 12.46 0.14
G15 3.983 77.35 12.69 0.04
G23 4.467 77.55 12.84 0.06
G24 2.846 76.59 12.67 0.07
G25 3.710 75.07 12.08 0.07
G32 3.695 77.37 12.73 0.11
G34 4.480 77.11 12.72 0.06
G35 2.379 76.57 12.08 0.15
Average Sunflower 3.526 76.90 12.55 0.09
H23 4.071 73.51 12.48 0.04
H24 3.729 73.41 12.50 0.03
H25 1.817 73.17 12.16 0.17
H33 3.488 73.40 12.40 0.07
H34 3.045 73.97 12.50 0.08
H35 4.650 73.96 12.56 0.08
Average Castor oil 3.467 73.57 12.43 0.08
Unlike biodiesel from castor oil, the contents in C were lower (73.57%), in terms of the contents of H (12.43%)
and N (0.08%), no significant differences were observed with respect to biodiesel sunflower oil. These results are
similar to those reported by Tirado et 31 and that found in the biodiesel from the pinion (Jatropha curcas L.),
77.06% C, 11.57% H and 0.05% N.
3.8 Study of Infrared Spectroscopy (FTIR)
Performing infrared spectroscopy study of the castor and sunflower oils were identified some of the functional
groups that form such oils. In Figures 9 and 10 shows the FTIR spectra of the biodiesel obtained from sunflower
oil and castor respectively. The bands, a, d and e, in 3008, 1243 and 725 cm-1, corresponding to vibrations of
elongation and roll out of plane deformation of the functional group -C=C- in the cis position, respectively. The
band b, 1745 cm-1, corresponding to a stretching vibration of -C=O group of the ester group. The d band at 1438
cm-1, corresponding deformation vibration of -O-CH3 group of methyl ester. The band f at 1178 cm-1 corresponds
to a stretching vibration -CO- group of methyl ester.
70© Centre for Promoting Ideas, USA www.ijastnet.com
g
e
a d
c
f
b
Figure 9. FTIR spectrum of biodiesel obtained from sunflower oil
The band c, in 1569 cm-1, corresponding to a stretching vibration of CO2- group, carboxylic acid salt 32-33. As
shown all bands are present in the products obtained starting from both biodiesel oils (sunflower and castor), ie in
the FTIR spectra in both figures 9 and 10. However it should be noted that the band g appears at 3450 g cm -1,
being more intense in Figure 10 (castor oil biodiesel) in Figure 9. This indicates that due to the presence of the
two -OH groups of the ricinoleic acid (free one at position 12 in Figure 1 and another carboxylic acid group), the
majority in this product, with respect to a single -OH group belonging to linoleic acid amide majority in sunflower
oil.
e
g a
c d
f
b
Figure 10. FTIR spectrum of biodiesel obtained from castor oil
71International Journal of Applied Science and Technology Vol. 2 No. 9; November 2012
Particularly the band at 3008 cm-1 showed transmittance rates that ranged from 36-54% depending on the
concentrations of methanol (10, 20 and 30% v/v) and the most intense band of the ester group (1745 cm -1)
presented transmittance between 5-9% for biodiesel from sunflower oil and slightly higher (6-10%) in the castor
oil biodiesel.
3.9 UV-Vis Studio
UV-Vis spectroscopy has corroborated the presence of conjugated double bonds (polyene) present in the
respective FAME biodiesel obtained. In Figures 11 and 12 show the corresponding spectra of each of the obtained
samples.
It is appreciated that the signals 260, 254 and 248 nm are the same in the two products without significant
variations correspond to transitions and - * between 250-260 nm of the double bonds and n-transitions of the
presence * of the carboxylic acids. The most significant variation between both products is shown in Figure 13
where two signals are noted at 228 and 224 nm which can be explained by transitions - * of carboxylic acids
and unsaturated 34.
4.50
4.0
224.76
228.06
3.5
3.0 248.31
254.43
2.5
260.82
A
2.0
1.5
1.0
0.5
0.05
220.0 225 230 235 240 245 250 255 260 265 270 275 280 285 290 295 300.0
NM
Figure 11. UV-Vis spectra of the samples of biodiesel obtained from castor oil
72© Centre for Promoting Ideas, USA www.ijastnet.com
4.07
3.5
3.0
2.5
248.32
2.0 254.43
A
260.82
1.5
1.0
0.5
0.04
220.0 230 240 250 260 270 280 290 300.0
NM
Figure 12. UV-Vis spectrum of biodiesel samples obtained from sunflower oil
4.0 Conclusions
Biodiesel obtained from the transesterification reaction of the oil, both of Ricinus communis, Helianthus annuus
as grown in Tabasco, Mexico, presents yields between 78-91%. As characterizations results observed in the best
quality is biodiesel oil obtained from Helianthus annuus, however achieved in performance, biodiesel oil Ricinus
communis is higher (86.1% - 91.0% yield) . Both products characterized by instrumental techniques confirm their
high quality. It was felt that it is better to use oil Ricinus communis for easy production and is not used or
marketed in the State of Tabasco.
5.0 References
Kyoto Protocol. (1997). Kyoto Protocol to the United Nations Frameworks convention on Climate Change.
Kyoto, December 1997.
ADEME. (2000). Changement Climatique: Un défi majeur.
Amado, E.; Villamizar, A.; Gafaro, A. (2005). Evaluación del proceso de producción de biodiesel a partir de
grasas amarillas con altos contenidos de ácidos grasos. Bistua: Revista de la Facultad de Ciencias Básicas,
Vol.3(1), p.54-60.
Tickell, J., Tickell, K. (2005). From Fryer to the Fuel Tank, The complete Guide to Using Vegetable Oil as an
Alternative Fuel (3a. ed.) New Orleans, Lousiana. Roman K.
Aguilar, J.L. Biodiesel, ejemplo notable de combustible alternativo.
http://www.energiaadebate.com.mx/Articulos/febrero_2006/jorge_luis_aguilar.htm. Consultado en
Diciembre, 2010
Balat M, Balat H. (2008). A critical review of bio-diesel as a vehicular fuel Energy Convers Manage 49, 2727-
2741.
Torres, F. Diseño, Construcción y Pruebas de un Prototipo para la Producción de Biodiesel a Partir de Aceites
Provenientes de Recursos Renovables. Tesis de Maestría en Ciencias. Centro Nacional de Investigación y
Desarrollo Tecnológico. Cuernavaca, México. (2008).
Al-Zuhair S. (2005). Production of biodiesel by lipasecatalyzed transesterification of vegetable oils: A kinetics
study. Biotechnol Progress 21, 1442-1448.
Hanna, M.A. (1999). Biodiesel production: a review. Bioresource Technology.
73International Journal of Applied Science and Technology Vol. 2 No. 9; November 2012
Darnoko, D., Cheryan, M. (2000). Kinetics of palm oil transesterification in a batch reactor, Journal of the
American Oil Chemists Society.
Benavides, A.; Benjumea, P.; Pashova, V. (2007). El biodiesel de aceite de higuerilla como combustible
alternativo para motores diesel. Dyna, Año 74, No. 153, p 141-150
Cardona, S. M.; González, R.; Franco, A.; Cardeño, F.; Ríos, L. (2010). Obtención de monoglicéridos de aceite de
ricino empleando glicerina refinada y cruda. Estudio de las principales variables del proceso. Vitae.
Vol.17, n.2, p. 128-134.
Diaz, A. (20009). Diseño estadístico de experimentos. Colombia. Editorial Universidad de Antioquia.
Limachi, I.; Farfan, O.; Sterner, O.; Giménez, A. (2009). Preliminary studies about the chemical characterization
of fatty acids from Bertholletia excelsa fruit's oil by gas chromatography. BIOFARBO, Vol.17, no.1,
p.47-53. ISSN 1813-5363.
ASTM (American Society for Testing Materials). (2008).
http://www.astm.org/DATABASE.CART/HISTORICAL/D6751-08.htm. Consultado en Enero, 2012.
CEN. European Committee for Standardization. (2002).
Ogunniyi, D. (2006). Castor oil: A vital industrial raw material. Bioresource Technology, 97, pp. 1086-1091.
Meneghetti, S., Meneghetti, M., Wolf, C., Silva, E., Lima, G. (2006). Ethanolysis of castor and cottonseed oil: A
systematic study using classical catalysts. J. Am. Oil Chem. Soc., 83, pp. 819-822.
Hincapié, G.; Moreno, A.; López, D. (2011). Transesterificación de aceite de higuerilla crudo utilizando
catalizadores heterogéneos - estudio preliminar. Dyna, año 78, Nro. 169, pp. 176-181.
Forero, M. C.; Gnecco, M. J.; Torres, M. A. (2003). Producción de biodiesel de Moriche (Mauritia flexuosa)
como alternativa energética para las regiones apartadas de la Orinoquia Colombiana. Orinoquia Vol.7(1-
2);59-69.
Arancibi, Y. A., Calero, T.A. (2011), Obtención de biodiesel a partir del aceite de semillas oleaginosas de la
provincia de Chimborazo. Tesis de Licenciatura. Escuela Superior Politécnica de Chimborazo. Riobamba, Ecuador.
Guerrero, C. A.; Osorio, I. D.; Sierra, F. E. (2010). Evaluación del efecto de la temperatura en la producción de
biodiesel con aceite de higuerilla. Ingeniería e Iinvestigación Vol. 30 No. 2, p.52-61.
Benjumea, P.; Benavides, A.; Pashova, V. (2004) Estudio experimental de las variables que afectan la reacción de
transesterificación del aceite crudo de palma para la producción de Biodiesel. Scientia Et Technica. Vol.
X. núm. 24, Mayo 2004. Universidad Tecnológica de Pereira, Colombia.
Velasco, M. A., Arriaga, L. E., Niño, A., Sampiere, A., Pérez, A. (n d). Obtención de biodiesel a partir de aceite
quemado de cocina por el método ácido.base.
http://www.buap.mx/potal_pprd/work/sites/red_ambiental/resources/pdfcontent/26/obtencióndebiodiesela
partirdeaceitequemadodecocinaporelmetodoacido.pdf.consultado en Diciembre, 2011.
Kac, A. Método ácido-base para producir biodiesel. Conversión de ácidos grasos libres en ésteres. Journey to
forever. Biocombustibles y desarrollo sostenible. http://es.journeytoforever.org/biocombustibles/biodiesel-
proceso-acido-base.cgi. Consultado en Enero, 2011.
PEMEX (Petróleos Mexicanos). Hoja de Datos de Seguridad de Sustancias. (2008).
Antelo, et al. (2007). Biodiesel: Barriers, potentials and impacts. Sistemas de Energía y Medio Ambiente,
University of Strathclyde, Glasgow. Inglaterra.
Pasqualino, J.C.; Meneses, M.; Abella, M.; Castells, F. (2009). LCA as a Decision Support Tool for the
Environmental Improvement of the Operation of a Municipal Wastewater Treatment
Plant. Environmental Science & Technology, 43 (9), 3300-3307 . ISSN: 0013-936X
Delgado, A. E.; Aperador, W.; Silva, J. R. (2011). Influencia del porcentaje de mezcla del aceite de higuerilla en
la obtención de combustible alternativo para motores diesel. Rev. Fac. Ing. Univ. Antioquia, n.58, pp. 46-52.
Quezada, J. C. (2007). Evaluación de la energía de combustión y otros parámetros físico-químicos del biodiesel
obtenido a partir de cinco aceites vegetales. Tesis de grado. Universidad Zamorano, Honduras.
Tirado, J. A.; Trejo, F.; Sotelo, R. (2010). Conversión del aceite de piñón a biodiesel. V Simposio de Tecnología
Avanzada 24 - 29 de junio de 2010. CICATA-IPN. MEXICO D. F, ISBN: 978-607-414-180-1.
Socrates G. 1997. Infrared Characteristic Group Frequencies (Tables and Charts), John Wiley & Sons, 2nd Ed.
(England).
Lambert J. B., Shurvell H. F., Lightner D. A., Cooks R. G. 2001. Organic Structural Spectroscopy, Prentice Hall
(USA).
Lu, H.; Liu, Y.; Zhou, H.; Yang, Y.; Chen, M.; Liang, B. (2009). Production of biodiesel from Jatropha curcas L.
oil. Computers & Chemical Engineering, 33 (5), 1091-1096.
74You can also read