Van der Waals driven anharmonic melting of the 3D charge density wave in VSe2 - PUBDB
←
→
Page content transcription
If your browser does not render page correctly, please read the page content below
ARTICLE
                  https://doi.org/10.1038/s41467-020-20829-2                  OPEN

                  van der Waals driven anharmonic melting
                  of the 3D charge density wave in VSe2
                  Josu Diego1, A. H. Said2, S. K. Mahatha3, Raffaello Bianco1, Lorenzo Monacelli4,5, Matteo Calandra5,6,7,
                  Francesco Mauri 4,5, K. Rossnagel 3,8, Ion Errea 1,9,10 ✉ & S. Blanco-Canosa 10,11 ✉
1234567890():,;

                  Understanding of charge-density wave (CDW) phases is a main challenge in condensed
                  matter due to their presence in high-Tc superconductors or transition metal dichalcogenides
                  (TMDs). Among TMDs, the origin of the CDW in VSe2 remains highly debated. Here, by
                  means of inelastic x-ray scattering and first-principles calculations, we show that the CDW
                  transition is driven by the collapse at 110 K of an acoustic mode at qCDW = (2.25 0 0.7) r.l.u.
                  The softening starts below 225 K and expands over a wide region of the Brillouin zone,
                  identifying the electron-phonon interaction as the driving force of the CDW. This is supported
                  by our calculations that determine a large momentum-dependence of the electron-phonon
                  matrix-elements that peak at the CDW wave vector. Our first-principles anharmonic calcu-
                  lations reproduce the temperature dependence of the soft mode and the TCDW onset only
                  when considering the out-of-plane van der Waals interactions, which reveal crucial for the
                  melting of the CDW phase.

                  1 Centro de Física de Materiales (CSIC-UPV/EHU), 20018 San Sebastián, Spain. 2 Advanced Photon Source, Argonne National Laboratory, Lemont, IL 60439,

                  USA. 3 Ruprecht Haensel Laboratory, Deutsches Elektronen-Synchrotron DESY, 22607 Hamburg, Germany. 4 Dipartimento di Fisica, Università di Roma La
                  Sapienza, Roma, Italy. 5 Graphene Labs, Fondazione Instituto Italiano di Tecnologia, Genoa, Italy. 6 Dipartimento di Fisica, Università di Trento, Via Sommarive
                  14, 38123 Povo, Italy. 7 Sorbonne Universités, CNRS, Institut des Nanosciences de Paris, UMR7588, F-75252 Paris, France. 8 Institut für Experimentelle und
                  Angewandte Physik, Christian-Albrechts-Universität zu Kiel, 24098 Kiel, Germany. 9 Fisika Aplikatua 1 Saila, Gipuzkoako Ingeniaritza Eskola, University of the
                  Basque Country (UPV/EHU), San Sebastián, Spain. 10 Donostia International Physics Center (DIPC), 20018 San Sebastián, Spain. 11 IKERBASQUE, Basque
                  Foundation for Science, 48013 Bilbao, Spain. ✉email: ion.errea@ehu.eus; sblanco@dipc.org

                  NATURE COMMUNICATIONS | (2021)12:598 | https://doi.org/10.1038/s41467-020-20829-2 | www.nature.com/naturecommunications                                       1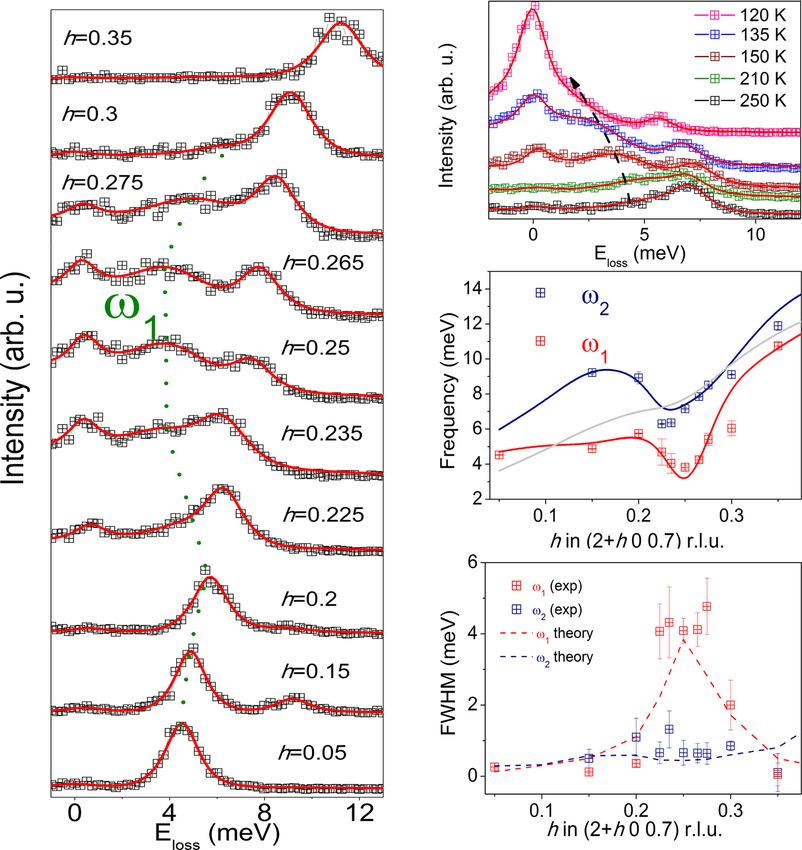
ARTICLE NATURE COMMUNICATIONS | https://doi.org/10.1038/s41467-020-20829-2
T
he study of electronic ordering and charge-density-wave Results
(CDW) formation is attracting massive efforts in con- Quasi-elastic central peak. Figure 1b displays the temperature
densed matter physics1. In particular, its dynamical nature dependence of the elastic signal at the critical wave vector
is the focus of a strong debate in correlated oxides and high-Tc qCDW = (2.25 0 0.7) r.l.u upon cooling from 300 K. The elastic
superconducting cuprates2, where fluctuations of the charge order line due to incoherent scattering is barely visible at high tem-
parameter3, dispersive CDW excitations4, and phonon anoma- perature and is temperature independent down to 150 K,
lies5 are observed. Microscopically, the subtle balance between implying low structural disorder. Below 150 K (Supplementary
electron–phonon interaction (EPI) and nested portions of the Fig. 4), a smooth increase of the quasi-elastic intensity is observed
Fermi surface (singularities in the electronic dielectric function, at q = qCDW due to low-energy critical fluctuations and displays a
χq, at qCDW = 2kF) determines the origin and stabilization of the sharp onset at the CDW transition T ≈ 110 K. No indications of
charge periodicities6. While the Fermi surface nesting scenario charge instabilities were observed along the Γ → M and Γ → L
survives for 1D and quasi-1D systems (Peierls transition), its role directions. The mean-field critical exponent obtained in the dis-
in higher dimensions remains largely questioned7,8. ordered phase at T > TCDW, γ = 1.303 ± 0.004, is consistent with
Among the solids showing electronic charge ordering, layered the existence of a 3D regime of critical fluctuations of an order
transition metal dichalcogenides (TMDs) represent the first crys- parameter of dimensions n = 2, as expected for a classical XY
talline structures where 3D CDWs were discovered9. 1T-VSe2 (space universality class29. A similar critical exponent has been observed
group P3m1) belongs to the series of layered TMDs that develops a in the quasi-1D conductor blue bronze K0.3MoO330 and ZrTe331,
3D-CDW as a function of temperature, TCDW = 110 K. However, which develops a giant Kohn anomaly at the CDW transition.
unlike the isostructural 1T-TiSe2, which adopts a commensurate 2 ×
2 × 2 CDW ordering with qCDW = (0.5 0 0.5) r.l.u10, 1T-VSe2
develops a more complex temperature dependence 3D incommen- Experimental and theoretical phonons. Figure 1c displays the
surate pattern in its CDW phase with a qCDW = (0.25 0 −0.3) r.l.u momentum dependence of the inelastic spectra at (2 + h 0 0.7) r.l.u.
CDW wave vector11, modulating the interlayer distances. 1T-VSe2 is for 0.15 < h < 0.45 at 300 K. Optical phonons appear above 17 meV
rather unique among the 1T-polytypes because it develops anoma- and do not overlap with the acoustic branches. At all momentum
lies in its transport properties and magnetic susceptibility12 that transfers, 0 < h < 0.5, the spectrum consists of 2 phonons, labeled as
more closely resemble those of 2H-polytypes (TCDW[2H-NbSe2] = ω1 and ω2 in Fig. 1d, in good agreement with the results of the
33 K, TCDW[2H-TaSe2] = 122 K) and presents the lowest onset theoretical calculations (see Supplementary Fig. 5 for a precise
temperature among them, i.e., TCDW[1T-TiSe2] = 200 K, TCDW[1T- description and assignment of the 2 branches). The third acoustic
TaS2] = 550 K11. The sizable difference between TCDW[1T-VSe2] mode is silent in IXS as its polarization vector is perpendicular to
and its 1T counterparts can be attributed to the occurrence of large the wave vector. Both ω1 and ω2 belong to the same irreducible
fluctuation effects that lower the mean-field transition temperature13 representation and, thus, do not cross. For h < 0.2, ω1 develops
or to the out-of-plane coupling14 between neighboring VSe2 layers more spectral weight than ω2 and, for h > 0.2, the intensity of ω2
assisted by the weak short-range van der Waals interactions15. increases and ω1 leads an apparent asymmetric broadening of ω2, as
Moreover, the theoretical input based on ab initio calculations is also depicted in Fig. 1d. To obtain quantitative information of the fre-
limited for all these TMDs undergoing CDW transitions due to the quency and the phonon lifetime, the experimental scans were fitted
breakdown of the standard harmonic approximation for phonons, using standard damped harmonic oscillator functions convoluted
which cannot explain the stability of the high-temperature undis- with the experimental resolution of ≈1.5 meV (see Fig. 1d and
torted phases16. This hinders the study of both the origin and the Supplementary Fig. 6 for a detailed analysis of the fitting). The
melting of the electronically modulated state, complicating the frequencies of the low-energy acoustic branches ω1 and ω2 start
comprehensive understanding of the CDW formation. around 4 and 8 meV, respectively, and end at ≈13 meV. Remark-
From the electronic point of view, angle-resolved photoemission ably, the results of our ab initio anharmonic phonon calculations
(ARPES) experiments in VSe2 reported asymmetric dogbone elec- with the stochastic self-consistent harmonic approximation
tron pockets centered at M(L)17 that follow the threefold symmetry (SSCHA)32–34, which are performed with forces calculated within
of the Brillouin zone (BZ) interior, with nesting vectors closely density-funcitonal theory (DFT) and including van der Waals
matching those observed by x-ray scattering18. The formation of the interactions, show that both ω1 and ω2 do not follow a sinusoidal
CDW results from the 3D warping of the Fermi surface in the ML dispersion, but develop a dip at h ≈ 0.25 r.l.u. The theoretical dis-
plane (Fig. 1a shows the high-symmetry points of the Brillouin zone persion nicely matches the experimental data from the zone center
of the hexagonal lattice of VSe2). Moreover, photoemission data to the border of the Brillouin zone (BZ), as shown in Fig. 1e. In fact,
also find a partial suppression of the density of states near EF on the the results of the harmonic phonon calculations indicate that the
nested portion below 180 K, indicating that a pseudogap opens at high-temperature structure of 1T-VSe2 is unstable towards a CDW
the Fermi surface19. However, a detailed investigation of the elec- transition. It is clear, thus, that anharmonicity stabilizes 1T-VSe2 at
tronic structure is complicated by the 3D nature of the CDW order, high temperatures. On the other hand, the linewidth extracted from
and the momentum dependence of the EPI and the response of the the analysis (Fig. 1f, symbols) of the ω2 mode is resolution limited
lattice to the opening of the gap at EF remains unsolved. In fact, across the whole BZ. Nevertheless, the linewidth of the ω1 branch is
inelastic x-ray scattering (IXS) and theoretical calculations dis- no longer resolution limited between 0.2 < h < 0.3 r.l.u. and develops
carded the Fermi surface nesting scenario proposed for 2H- an anomalously large broadening of ≈4 meV at h = 0.25 r.l.u.
NbSe220,21 and 1T-TiSe222,23 and emphasized the critical role of the Again, the experimental broadening is well captured by our cal-
momentum dependence of the EPI. In addition, it has been recently culations (dashed lines in Fig. 1f), indicating that the large
demonstrated that large anharmonic effects are required to suppress enhancement of the broadening is mainly due to the EPI even
the CDW phases in TMDs and understand their phase diagrams, if the anharmonic contribution to the linewidth also peaks at h =
both in the bulk and in the monolayer limit16,24–27p . ffiffiIndeed,
ffi pffiffiffi 0.25 r.l.u. (Supplementary Fig. 10).
an evolution from the (4 × 4) CDW in bulk VSe2 to a ( 7 ´ 3) Given the observation of the phonon broadening at room
electronic reconstruction has been reported by means of scanning temperature and the good agreement between theory and experi-
tunneling microscopy28, imperatively calling for a comprehensive ment, we proceed with the analysis of the lattice dynamics at lower
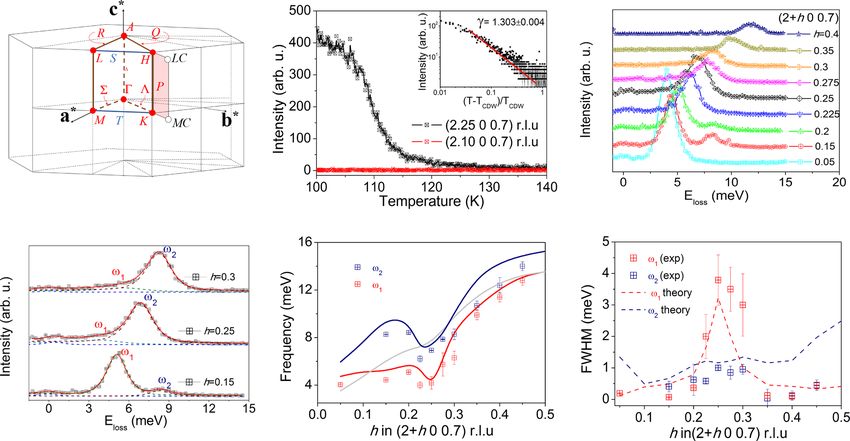
description of the nature of the 3D CDW in VSe2. temperatures. At 250 K, the phonon with energy ≈7 meV (ω2)
2 NATURE COMMUNICATIONS | (2021)12:598 | https://doi.org/10.1038/s41467-020-20829-2 | www.nature.com/naturecommunications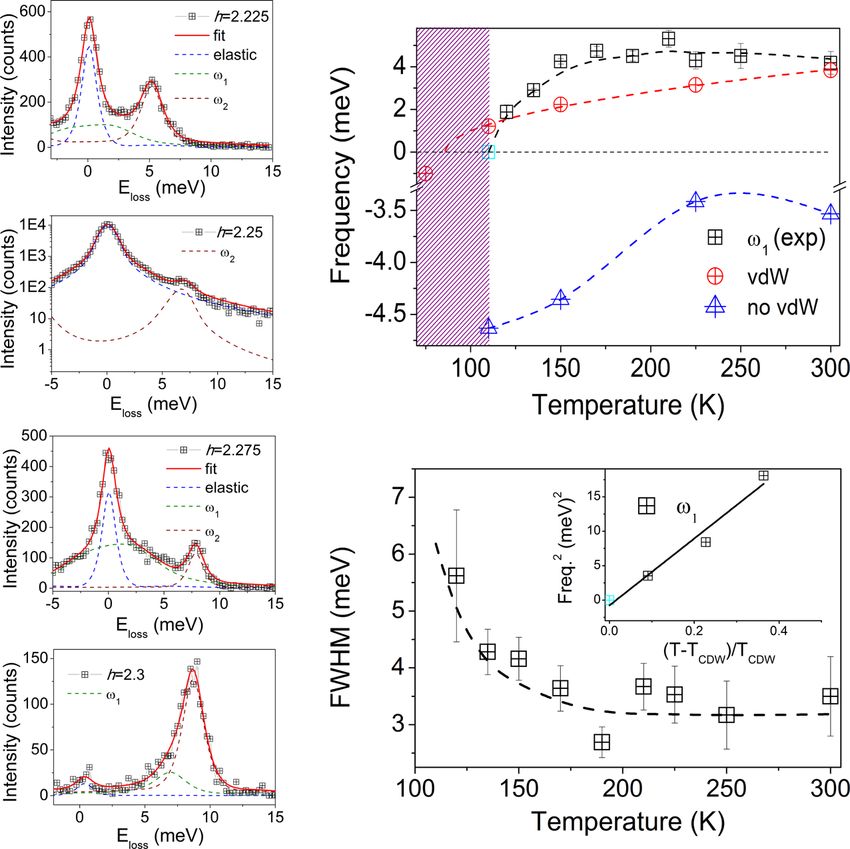
NATURE COMMUNICATIONS | https://doi.org/10.1038/s41467-020-20829-2                                                                      ARTICLE

  (a)                                           (b)                                                    (c)

  (d)                                           (e)                                                    (f)

Fig. 1 Elastic peak, CDW, and lattice dynamics at 300 K. a The Brillouin zone of space group P3m1 (164)52. b Temperature dependence of the elastic line
at (2.25 0 0.7) r.l.u. (reciprocal lattice unit) showing the onset of the CDW at 110 K. Inset, scaling analysis of the elastic peak. c Energy-momentum
dependence of the low-energy acoustic phonons at 300 K from 0.05 < h < 0.4 r.l.u. along the (2 + h 0 0.7) direction. The spectra are vertically offset for
clarity. d Close-up view of the phonon fitting at 300 K for selected momentum transfers, identifying the ω1 and ω2 phonons. e Experimental (points) and
calculated (solid lines) dispersion of the low-energy acoustic phonons at 300 K. The gray line stands for the silent mode, not observed experimentally.
f Momentum dependence of the linewidth for ω1 and ω2 obtained from the fitting of the experimental spectra to damped harmonic oscillators. In panels (e)
and (f), the error bars represent the fit uncertainty. The calculated linewidth including the contribution of the electron–phonon interaction and
anharmonicity is shown as dashed lines.

shows a clear asymmetric broadening at qCDW, i.e, the correspond-               unstable at all temperatures after withdrawing the van der Waals
ing branch ω1 appears to develop a redshift as a function of                    functional from DFT calculation (see blue triangle in Fig. 3e). The
temperature (Fig. 2b). The dispersion of ω2 at 150 K is similar to the          softening of the acoustic phonon is accompanied by a linewidth
one at 300 K. Contrarily, ω1 lowers its energy, softening from room             broadening at TCDW (Fig. 3f).
temperature down to 110 K. The softening extends over a wide
region of momentum space 0.225 < h < 0.3 r.l.u. (0.15 Å−1) at 150 K,
see green dotted line in Fig. 2a (and Supplementary Fig. 8). The                Role of EPI
pronounced instability of this acoustic mode and its broad extension            Having achieved a comprehensive description of the CDW and its
in momentum space are consistent with the results of our                        temperature dependence, we address the crucial role of the EPI and
anharmonic phonon calculations (solid lines in Fig. 2c). The                    nesting mechanism in the formation of the charge modulated state.
momentum space spread of the softening indicates a substantial                  In Fig. 4, we plot the calculated harmonic phonon frequency
localization of the phonon fluctuations in real space due to the EPI,            together with the electron–phonon linewidth of the three acoustic
questioning the pure nesting mechanism suggested by ARPES17.                    modes along q = (h 0 −1/3) r.l.u calculated within density-
More importantly, the softening of this branch represents the first              functional perturbation theory (DFPT). As it can be seen, the
indication of the lattice response to the formation of the 3D-CDW               harmonic phonon instability of ω1 coincides with a huge increase of
in VSe2. The analysis of the linewidth reveals that the lifetime of ω2          its linewidth associated with the EPI. The softening and the increase
remains nearly constant across the BZ and is resolution limited                 of the electron–phonon linewidth specially affect the ω1 mode,
(Fig. 2d). On the other hand, the softening of the ω1 mode at 150 K             which suggests that the electron–phonon matrix elements are
is accompanied by an enhancement of the linewidth, as shown in                  strongly mode and momentum dependent and have a strong
Fig. 2d (6 meV linewidth at 120 K, Fig. 3f) and, again, well modeled            impact on the real part of the phonon self-energy, which determines
by the ab initio calculations (dashed lines in Fig. 2d).                        the harmonic phonon frequencies8,21. This behavior is similar to
   At the critical temperature, TCDW = 110 K and q ≈ qCDW, the                  the one reported for 1T-TiSe2 and 2H-NbSe220,22. The real part of
spectrum is dominated by an elastic central peak at zero energy                 the non-interacting susceptibility χ0(q), which captures the full
loss (FWHM = 0.05 r.l.u. and ΔE = 1.6 meV), thus, the soft                      Fermi surface topology and also affects the real part of the phonon
mode is no longer resolvable (see Fig. 3a–d and Supplementary                   self-energy (see Supplementary Information), has a softening of
Fig. 9). Figure 3e displays the temperature dependence of the soft              around 4% at qCDW, which seems insufficient to explain the large
mode, ω1, as well as the frequency of the phonon obtained ab                    softening of the ω1 mode. This suggests that the electron–phonon
initio with and without including van der Waals corrections. As                 matrix elements are crucial to induce the harmonic softening and
plotted in Fig. 3e, the phonon frequency obtained ab initio follows             that the topology of the Fermi surface is not the driving mechanism.
the temperature dependence of the experimental acoustic branch.                 In order to further clarify the point, we calculate the so-called
Moreover, the high temperature 1T structure of VSe2 remains                     nesting function ζ(q) which measures the topology of the Fermi

NATURE COMMUNICATIONS | (2021)12:598 | https://doi.org/10.1038/s41467-020-20829-2 | www.nature.com/naturecommunications                                 3
ARTICLE                                                                    NATURE COMMUNICATIONS | https://doi.org/10.1038/s41467-020-20829-2

                             (a)                                              (b)

                                                                               (c)

                                                                               (d)

Fig. 2 Lattice dynamics at 150 K. a IXS energy-loss scans at (2 + h 0 0.7) r.l.u for 0.15 < h < 0.35 and 150 K. The dotted green line follows the dispersion of
the soft phonon mode, ω1 (see text). Each spectrum is vertically shifted for clarity. b Energy-loss scans as a function of temperature at (2.25 0 0.7) r.l.u.
The black arrow follows the softening of the low-energy acoustic mode upon cooling. In both (a) and (b) red lines are the result of the fitting to damped
harmonic oscillator functions convoluted with the instrumental resolution. c Momentum dependence of the frequency of the ω1 and ω2 branches at 150 K.
The anharmonic phonon dispersions of the acoustic modes obtained at 150 K are plotted as solid lines. The gray line represents the acoustic mode that is
silent in IXS. d Experimental (symbols) and theoretical (dashed lines) momentum dependence of the linewidth for ω1 and ω2. The error bars represent the
fit uncertainty. The theoretical calculation accounts for both the electron–phonon and anharmonic contributions to the linewidth.

surface and peaks at the nesting q points (Supplementary Infor-                  pointing to an intricate relationship between EPI and Fermi surface
mation). As shown in Fig. 4c, it peaks at qCDW, which indicates that             nesting scenarios in VSe2.
the CDW vector coincides with a nested region of the Fermi sur-
face. Considering that for constant electron–phonon matrix ele-
ments the nesting function coincides with the phonon linewidth                   Discussion
given by the EPI, it is illustrative to compare them. Clearly, the               Our anharmonic calculations, which predict that the ω1 fre-
phonon linewidth of the ω1 mode coming from the EPI depends                      quency vanishes between 75 and 110 K, are in good agreement
much more drastically on momentum than the nesting function: it                  with the experimentally measured phonon frequencies and the
changes by orders of magnitude as a function of q while the nesting              CDW temperature onset, TCDW = 110 K. When the SSCHA
function only by less than a factor of two. This is highlighted in the           anharmonic calculation is repeated without including the van der
ratio between the linewidth and the nesting function plotted in                  Waals corrections (blue triangles in Fig. 3e), the softest acoustic
Fig. 4d, which measures the momentum dependence of the                           mode at qCDW remains unstable even at room temperature.
electron–phonon matrix elements and should be flat if the                         Remarkably, the weak van der Waals forces (of the order of
electron–phonon matrix elements were constant. This ratio                        ~1mRy/a0 for a typical SSCHA supercell calculation) are
depends much more strongly on momentum than the nesting                          responsible for the stabilization of the 1T structure of VSe2 and
function itself and resembles the linewidth dependence, underlining              play a crucial role in melting the CDW. On the other hand, the
again that the momentum dependence of the electron–phonon                        damping ratio, Γ=~   ωq , increases upon cooling and the phonon
matrix elements plays a crucial role here. In conclusion, the EPI is             becomes critically overdamped at qCDW and 110 K. The damping
                                                                                                                           1=2
the main driving force of the CDW transition in 1T-VSe2 despite                  ratio Γ=~ωq is given by ω0 ¼ ð~ ω2q  Γ2 Þ , where Γ is the linewidth
the presence of nesting at qCDW. Nevertheless, the q-range over                  ~ q is the phonon energy renormalized by the real part of the
                                                                                 ω
which the phonon softens, Δq ≈ 0.075 r.l.u., even if it coincides with           susceptibility and ω0 is the energy of the phonon fitted to damped
an increase of the electron–phonon linewidth, is a factor of 3 less              harmonic oscillator. The critical exponent derived from the fitting
than in 1T-TiSe222, where EPI and excitonic correlations are                     of the phonon frequency vs reduced temperature ((T-TCDW)/
responsible for the structural instability and the CDW order,                    TCDW), β = 0.52 ± 0.04, agrees with the square-root power law

4                  NATURE COMMUNICATIONS | (2021)12:598 | https://doi.org/10.1038/s41467-020-20829-2 | www.nature.com/naturecommunications
NATURE COMMUNICATIONS | https://doi.org/10.1038/s41467-020-20829-2 ARTICLE
(a) (e)
(b)
(c)
(f)
(d)
Fig. 3 Phonon collapse and van der Waals melting. a–d Representative IXS spectra at 110 K and their corresponding fitting. The IXS scan at h=2.25 r.l.u. is
presented in logarithmic scale due to the large enhancement of the elastic line. ω1 stands for the soft mode. e Temperature dependence of the energy of the
ω1 branch and the anharmonic theoretical frequencies obtained with and without van der Waals corrections. The shaded area defines the CDW region.
f Temperature dependence of the linewidth. Inset, squared frequency of the soft mode as a function of the reduced temperature. Lines are guides to the
eye. The cyan squares in (e) and (f) (inset) refer to the frequency of the ω1 phonon extrapolated to the CDW temperature, since the large enhancement of
the elastic line precludes the extraction of its energy from the fitting analysis. The error bars in the experimental data points in panel (e) and (f) represent
the fit uncertainty.
Fig. 4 Electron–phonon interaction vs Fermi surface nesting. a Calculated harmonic phonon spectra of 1T-VSe2 along (h 0 -1/3) r.l.u. Only acoustic modes
are shown. The gray line denotes the mode silent in IXS, which is labeled as ω3 here. b Phonon linewidth (full width at half maximum) given by the
electron–phonon interaction for the same modes. c Real part of the non-interacting susceptibility, χ0, as well as the nesting function, ζ, at the same wave
vectors. d Ratio between the full width at half maximum given by the electron–phonon interaction and the nesting function.
NATURE COMMUNICATIONS | (2021)12:598 | https://doi.org/10.1038/s41467-020-20829-2 | www.nature.com/naturecommunications 5ARTICLE NATURE COMMUNICATIONS | https://doi.org/10.1038/s41467-020-20829-2
expected from the mean-field theory (inset of Fig. 3f) and, References
therefore, fluctuation corrections are unnecessary to invoke the 1. Grüner, G. Charge Density Waves in Solids (Addison-Wesley, 1994).
low TCDW of VSe2 as compared to its 1T counterparts. The critical 2. Frano, A., Blanco-Canosa, S., Keimer, B. & Birgeneau, R. J. Charge ordering in
superconducting copper oxides. J. Phys.: Condens. Matter 32, 374005 (2020).
role of the EPI has been recently suggested by Raman scattering35 3. Arpaia, R. et al. Dynamical charge density fluctuations pervading the phase
and DFT calculations36. Indeed, revisited ARPES experiments37 diagram of a Cu-based high-Tc superconductor. Science 365, 906–910 (2019).
in NbSe2 revealed a pronounced dispersion along kz discarding 4. Chaix, L. et al. Dispersive charge density wave excitations in Bi2Sr2CaCu2O8+δ.
the nesting-driven CDW formation and leaving EPI as the major Nat. Phys. 13, 952–956 (2017).
contributor20. Although our results indicate an EPI-driven CDW 5. Le Tacon, M. et al. Inelastic x-ray scattering in YBa2Cu3O6.6 reveals giant
phonon anomalies and elastic central peak due to charge-density-wave
instability, nesting is present and, thus, the charge modulated formation. Nat. Phys. 10, 52–58 (2014).
ground state of VSe2 has to be understood as an interplay 6. Chan, S. K. & Heine, V. Spin density wave and soft phonon mode from
between EPI and Fermi surface nesting scenarios. nesting Fermi surfaces. J. Phys. F: Met. Phys. 3, 795–809 (1973).
In conclusion, we have observed with high-resolution IXS that 7. Miao, H. et al. Formation of incommensurate charge density waves in
the CDW transition in 1T-VSe2 is driven by the collapse of an cuprates. Phys. Rev. X 9, 031042 (2019).
8. Johannes, M. D. & Mazin, I. I. Fermi surface nesting and the origin of charge
acoustic mode at qCDW = (0.25 0 −0.3) at TCDW = 110 K. The density waves in metals. Phys. Rev. B 77, 165135 (2008).
high-temperature 1T-VSe2 phase is stable thanks to anharmonic 9. Wilson, J., Salvo, F. D. & Mahajan, S. Charge-density waves and superlattices
effects. The observed wide softening in momentum space, the in the metallic layered transition metal dichalcogenides. Adv. Phys. 24,
calculated strongly momentum dependent electron–phonon line- 117–201 (1975).
width that peaks at qCDW, and the weaker dependence on the wave 10. Joe, Y. I. et al. Emergence of charge density wave domain walls above the
superconducting dome in 1T-TiSe2. Nat. Phys. 10, 421–425 (2014).
vector of the susceptibility suggest that the EPI is the main driving 11. Rossnagel, K. On the origin of charge-density waves in select layered
force of the CDW transition despite the presence of nesting. transition-metal dichalcogenides. J. Phys.: Condens. Matter 23, 213001 (2011).
Moreover, the results show that van der Waals forces are respon- 12. C. F. van Bruggen, C. Magnetic susceptibility and electrical properties of VSe2
sible for the melting of the CDW. The dominant role of van der single crystals. Solid State Commun. 20, 251–253 (1976).
Waals forces here may be attributed to the out-of-plane nature of 13. Lee, P. A., Rice, T. M. & Anderson, P. W. Fluctuation effects at a Peierls
transition. Phys. Rev. Lett. 31, 462–465 (1973).
the CDW, which modulates the interlayer distance. This is not the 14. Driza, N. et al. Long-range transfer of electron-phonon coupling in oxide
case in 2H-NbSe2, where the bulk and monolayer transition tem- superlattices. Nat. Mater. 11, 675–681 (2012).
peratures seem to be similar26,38. This line of thinking is consistent 15. Lin, M.-L. et al. Cross-dimensional electron-phonon coupling in van der
with the enhancement of the CDW in monolayer VSe2, TCDW = Waals heterostructures. Nat. Commun. 10, 2419 (2019).
220 K28, since the out-of-plane van der Waals interactions are 16. Leroux, M. et al. Strong anharmonicity induces quantum melting of charge
density wave in 2H-NbSe2 under pressure. Phys. Rev. B 92, 140303 (2015).
absent in this case. The critical role of out-of-plane coupling of 17. Strocov, V. N. et al. Three-dimensional electron realm in VSe2 by soft-x-ray
layers has also been highlighted in the development of the 3D photoelectron spectroscopy: origin of charge-density waves. Phys. Rev. Lett.
CDW in high-Tc cuprate superconductors39–41. 109, 086401 (2012).
18. Tsutsumi, K. X-ray-diffraction study of the periodic lattice distortion
associated with a charge-density wave in 1T-VSe2. Phys. Rev. B 26, 5756–5759
Methods (1982).
Sample growth and characterization. High-quality single crystals of VSe2 with
19. Terashima, K. et al. Charge-density wave transition of 1T-VSe2 studied by
dimensions 2 × 2 × 0.05 mm3 were grown by chemical vapor transport (CVT)
angle-resolved photoemission spectroscopy. Phys. Rev. B 68, 155108 (2003).
using iodine as transport agent (see Supplementary Figs. 1, 2 for their structural,
20. Weber, F. et al. Extended phonon collapse and the origin of the charge-density
magnetic42 and electronic characterization).
wave in 2H-NbSe2. Phys. Rev. Lett. 107, 107403 (2011).
21. Calandra, M., Mazin, I. I. & Mauri, F. Effect of dimensionality on the charge-
Inelastic x-ray scattering (IXS) measurements. The high-resolution IXS density wave in few-layer 2H-NbSe2. Phys. Rev. B 80, 241108 (2009).
experiments were carried out using the HERIX spectrometer at the 30-ID beamline 22. Weber, F. et al. Electron-phonon coupling and the soft phonon mode in TiSe2.
of the Advanced Photon Source (APS), Argonne National Laboratory. The incident Phys. Rev. Lett. 107, 266401 (2011).
beam energy was 23.72 keV and the energy and momentum resolution was 1.5 meV 23. Calandra, M. & Mauri, F. Charge-density wave and superconducting dome in
and 0.7 nm−1, respectively,43. The components (hkl) of the scattering vector are TiSe2 from electron-phonon interaction. Phys. Rev. Lett. 106, 196406 (2011).
expressed in reciprocal lattice units (r.l.u.), (hkl) = ha* + kb* + lc*, where a*, b*, 24. Bianco, R., Errea, I., Monacelli, L., Calandra, M. & Mauri, F. Quantum
and c* are the reciprocal lattice vectors. The experimental lattice constants of the enhancement of charge density wave in NbS2 in the two-dimensional limit.
hexagonal unit cell at room temperature are a = 3.346 Å, c = 6.096 Å, and γ = 120∘. Nano Lett. 19, 3098–3103 (2019).
Here, we focus on the low-energy acoustic phonon branches dispersing along the (0 25. Zhou, J. S. et al. Anharmonicity and doping melt the charge density wave in
< h < 0.5 0 −0.3) r.l.u direction in the Brillouin zone near the reciprocal lattice single-layer NbSe2. Nano Lett. 20, 4809–4815 (2020).
vector G201, thus, in the range (2 + h 0 −0.3) r.l.u with 0 < h < 0.5.
26. Bianco, R., Monacelli, L., Calandra, M., Mauri, F. & Errea, I. Weak
dimensionality dependence and dominant role of ionic fluctuations in the
First-principles calculations. The variational SSCHA32–34 method was used to charge-density-wave transition of NbSe2. Phys. Rev. Lett. 125, 106101 (2020).
calculate temperature-dependent phonons fully accounting for non-perturbative 27. Zhou, J. S. et al. Theory of the thickness dependence of the charge density
anharmonic effects. The variational free energy minimization of the SSCHA was wave transition in 1T-TiTe2. 2D Materials 7, 045032 (2020).
performed by calculating forces on 4 × 4 × 3 supercells (commensurate with qCDW) 28. Chen, P. et al. Unique gap structure and symmetry of the charge density wave
making use of DFT within the Perdew–Burke–Ernzerhof (PBE)44 parametrization in single-layer VSe2. Phys. Rev. Lett. 121, 196402 (2018).
of the exchange-correlation functional. Van der Waals corrections were included 29. Baker, G. A., Nickel, B. G. & Meiron, D. I. Critical indices from perturbation
within Grimme’s semiempirical approach45. Harmonic phonon frequencies and analysis of the Callan-Symanzik equation. Phys. Rev. B 17, 1365–1374 (1978).
electron–phonon matrix elements were calculated within density-functional per- 30. Girault, S., Moudden, A. H. & Pouget, J. P. Critical x-ray scattering at the
turbation theory (DFPT)46. The force calculations in supercells needed for the Peierls transition of the blue bronze. Phys. Rev. B 39, 4430–4434 (1989).
SSCHA as well as the DFPT calculations were performed within the QUANTUM 31. Hoesch, M., Bosak, A., Chernyshov, D., Berger, H. & Krisch, M. Giant Kohn
ESPRESSO package47,48 (See Supplementary Information for further details on the
anomaly and the phase transition in charge density wave ZrTe3. Phys. Rev.
calculations, which includes citations to refs. 49–51). Lett. 102, 086402 (2009).
32. Errea, I., Calandra, M. & Mauri, F. Anharmonic free energies and phonon
Data availability dispersions from the stochastic self-consistent harmonic approximation:
The data that support the findings of this study are available from the corresponding Application to platinum and palladium hydrides. Phys. Rev. B 89, 064302
author upon reasonable request. See author contributions for specific data sets. (2014).
33. Bianco, R., Errea, I., Paulatto, L., Calandra, M. & Mauri, F. Second-order
structural phase transitions, free energy curvature, and temperature-dependent
Received: 23 July 2020; Accepted: 22 December 2020; anharmonic phonons in the self-consistent harmonic approximation: theory and
stochastic implementation. Phys. Rev. B 96, 014111 (2017).
6 NATURE COMMUNICATIONS | (2021)12:598 | https://doi.org/10.1038/s41467-020-20829-2 | www.nature.com/naturecommunicationsNATURE COMMUNICATIONS | https://doi.org/10.1038/s41467-020-20829-2 ARTICLE
34. Monacelli, L., Errea, I., Calandra, M. & Mauri, F. Pressure and stress tensor of Graphene Flagship Core 3. Calculations were performed at the Joliot Curie-AMD
complex anharmonic crystals within the stochastic self-consistent harmonic supercomputer under the PRACE project RA4956. This research used resources of the
approximation. Phys. Rev. B 98, 024106 (2018). Advanced Photon Source, a U.S. Department of Energy (DOE) Office of Science User
35. Pandey, J. & Soni, A. Electron-phonon interactions and two-phonon modes Facility, operated for the DOE Office of Science by Argonne National Laboratory under
associated with charge density wave in single crystalline 1T-VSe2. Phys. Rev. Contract No. DE-AC02-06CH11357. Extraordinary facility operations were supported in
Res. 2, 033118 (2020). part by the DOE Office of Science through the National Virtual Biotechnology
36. Si, J. G. et al. Origin of the multiple charge density wave order in 1T-VSe2. Laboratory, a consortium of DOE national laboratories focused on the response to
Phys. Rev. B 101, 235405 (2020). COVID-19, with funding provided by the Coronavirus CARES Act.
37. Weber, F. et al. Three-dimensional Fermi surface of 2H-NbS2: Implications for
the mechanism of charge density waves. Phys. Rev. B 97, 235122 (2018).
38. Ugeda, M. M. et al. Characterization of collective ground states in single-layer
Author contributions
S.B.-C. conceived and managed the project. S.K.M. and K.R. synthesized and S.B.-C.
NbSe2. Nat. Phys. 12, 92–97 (2016).
characterized the samples. A.H.S. and S.B.-C. carried out the high-resolution IXS
39. Bluschke, M. et al. Stabilization of three-dimensional charge order in
experiments. S.B.-C. analyzed the experimental data. J.D., R.B., L.M., M.C., F.M. and I.E.
YBa2Cu3O6+x via epitaxial growth. Nat. Commun. 9, 2978 (2018).
performed the first principles calculations. S.B.-C. and I.E. wrote the manuscript with
40. Kim, H.-H. et al. Uniaxial pressure control of competing orders in a high-
input from all co-authors.
temperature superconductor. Science 362, 1040–1044 (2018).
41. He, Y. et al. Persistent low-energy phonon broadening near the charge-order q
vector in the bilayer cuprate Bi2Sr2CaCu2O8+δ. Phys. Rev. B 98, 035102 (2018). Competing interests
42. Fumega, A. O. et al. Absence of ferromagnetism in VSe2 caused by its charge The authors declare no competing interests.
density wave phase. J. Phys. Chem. C 123, 27802–27810 (2019).
43. Said, A. H. et al. High-energy-resolution inelastic X-ray scattering
spectrometer at beamline 30-ID of the advanced photon source. J. Synchrotron Additional information
Radiat. 27, 827–835 (2020). Supplementary information is available for this paper at https://doi.org/10.1038/s41467-
44. Perdew, J. P., Burke, K. & Ernzerhof, M. Generalized gradient approximation 020-20829-2.
made simple. Phys. Rev. Lett. 77, 3865–3868 (1996).
45. Grimme, S. Semiempirical GGA-type density functional constructed with a Correspondence and requests for materials should be addressed to I.E. or S.B.-C.
long-range dispersion correction. J. Comput. Chem. 27, 1787–1799 (2006).
46. Baroni, S., de Gironcoli, S., Dal Corso, A. & Giannozzi, P. Phonons and related Peer review information Nature Communications thanks Ajay Soni and the other,
crystal properties from density-functional perturbation theory. Rev. Mod. anonymous, reviewer(s) for their contribution to the peer review of this work. Peer
Phys. 73, 515–562 (2001). reviewer reports are available.
47. Giannozzi, P. et al. QUANTUM ESPRESSO: a modular and open-source
software project for quantum simulations of materials. J. Phys. Condens. Reprints and permission information is available at http://www.nature.com/reprints
Matter 21, 395502 (2009).
48. Giannozzi, P. et al. Advanced capabilities for materials modelling with Publisher’s note Springer Nature remains neutral with regard to jurisdictional claims in
QUANTUM ESPRESSO. J. Phys.: Condens. Matter 29, 465901 (2017). published maps and institutional affiliations.
49. Marzari, N. & Vanderbilt, D. Maximally localized generalized Wannier
functions for composite energy bands. Phys. Rev. B 56, 12847–12865 (1997).
50. Souza, I., Marzari, N. & Vanderbilt, D. Maximally localized Wannier functions Open Access This article is licensed under a Creative Commons
for entangled energy bands. Phys. Rev. B 65, 035109 (2001). Attribution 4.0 International License, which permits use, sharing,
51. Mostofi, A. A. et al. Wannier90: a tool for obtaining maximally-localised adaptation, distribution and reproduction in any medium or format, as long as you give
Wannier functions. Comput. Phys. Commun. 178, 685–699 (2008). appropriate credit to the original author(s) and the source, provide a link to the Creative
52. Aroyo, M. I. et al. Brillouin-zone database on the Bilbao Crystallographic Commons license, and indicate if changes were made. The images or other third party
Server. Acta Crystallogr. A 70, 126–137 (2014). material in this article are included in the article’s Creative Commons license, unless
indicated otherwise in a credit line to the material. If material is not included in the
article’s Creative Commons license and your intended use is not permitted by statutory
Acknowledgements regulation or exceeds the permitted use, you will need to obtain permission directly from
The authors acknowledge valuable discussions with V. Pardo, A. O. Fumega and M. the copyright holder. To view a copy of this license, visit http://creativecommons.org/
Hoesch. S.B-C thanks the MINECO of Spain through the project PGC2018-101334-A- licenses/by/4.0/.
C22. F.M. and L.M. acknowledge support by the MIUR PRIN-2017 program, project
number 2017Z8TS5B. M.C. acknowledges support from Agence Nationale de la
Recherche, Project ACCEPT, Grant No. ANR-19-CE24-0028 and M.C and F.M. the © The Author(s) 2021
NATURE COMMUNICATIONS | (2021)12:598 | https://doi.org/10.1038/s41467-020-20829-2 | www.nature.com/naturecommunications 7You can also read