Analysis of the KROTOS KFC test by coupling X-Ray image analysis and MC3D calculations
←
→
Page content transcription
If your browser does not render page correctly, please read the page content below
Proceedings of ICAPP ‘12
                                                                                                  Chicago, USA, June 24-28, 2012
                                                                                                                    Paper 12143

          Analysis of the KROTOS KFC test by coupling X-Ray image analysis
                              and MC3D calculations

        BRAYER Claude*, CHARTON Antoine, GRISHCHENKO Dmitry, FOUQUART Pascal, BULLADO Yves,
            COMPAGNON Frédéric, CORREGGIO Patricia, CASSIAUT-LOUIS Nathalie, PILUSO Pascal

                            Commissariat à l’Energie Atomique et aux Energies Alternatives
                                                   CEA Cadarache
                                                  DEN, STRI, LMA,
                                       F-13108 Saint-Paul-Lès-Durance, France
        * Corresponding author: Tel: +33(0)442 25 43 01, Fax: +33(0)442 25 77 88, e-mail: claude.brayer@cea.fr

Abstract – During a hypothetical severe accident sequence in a Pressurized Water Reactor (PWR), the hot molten materials
(corium) issuing from the degraded reactor core may generate a steam explosion if they come in contact with water and may
damage the structures and threaten the reactor integrity. The SERENA program is an international OECD project that aims
at helping the understanding of this phenomenon also called Fuel Coolant Interaction (FCI) by providing data. CEA takes
part in this program by performing tests in its KROTOS facility where steam explosions using prototypic corium can be
triggered. Data about the different phases in the premixing are extracted from the KROTOS X-Ray radioscopy images by
using KIWI software (KROTOS Image analysis of Water-corium Interaction) currently developed by CEA. The MC3D code,
developed by IRSN, is a thermal-hydraulic multiphase code mainly dedicated to FCI studies. It is composed of two
applications: premixing and explosion. An overall FCI calculation with MC3D requires a premixing calculation followed by
an explosion calculation. The present paper proposes an alternative approach in which all the features of the premixing are
extracted from the X-Ray pictures using the KIWI software and transferred to an MC3D dataset for a direct simulation of the
explosion. The main hypothesis are discussed as well as the first explosion results obtained with MC3D for the KROTOS
KFC test. These results are rather encouraging and are analyzed on the basis of comparisons with the experimental data.

                                                                    predict Fuel-Coolant Interaction (FCI) induced dynamic
    I. INTRODUCTION                                                 loading of the reactor structures. In its second phase, the
                                                                    project is devoted to complementary research possibly
     During a hypothetical severe accident sequence in a
                                                                    needed to increase the level of confidence of the
Pressurized Water Reactor (PWR), the reactor core may
                                                                    predictions which includes experimental studies2. CEA
melt down generating a hot mixture named corium. If this
                                                                    takes part in these studies by performing experiments in
molten mixture is brought into contact with water, a steam
                                                                    the KROTOS facility3, 4. In this facility, energetic steam
explosion may occur, damage the reactor structures and
                                                                    explosions can be triggered and studied using prototypic
threaten the reactor integrity.
                                                                    corium. Direct visual observations of melt injection into a
     Such a situation may be encountered if the hot corium
                                                                    water tank can be performed allowing a precise assessment
flows down to the water-filled lower head of the reactor
                                                                    of the mixing conditions.
vessel (in-vessel interaction) or in a flooded cavity (ex-
                                                                         Pre- and post-analysis of the KROTOS tests are
vessel interaction)1. These situations have been addressed
                                                                    carried out by CEA with the MC3D software. Developed
in the frame of the international OECD SERENA (Steam
                                                                    by IRSN, MC3D is a thermal-hydraulic multiphase flow
Explosion REsolution for Nuclear Applications) project
                                                                    code mainly dedicated to in-vessel and ex-vessel FCI
which aims at helping the understanding of the interaction
                                                                    studies5.
mechanism between the different components of the
                                                                         After presenting the KROTOS facility, this paper
system: the hot molten mixture, the liquid water, the
                                                                    describes the scoping test KFC and presents the results
generated corium fragments and steam. The purely
                                                                    obtained from the analysis of the X-ray radioscopy images
analytical phase 1 of the SERENA program (now
                                                                    using KIWI software.
completed) provided a status of the code capabilities to

                                                             1854
Proceedings of ICAPP ‘12
                                                                                                       Chicago, USA, June 24-28, 2012
                                                                                                                         Paper 12143

    Then, instead of running a full calculation of the test,            fragmentation). The prompt increase in the fuel surface
an alternative approach is proposed in which the MC3D                   area vaporizes more liquid coolant and increases again the
explosion calculation is performed using these results from             local vapor pressure. This pressure wave tends to
the X-ray radioscopy images as an input. This work will be              accelerate the various fluids composing the system and,
presented with some focus on the way the X-ray results are              when the velocity differences between the phases become
processed to be transferred in the MC3D input deck. The                 significant, thermal fragmentation gives way to
MC3D explosion results are then compared to the                         hydrodynamic fragmentation9. Finer fragments are then
KROTOS KFC experimental results.                                        generated during this phase, their size being in the range of
                                                                        the a few tens of microns.
    II. STEAM EXPLOSION                                                      Given the presence of a trigger (pressure pulses
                                                                        resulting from melt impact at the bottom of the tank, for
     A steam explosion is a physical phenomenon in which
                                                                        example), a vapor explosion can occur, characterized by a
a hot liquid (the molten fuel) rapidly fragments and
                                                                        pressure wave that spatially propagates through the fuel-
transfers its internal energy to a colder more volatile liquid
                                                                        coolant mixture as the swift fuel fragmentation and
(the coolant). In doing so, the coolant vaporizes at high
                                                                        quenching process spreads through the mixture. Significant
pressures and expands, doing work on its surroundings.
                                                                        heat exchanges between the fragments and the coolant
Indeed, a significant fraction of the thermal energy of the
                                                                        govern the violent liquid water vaporization feeding the
hot liquid is transferred to the cold liquid and converted
                                                                        pressure wave. The expansion of the resulting high-
into destructive mechanical energy due to the explosive
                                                                        pressure mixture behind the propagation front against the
vapor production and expansion6.
                                                                        constraints imposed by the surroundings determines the
     The steam explosion process is then commonly
                                                                        damage potential of a vapor explosion6, 10.
divided into four phases: the premixing, the triggering, the
explosion propagation and expansion phase7.
                                                                            III. KROTOS EXPERIMENT
     During the premixing phase, the molten fuel jet breaks
up and a coarsely mixed region of molten corium and
coolant appears.                                                             III.A. KROTOS Experimental facility
     Furthermore, during the premixing phase, a stable                       KROTOS is a facility devoted to the study of the Fuel
vapor film appears around the fuel particles. This allows               Coolant Interaction (FCI) phenomena and designed for the
large quantities of melt and coolant to intermix owing to               assessment of both simulant and prototypical materials
density and/or velocity differences as well as vapor                    (corium). The scheme of the installation is presented in the
production.                                                             Fig. 1. It consists of four main parts: the furnace, the
     Due to the vapor film that separates the melt and the              transfer channel, the test section and the X-Ray radioscopy
coolant, the heat transfers between the two liquids are                 system. Several computers remotely control the operation
relatively low, leading to a metastable phase which time                of the facility, including: control command, data
scale is in a range of seconds. The heat transfer regime                acquisition, mass spectrometer and X-Ray radioscopy
between the two fluids is then film boiling.                            control.
     To summarize, the premixing phase is characterized                      The furnace is a water cooled stainless steel container
by8:                                                                    designed to withstand 4MPa pressure and equipped with a
- a time scale of the order of a few seconds,                           three-phase cylindrical heating resistor made of tungsten.
- a space scale of several orders of magnitude ranking                  In order to avoid heat losses, the heating element is
    from the millimeter (order of magnitude of the size of              surrounded by a series of concentric reflectors and closed
    the generated particles) to several meters (reactor size),          by circular lids made of molybdenum. The tungsten
- strong non-equilibrium heat transfers involving                       crucible is hanged inside the heating element; its net
    temperatures from ~300K (liquid water) to 3000K                     volume is 1 liter and allows the melting of up to 6 kg of
    (molten fuel) and pressures from 1 to ~200bar,                      corium. The facility is developed to operate in inert
- multiple fragmentation and mixing processes and                       atmosphere or vacuum at temperatures up to 2800 °C.
    generation of a steam film around the fuel particles                     The transfer channel is a vertical tube, connecting the
    (film boiling heat transfer).                                       furnace and the test section. It is used to transfer the
     The triggering phase is initiated by an event (the                 crucible containing the melt to the test section. At the top
trigger) that disturbs the metastable film conditions                   of the transfer channel a fast hydraulic ball valve is
engendered during the premixing phase. It is generally                  positioned. When the crucible is released, it falls down by
agreed that the passage of a low-amplitude pressure wave                gravity through the transfer channel until the impact on a
destabilizes the vapor film surrounding the fuel particles.             puncher located at the top of the test section. This puncher
The film collapse leads to a liquid (fuel)-liquid (coolant)             breaks the bottom of the crucible and permits the corium to
contact that causes the fuel to rapidly fragment (thermal               flow down to the test section through a melt release cone.

                                                                 1855
Proceedings of ICAPP ‘12
                                                                                                        Chicago, USA, June 24-28, 2012
                                                                                                                          Paper 12143

The diameter of the jet is controlled by the geometry of the             the central axis (designated as ZT1, ZT2 etc, numbered
nozzle and is equal to 30 mm at the exit. A fusible tin disk             from bottom to top). The melt release from the orifice is
is placed between the puncher and the cone to stop the                   filmed by a high-speed video camera at 500 fps through a
corium flow and have a pure gravitational jet.                           100 mm view window; the temperature of the melt is
     The test section consists of a pressure vessel with a               measured by a dichromatic pyrometer. In order to avoid
test tube inside. Both are made of strong tempered 7075                  vapor condensation on the internal surface of the view
aluminium alloy, characterized by low attenuation of X-                  window, a flow of hot air is directed on it from outside.
Ray radiation. The pressure vessel is designed to sustain                The temperature of the water is measured by K-Type
2.5 MPa at 373 K and is provided with a number of feed-                  thermocouples (designated as TT1, TT2 etc), placed at the
through for auxiliary gas connections and mounting of                    same elevation as ZTs, but along the wall of the test tube.
instrumentation and a view window of diameter 100 mm.                    The static pressure and temperature within the test section
     The test tube is a freestanding cylinder filled with                are controlled at three levels: at the bottom, at the edge of
water. Its internal diameter is 0.2 m, its height is 1.6 m, and          the test tube and the level of the puncher. During the melt
the water level is usually around 1.15 m. At the bottom of               penetration through the water the global void fraction is
the test tube a pressurized gas trigger (150 bars) is                    measured by the variation of the water level. A TDR-type
positioned. It is used to activate the steam explosion after             (time domain reflectometry) probe is used for the water
the premixing phase of the FCI. Both the chamber and the                 level measurement and positioned at the top of the test
test tube are heavily equipped with instrumentation in                   tube. The fragmentation of the melt within the test tube is
order to follow the premixing, the propagation and the                   filmed locally by the X-Ray radioscopy system. The
explosion phases and thus to provide maximum                             obtained video is processed afterwards to evaluate the
information on FCI.                                                      corium, the water and the void volume fractions, thus
                                                                         providing unique data on the physics of premixing. All of
                                                                         the listed above sensors are connected to the slow
                                                                         acquisition system (1 kHz).
                                                                              As soon as the melt leading edge reaches the ZT2
                                                                         thermocouple (positioned near the bottom of the test tube)
                                                                         a command is issued to the booster to activate the trigger,
                                                                         and thus to initiate the explosion phase of the FCI. The
                                                                         propagation of the explosion pressure wave within the test
                                                                         tube is followed by a series of the dynamic pressure
                                                                         transducers (KISTLER 6005), positioned along the wall of
                                                                         the test tube (designated as K1, K2 etc, see Figure 3).
                                                                         These sensors are connected to the fast acquisition system
                                                                         (50 kHz).
                                                                              After the test the debris are collected, dried and
                                                                         analyzed. The particle size distribution, phase composition
                                                                         and morphology are obtained.

                                                                              III.B. X-ray radioscopy system
                                                                              The KROTOS radioscopy system has been designed
                                                                         for simultaneous visualization of the corium, void and
                                                                         water in the premixture. This is realized by a combination
                                                                         of the high-energy X-ray source and a low-density alloy
                                                                         (90wt% Al) for the manufacturing of the pressure vessel
                                                                         and test section walls. Its scheme is presented in the Fig. 2.
                                                                         The X-ray source (LINATRON of VARIANT) is normally
                                                                         operated at 9 MeV emitting impulses at 55 Hz (meaning a
                                                                         delay of 18 ms between two frames) with 4.5 µs duration.
                                                                         The X-ray passes a series of filters (to avoid the image
                                                                         oversaturation and to harden the beam), the lead collimator
    Fig. 1. The KROTOS facility and instrumentation                      (which decreases the image noise by suppressing
                                                                         significant amount of scattered radiation) and penetrates
    The propagation of the melt within the test section,                 the test section and test tube. Transmitted radiation is
from the puncher to the bottom of the test tube is tracked               transformed into visual spectrum by the scintillator screen.
by a series of sacrificial thermocouples positioned along                The image formed at the rear side of the screen is filmed

                                                                  1856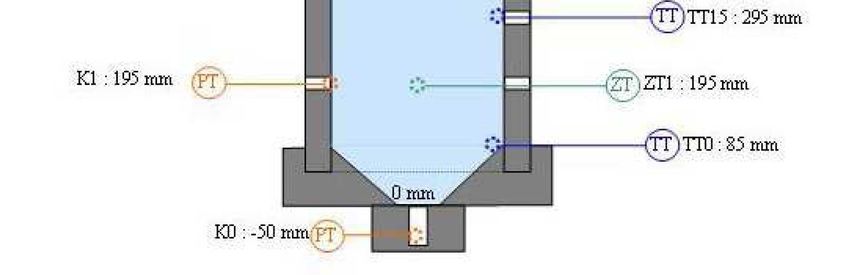
Proceedings of ICAPP ‘12
Chicago, USA, June 24-28, 2012
Paper 12143
with a high sensitive gray level CCD camera. The camera Between raw and processed images, the image has
is rotated on 90° to the axis of the X-ray source and been cleaned up (removal of lines and sparks) and the
protected by a series of lead screens in order to avoid background has been removed. Between processed and
direct exposure and to minimize scattered radiation falling decomposed images, the corium and the void have been
onto the CCD matrix of the camera. extracted, based on the pixel intensities, and the void
contour detection has been performed.
From the image pixel intensities, KIWI software
extracts the void fraction and volume and the corium
fragment volumes, surfaces and diameters. It also can
compute the velocity of the corium fragments by tracking
the fragments between following frames (Fig. 4).
1: x-ray source; 2: lead collimator; 3: test section and test tube; 4: scintillator; 5: mirror; 6: opaque
box; 7: lead screen; 8: high sensitivity CCD Camera; 9: camera acquisition/control block.
Fig. 2. Principle scheme of KROTOS radioscopy
system
The video acquisition rate is a function of the desired
image resolution and grey level depth (camera data transfer
limit). The image field of view covers fully the diameter of Fig. 4. Fragment tracking in order to compute their
the test tube (200 mm). It is limited in the vertical direction velocity
to about 310 mm. In order to obtain full information on the
fragmentation process the vertical position of the X-Ray
radioscopy system can be changed between experiments to IV. KFC TEST AND ANALYSIS
the desired level. The maximum recording time is 30 s. KFC test was a scoping test for SERENA KROTOS
The usual duration of the premixing (from the melt release tests. It was performed without the fusible tin disk between
to the explosion) is about 1 s, corresponding to 55 frames. the puncher and the release cone. The KFC test conditions
are the following11:
III.C. The KIWI software Table I
The KROTOS radioscopy requires comprehensive and KROTOS-KFC test conditions
accurate image analysis that cannot be performed by
available market softwares. For this reason a specific Furnace
software KIWI (KROTOS Image analysis of Water-corium Load composition (w% UO2 – w%ZrO2) 70:30
Interaction) has been developed to perform both image Load mass (kg) 2.876
processing/analysis and data computations. KIWI has been Load temperature (K) 2933
implemented using MATLAB and can be executed on Load overheating (K) 100
Mac, UNIX and Windows platforms. The main goals of the Test section
KIWI software are: processing the images and extract the Pressure (bar) 4.00
volume fractions of the different phases in the premixture. Free volume (l) 199.7
An example of image processing is provided in Fig. 3: Water level (mm) 1245
Water temperature (K) 300
Water subcooling (K ) 117
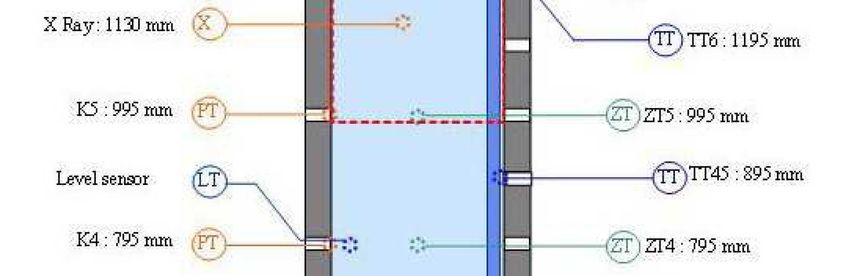
The KFC test instrumentation is illustrated in Fig. 5
and Fig. 6. The radioscopy window (310 mm height) is
situated between 975 and 1285 mm. The top of the
window is then 4 cm above the water level.
The crucible was released in the transfer tube when
the corium temperature reached 2936 K. During premixing
Fig. 3. Example of a KROTOS-KFC image processing the pressure in the test vessel increased to reach 4.14 bar at
with the KIWI software. the triggering time. The water temperature in the test
section measured by the TT thermocouples also increased
1857
Proceedings of ICAPP ‘12
                                                                                                   Chicago, USA, June 24-28, 2012
                                                                                                                     Paper 12143

to reach an average temperature of 318 K at the triggering               The radioscopy picture observations showed that two
time. The explosion started between K3 and K4 and                   stages appeared in this test: an ejection of a spray of
propagated in both directions. A reinforcement of the wave          corium fragments followed, 0.31 s later, by a more
was observed at K4 elevation and finally the highest                coherent corium jet (Fig. 7). The diameter of this jet is
pressure peak was found at K5 elevation (323 bar).                  rather small, 1.6 cm instead of the 3 cm as expected
                                                                    (corresponding to the diameter of the release cone)

                                                                                   a                            b
                                                                        Fig. 7. KROTOS-KFC. Shapes of corium flow.
                                                                        a: beginning spray and b: following coherent jet.
                                                                    This behavior can be connected to the absence of the tin
                                                                    disc in the KROTOS-KFC setup. The analysis of the
                                                                    corium phase by KIWI software shows that the velocity of
                                                                    the fragments in the beginning spray decreases rapidly
                                                                    (down to 1m/s). The following jet velocity remains
                                                                    between 3 and 4 m/s. A fluctuation of droplet sizes can be
                                                                    observed linked by a fluctuation of their velocities, smaller
                                                                    fragments having a lower velocity (Fig. 8SEQ). The
    Fig. 5. KROTOS-KFC test tube instrumentation                    average velocity of the corium droplets is 2.18 m/s.

                                                                        Fig. 8. KROTOS-KFC. Volume and velocity of the
                                                                        fragments tracked in the X-ray window vs. time
                                                                        Another way to get the average velocity of the fuel
                                                                    droplets is to get the volume of corium flowing through the
                                                                    X-ray window. Since in the KROTOS-KFC test the
                                                                    window is positioned at the top of the test section, the
    Fig. 6. KROTOS-KFC test vessel instrumentation                  global volume of corium present in the test section can be

                                                             1858
Proceedings of ICAPP ‘12
                                                                                                     Chicago, USA, June 24-28, 2012
                                                                                                                       Paper 12143

determined. The average corium velocity can therefore be              complete steam explosion simulation is then achieved in
deduced (Fig. 9). A value of 2.24 m/s was then obtained.              two steps. It also may be possible to perform direct
This value, close to the average fragment velocity                    explosion calculations by setting the assumed premixing
calculated above means that the procedure developed to                configuration in the data set.
track the fragments was correct and didn’t bring any error.
                                                                           V.A. The premixing application
                                                                           This application focuses on the modeling of the
                                                                      fragmentation of the molten corium jet into large droplets
                                                                      (coarse fragmentation), on the calculation of the secondary
                                                                      fragmentation and on the corium/coolant heat transfer
                                                                      estimation. The fuel is described using two fields so that its
                                                                      two states can be represented:
                                                                      - the continuous fuel phase (jet),
                                                                      - the discontinuous fuel phase (the droplets).
                                                                           Mass transfers between the two fuel fields are
                                                                      estimated during the jet fragmentation and the coalescence
                                                                      processes. Two other fields are defined to represent the
                                                                      coolant phase:
    Fig. 9. KROTOS-KFC. Volume of corium in the test                  - a liquid field,
    section given by KIWI vs. time.                                   - a gas field, mixture of steam and non condensable
     The evolution of the global void fraction can usually                 gases, its composition being governed by the partial
be deduced from the water level evolution, correlated with                 pressure of each component.
the pressure variations in the test section. However, during
the KFC test, an overflow of the test tube at the lower edge               V.B. The explosion application
of the view window made this signal not usable for void                    The explosion application is dedicated to the
fraction estimation. The void volume in the X-ray window              calculation of the fine fragmentation of the droplets
was then only given by the void analysis with the KIWI                generated during the premixing phase as well as the heat
software. Fluctuations can be observed, linked to the                 transfers between these fragments and the surrounding
fragments’ size fluctuations, the presence of smaller                 fluid phases. Applying a user-defined pressure pulse at a
fragments corresponding to a higher void volume (Fig.                 user-defined location within the domain may trigger it.
10).                                                                       In this application, there is no more continuous field to
                                                                      represent the fuel that can be found in two different
                                                                      dispersed fields:
                                                                      - the droplet field,
                                                                      - the fragment field.
                                                                           The mass transfers between the fuel droplet and
                                                                      fragment fields are modeled in MC3D according to the two
                                                                      fine fragmentation mechanisms already described above. It
                                                                      is then possible to simulate a steam explosion as a whole,
                                                                      from the escalation phase to the explosion propagation
                                                                      phase.

                                                                          VI. MC3D CALCULATIONS OF KROTOS KFC
                                                                              TEST
    Fig. 10. KROTOS-KFC. Void volume in the X-ray                         The results presented in this section have been
    window vs. time                                                   obtained using 3.6.8 version of MC3D.

    V. MC3D COMPUTER CODE5, 8, 9, 12                                       VI.A. Experiment description, meshing
                                                                           The KROTOS facility is modeled with a 2D axi-
     MC3D is an eulerian thermal-hydraulics software                  symmetrical grid (31x76 meshes). The meshing describes
developed by IRSN. It is devoted to the study of 3D                   the whole vessel (internal diameter 0.356m), the test
multiphase and multi-constituent flows. MC3D is written               section being modeled by plates as shown in thick lines in
in a modular way, proposing two different applications: the           Fig. 11.
pre-mixing application and the explosion application. A

                                                               1859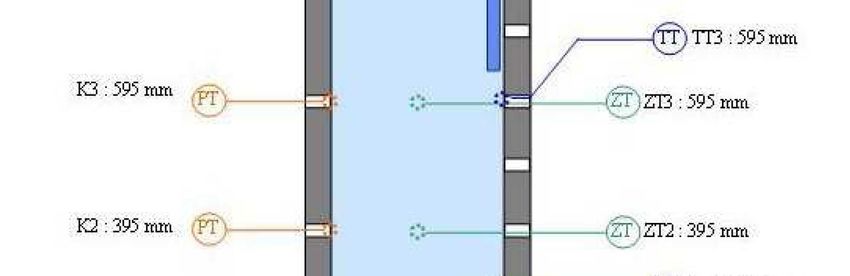
Proceedings of ICAPP ‘12
                                                                                                       Chicago, USA, June 24-28, 2012
                                                                                                                         Paper 12143

                                                                        gave a smooth pressure wave (up to 10 MPa) propagating
                                                                        from the bottom to the top of the test section (see Fig. 14).

                                                                            Fig. 12. MC3D computation of KROTOS KFC
                                                                            premixing. Jet front progression.
    Fig. 11. Axi-symmetrical meshing of the KROTOS
    test vessel. Axis is on the left side.                                   Another way is, instead of describing the crucible, to
                                                                        describe the corium flow out of the crucible as a source
     This meshing is refined around the axis in order to                term, setting the flow rates and velocities as measured in
better describe the corium jet. In the experiment, the gas              the experiment. This is only possible for a simple corium
present in the tank above the water level is Helium. This               flow, as for instance, a well-defined coherent jet. This is
gas specie is not available in MC3D, our calculation uses               not the case for KROTOS KFC test. Describing the spray
Argon.                                                                  and the several velocities of droplets and the following jet
                                                                        is very difficult if not impossible.
    The corium physical properties used in the
calculations correspond to the selected experimental                         This led us to propose an original alternative approach
mixture: 70 w% of UO2 and 30w% of ZrO2:                                 in which all the premixing features are extracted from the
    Solidus temperature    2813 K                                       experimental X-Ray pictures using the KIWI software.
    Liquidus temperature   2833 K                                       These features are transferred to the MC3D input deck for
    Surface tension        0.45 N.m                                     a direct simulation of the explosion.
    Dynamic viscosity      3.489 10-3 Pa.s
    Conductivity           2.322 W/m/K                                       VI.C. Direct explosion calculation using premixing
                                                                                  extracted from experimental X-ray pictures
     VI.B. Computation of the premixing
                                                                              To define the premixing state for a direct explosion
     As already explained, due to the absence of the fusible            calculation, MC3D needs for each cell of the test section
tin disc between the puncher and the release cone, the                  and for each phase (corium droplets, water and steam):
injection of the molten corium observed in KROTOS KFC                   - the volume fraction,
test (a spray composed of droplets with different high                  - the Sauter average diameter,
velocities rapidly decreasing, followed by a small                      - the temperature.
continuous jet) is complicated.                                               One pressure per cell is also needed.
     One possibility is to describe the crucible in MC3D                      The X-ray window is only 310 mm high. It doesn’t
dataset and let the code compute the corium flow down to                represent all the test section. We then need to extrapolate
the water. The non-zero velocity of the crucible at the                 the configuration observed in the X-ray window to the
impact with puncher makes its description difficult, and the            remaining part of the test section. In this section we will
unknown initial velocity of the melt ejected from its                   first describe the methods used to extract the needed data
bottom makes its description even more difficult. We tried              from a given frame of the radioscopy film and in a second
to check different initial velocities of melt, but none gave a          part, we present the extrapolation of the X-ray window
satisfactory melt progression (Fig. 12) and none could                  data to the remaining part of the test tube.
model the observed droplet spray followed by the jet.
     An explosion calculation was performed using the                       VI.C.1. Extraction of the data from an X-ray picture
premixing computed with the initial melt velocity, 1 m/s,
leading to the best jet front propagation. This calculation                 The X-ray radioscopy system films the attenuation of
                                                                        the X-ray beam as it passes through the test section and the
                                                                        premixture. The images then represent a projection of the

                                                                 1860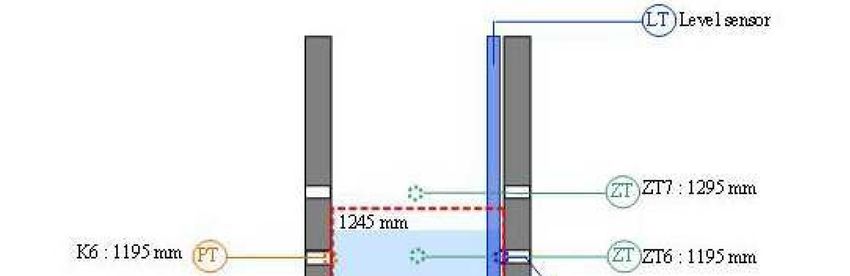
Proceedings of ICAPP ‘12
                                                                                                        Chicago, USA, June 24-28, 2012
                                                                                                                          Paper 12143

mixture perpendicularly to the X-ray beam and the                                   Vd                               Vd
extracted volumes and corium droplet positions and                           ad =             and          Dsd = 6
                                                                                    V                                Sd
diameters are defined on this projection.
     The MC3D description of the test section is set using               V being the volume of the cell.
an axi-symmetrical grid. The values extracted from the X-
ray images need then to be reconstructed from the                             VI.C.2. Extrapolation to the whole test section
projection description to the meshed axi-symmetrical one.                      The X-ray radioscopy window only captures the
     The redistribution algorithm independently considers                upper part of the test section. The last picture before the
horizontal mesh slices, starting from the top of the window.             explosion is assumed to represent the premixing state at the
A common process (for a slice) is illustrated in the Fig. 13.            explosion triggering time and is directly used to describe
At the very first step, the void volume in the axi-symmetric             the top of the test section.
cells is averaged: the first cell on the left with the last one               The description of the other parts below the X-ray
on the right, the second on the left with penultimate on the             window is based, as a first approach, on a global
right etc. In such a way, the void distribution is forced to             convection movement with a velocity equal to the average
be plane symmetric. This is shown in the Fig. 13 I step.                 corium droplet convection velocity determined above and
Next, following the condition of the axial symmetry, we                  equal to 2.2 m/s. This approach assumes that all the
assume that the void fraction measured in the most left cell             droplets have the same velocity, this velocity remains
is the same all around the test section. To do this, the void            constant as the droplets flow down to the test section and
fraction in the following cells is redistributed between the             there is no droplet fragmentation. It also assumes that the
corresponding rim part and remaining part of the cell. It is             steam is linked to the droplets and follows them downward
shown in the Fig. 13 II step. This procedure is repeated                 and that there is no important increase or decrease of the
again, but now the second cell is taken as the most left one.            global steam volume.
The void fraction in it is already decreased due to the                       The top part of the X-ray window being above the
previous step. The algorithm is repeated again and again                 water level, only the bottom part is used in this approach to
until all cells and slices are processed.                                be translated downward. Considering the 2.2 m/s velocity,
                                                                         the droplets are convected through a distance of 4 cm
                                                                         between two X-ray film frames (which frequency is
                                                                         55 Hz).
                                                                              The test section below the X-ray window is then
                                                                         described from top to bottom by 140 mm height parts
                                                                         using 1 film frame out of 3 or 4 frames, starting from the
                                                                         last picture before the explosion. For each part, the volume
                                                                         fractions of melt and steam as well as the droplet diameters
                                                                         are evaluated for each MC3D cell using the method
                                                                         presented in the previous section.
                         …                                                    The pressure in the dataset is set equal to the pressure
                                                                         measured in the test vessel at the end of premixing,
                                                                         4.14 bar. The temperatures are set equal to a single value in
                                                                         the whole test section. The water temperature is set equal
    Fig. 13. Redistribution of the void from the X-ray                   to the average temperature measured at the triggering time,
    projection to the MC3D axi-symmetric description                     318 K. The corium droplet temperature is set equal to the
                                                                         corium temperature measured when the crucible was
      For the corium phase, the redistribution method is a               released, 2936 K. The water saturation temperature is used
little bit different. KIWI outputs, for each droplet, the                for the steam temperature.
coordinates of its center and its estimated volume,
interfacial area and Sauter diameter. The first step consists                 VI.C.3. Results
in making the melt distribution symmetric and in checking
                                                                              The direct explosion calculation of KROTOS KFC
which cell contains which droplet. The volume of each
                                                                         test was run rapidly, in less than 1 hour CPU to compute
droplet is then distributed on all the cells that contain this
                                                                         10 ms physical of explosion, in spite of the complexity of
droplet. In order to be able to calculate the droplet Sauter
                                                                         the input deck describing the premixing state at the
diameters in each cell, the interfacial areas are also
                                                                         triggering time.
distributed. If a cell contains several droplets, the volumes
                                                                              The pressures on the test section wall at the transducer
and the areas are added up. Once all the droplets are taken
                                                                         elevations are compared to the experimental measurements
into account, the volume fractions and Sauter diameters of
                                                                         in Fig. 14. A pressure peak can be seen at the top of the
corium are computed in each cell,
                                                                         test section where the previous complete MC3D

                                                                  1861
Proceedings of ICAPP ‘12
                                                                                                   Chicago, USA, June 24-28, 2012
                                                                                                                     Paper 12143

calculation, described in paragraph VI.B, only gave a                trigger and the linked pressure wave propagation can be
smooth pressure wave with a magnitude lower than                     seen at the beginning. The melt droplet fragmentation can
10 MPa.                                                              be seen on the 2 ms picture, initiating the explosion. As it
     In the present computation, the pressures are of the            propagates upward, there is more fragmentation and the
same order of magnitude than the measured ones. As in the            enhancement of the pressure wave can be seen on the 3 ms
experiment, the explosion takes place between K3 and K4.             picture. After this time, the rarefaction wave going
A reinforcement of the wave is observed upward and                   downward from the water surface makes the pressure
finally the highest pressure peak is found at K5 elevation           decrease and the steam expand, even if the droplet fine
(231 bar). The highest pressure computed in the whole                fragmentation still takes place.
calculation domain reaches 454 bar. The maximum
experimental pressure, measured by K5 transducer was
equal to 323 bar, which is between these two values.
     The computed pressure peak is delayed of about 1 ms,
compared to the experimental pressure wave. In the
premixing description from the X-ray pictures, the
assumption was made that the droplets don’t slow down
while they fall down to the bottom of the test section. A
consequence of this assumption is a deeper mixing zone.
The sound velocity is lower in this mixing zone, because
of the void fraction. This can explain a slower propagation
of the trigger pressure wave and the observed delay in the
explosion occurrence at the upper part of the test section.

                                                                        t = 0 ms            t = 1 ms           t = 2 ms

                                                                        t = 3 ms            t = 4 ms           t = 5 ms
                                                                         Fig. 15. KROTOS KFC explosion propagation.
                                                                         Pictures spread in the X direction. Left side: pressure
                                                                         (colors from blue (P ≤ 0.4 MPa) to red (P ≥ 16 MPa))
                                                                         and fragment fraction (grey contour). Right side:
                                                                         volume fraction of water (blue), steam (white) and
                                                                         corium droplets (red dots).

                                                                         VII. CONCLUSION

    Fig. 14. KROTOS KFC. Pressure wave propagation                        After a recall of the phenomenology of Fuel Coolant
    vs. time for different elevations.                               Interaction (FCI) phenomena, the purpose of this paper
                                                                     was to present both experimental and simulation studies of
     The different stages of the explosion can be seen on            FCIs, in the frame of Pressurized Water Reactor (PWR)
the 2D map of the explosion, Fig. 15. The picture at 0 ms            severe accident analysis. The experimental part of this
represents the initial state, as defined from the X-ray              paper relied on the CEA KROTOS experimental facility
picture analysis. The expansion of the gas bubble from the

                                                              1862
Proceedings of ICAPP ‘12
                                                                                                     Chicago, USA, June 24-28, 2012
                                                                                                                       Paper 12143

that is devoted to the assessment of the different processes                Accident     Research     (ERMSAR-2005),      Aix-en-
occurring during a FCI in a PWR, after the core meltdown                    Provence, France, November 14-16, 2005, session 3,
and the formation of hot corium.                                            paper 1 (2005).
     After a description of the facility and of the                   3.    I. HUHTINIEMI and D. MAGALLON "Insight into
experimental procedure adopted during a KROTOS test,                        steam explosions with corium melts in KROTOS"
we exposed the experimental results for the KROTOS-                         Nuclear Engineering and Design, 204, 1-3, 391-400,
KFC (scoping) test which results are fully open. Focus was                  (2001)
made on the X-ray radioscopy system devoted to                        4.    J.M. BONNET et al. "KROTOS FCI experimental
characterize the premixing in the test section and on the                   programme at CEA Cadarache: new features and
KIWI software. This software was developed at CEA-                          status", proc. The 11th International Topical Meeting
Cadarache to extract quantitative data from the X-ray                       on Nuclear Reactor Thermal-Hydraulics (NURETH-
pictures, such as the volume fraction of steam and, for the                 11), Avignon, France, October 2-6, 2005, paper 242
corium phase, the volume, the Sauter diameter and the                 5.    R. MEIGNEN "Status of the qualification of the
velocity of each droplet.                                                   multiphase flow code MC3D", proc. Int. Congress on
     The second part of this paper presented the                            Advances in Nuclear Power Plants (ICAPP'05), Seoul,
methodology and the assumptions done to use these                           Korea, May 15-19, 2005, American Nuclear Society
quantitative data extracted from the X-ray radioscopy                       (2005)
pictures as input in an MC3D dataset and perform a direct             6.    M.L. CORRADINI, B.J. KIM, M.D. OH "Vapor
explosion calculation of the KROTOS KFC test. The                           explosions in Light Water Reactors: a review of theory
agreement between the experimental and calculation                          and modeling", Progress in Nuclear Energy, 22, 1, 1-
results was rather satisfactory and the main difference, a                  177 (1988)
time delay of the occurrence of the explosion, is probably            7.    M. LESKOVAR and M. URSIC "Estimation of ex-
due to one of the assumptions made on the droplet                           vessel steam explosion pressure loads", Nuclear
velocities.                                                                 Engineering and Design, 239, 11, 2444-2458 (2009)
     A way of improvement may consist in modifying these              8.    R. MEIGNEN "MC3D Version 3.6 - Description of
assumptions by taking into account the different initial                    the physical models of the PREMIXING application",
velocities of the droplets and the friction on the droplets                 Technical Report IRSN/DSR/SAGR/09-67, Institut de
leading to decrease these velocities.                                       Radioprotection et de Sûreté Nucléaire (2009)
                                                                      9.    C. BRAYER, G. BERTHOUD "Vapor explosion
          ACKNOWLEDGMENTS                                                   modeling with MC3D", proc. 5th International
                                                                            Conference on Nuclear Engineering (ICONE5), Nice,
     The authors are very grateful to Jean-Michel Bonnet
                                                                            France, May 26-30, 1997, American Society of
and Daniel Magallon for their involvement in the
                                                                            Mechanical Engineers (1997)
KROTOS program and their assistance for the KROTOS
                                                                      10.   G. BERTHOUD “Vapor explosion”, Annual Revue of
test realization and analysis.
                                                                            Fluid Mechanics, 32, 573-611 (2000)
                                                                      11.   M. ZABIEGO et al. "The KROTOS KFC and
          NOMENCLATURE
                                                                            SERENA/KS1 tests: experimental results and MC3D
     a     volume fraction                                                  calculations", proc. 7th International Conference on
     V     volume                                                           Multiphase Flow (ICMF 2010), Tampa, FL, USA,
     Ds    Sauter diameter                                                  May 30-June 4, 2010,
     P     pressure                                                   12.   R. MEIGNEN, G. RATEL, G. BERTHOUD, S.
     S     interfacial area                                                 PICCHI "MC3D V3.5 – description of the physical
                                                                            models of the EXPLOSION application", Technical
     Subscripts :                                                           Report IRSN/DSR/SAGR/05-67, Institut de Radio-
     d    droplets                                                          protection et de Sûreté Nucléaire (2005)
                                                                      13.   R. MEIGNEN, G. BERTHOUD "Fragmentation of
          REFERENCES                                                        molten fuel jets", proc. International Seminar on
                                                                            Vapor Explosion and Explosive Eruptions, Sendaï,
1.   D. MAGALLON "Status and prospects of resolution                        Japan, May 1997, p. 83
     of the vapour explosion issue in Light Water Reactors"
     Nuclear Engineering And Technology, 41, 5, 603-616
     (2009)
2.   D. MAGALLON et al. "Results of phase 1 of OECD
     programme SERENA on fuel-coolant interaction",
     proc. 1st European Review Meeting on Severe

                                                               1863
You can also read