Exergy and Economic Analysis of Energy Consumption in the Residential Sector of the Qassim Region in the Kingdom of Saudi Arabia - MDPI
←
→
Page content transcription
If your browser does not render page correctly, please read the page content below
Article

Exergy and Economic Analysis of Energy
Consumption in the Residential Sector of
the Qassim Region in the Kingdom of Saudi Arabia
Radwan A. Almasri 1,*, A. F. Almarshoud 2, Hanafy M. Omar 1, Khaled Khodary Esmaeil 3
and Mohammed Alshitawi 1
 1 Mechanical Engineering Department, College of Engineering, Qassim University, 51452 Buriadah P.O. Box 6677,
   Saudi Arabia; hanafy@qec.edu.sa (H.M.O.), alshitawi@qec.edu.sa (M.A.)
 2 Electrical Engineering Department, College of Engineering, Qassim University, 51452 Buriadah P.O. Box 6677,

   Saudi Arabia; dr_almarshoud@qec.edu.sa
 3 Mechanical Power Engineering Department, College of Engineering, Tanta University, Tanta 31527, Egypt;

   khaledkhodary@yahoo.com
 * Correspondence: masri.radwan@qec.edu.sa
 Received: 23 February 2020; Accepted: 23 March 2020; Published: 25 March 2020

 Abstract: The Kingdom of Saudi Arabia (KSA) is considered one of the countries with the highest
 consumption of electric energy per capita. Moreover, during the period of 2007–2017, the
 consumption rate increased from 6.9 MWh to 9.6 MWh. On the other hand, the share of residential
 electricity consumption in the KSA constitutes the biggest portion of the total electric consumption,
 which was about 48% in 2017. The objectives of this work were to analyze the exergy and assess the
 economic and environmental impacts of energy consumption in the residential sector of the Qassim
 region to determine potential areas for energy rationalization. The consumption patterns of 100
 surveyed dwellings were analyzed to establish energy consumption indicators and conduct exergy
 analysis. The performances of different consuming domestic items were also examined, and energy
 efficiency measures are proposed. The average yearly consumption per dwelling was determined,
 and the total energy and exergy efficiencies are 145% and 11.38%, respectively. The average shares
 of lighting, domestic appliances, water heaters, and air conditioning from the total yearly energy
 consumption were determined.

 Keywords: energy consumption; exergy analysis; residential building; reference environment,
 Ownership level; Kingdom of Saudi Arabia (KSA)

1. Introduction
      Energy is a source of life and development in any country. At the same time, energy
consumption leads to environmental and health damage, as well as depletion of the economy if the
consumption process is inefficient. It is therefore essential to ensure adequate energy and efficient
consumption. The Kingdom of Saudi Arabia (KSA) is the world’s largest oil producer, contributing
13.2% of the total global production, and is the largest oil exporter, totaling 18.7% of the global exports
[1]. In 2017, in the KSA, the total primary energy supply was 211.32 Mtoe, while the total final
consumption was 140.71 Mtoe; this means that the energy system efficiency was about 67% in this
year. Table 1 shows the distribution of the final energy and the share of energy consumption in the
KSA in 2017. From the table, it can be observed that 10% of the final energy was consumed in the
residential sector. It should be noted here that the fuel consumed in the industry sector was not all
burned, and part of it (about 20% of the total) was used in the chemical industry. Furthermore, in
2017, the fuel consumption for electricity production was divided into natural gas (53.7%) and oil
Sustainability 2020, 12, 2606; doi:10.3390/su12072606                       www.mdpi.com/journal/sustainability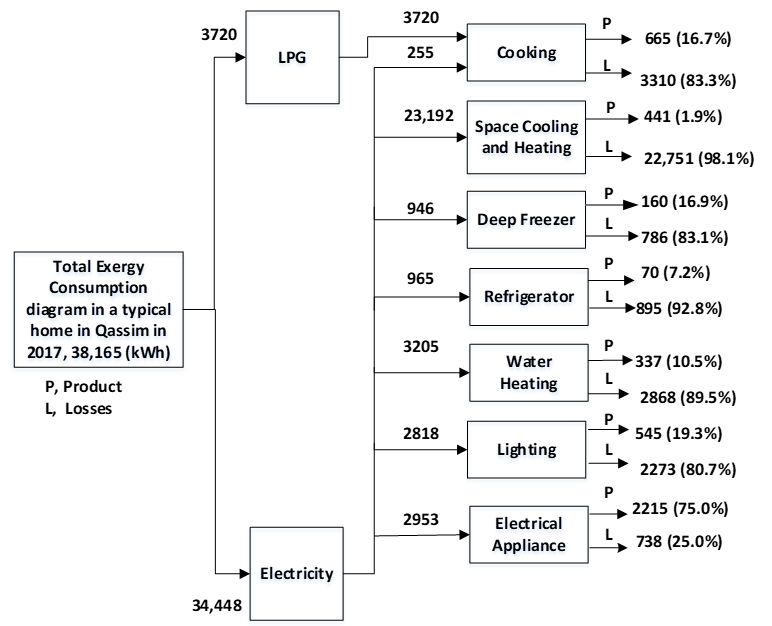
Sustainability 2020, 12, 2606                                                                                   2 of 19

(46.3%) [2]. In 2016, the KSA issued the “Vision 2030 of Kingdom of Saudi Arabia,” which launched
both an outline for national energy policy and a set of objectives for energy efficiency, for
improvement of renewable energy sources, and waste-to-energy opportunities [2]. Another
important factor to consider is that energy use generates around 532.2 Mton of CO2 per year [3], which
is set to increase. Indeed, an increase from 6.9 to 9.6 MWh in electrical energy consumption per capita
in the KSA was observed from 2007 to 2017, respectively, with an increase of 39.1% for the decade.
Such growth needs an active expansion of infrastructure.

      Table 1. Distribution of final energy and share of energy consumption in the Kingdom of Saudi Arabia
      (KSA) [3].

                                                                 End-Use Consumption
                                Sector                                                           Percentage (%)
                                                                 (Mtoe)       (TWh)
                       Transportation                              42.2      490.786                    30
       Industry (such as fuel, 34%, and material, 20%)             76.0       883.880                    54
                         Residential                              14.0       162.820                    10
                           Other                                   8.4         97.692                    6
                            Total                                 140.6      1635.178                   100

      Table 2 shows the total electrical energy sold in 2017 in the KSA. It is clear from Table 2 that the
residential sector consumed 48.1%, while the other sectors consumed the remaining 51.8% of the total
electrical energy produced [2]. The electricity used to operate all air conditioning systems, appliances,
lighting, and warm water represents 87.30% of the total energy consumed. The remaining 12.70%
was obtained from liquefied petroleum gas (LPG), which was used only for cooking [4].Table 3
illustrates that residential energy consumption mainly relies on electricity. In 2014, the electricity
consumption reached a maximum value of 88.5% of the total energy used in the residential sector.

                        Table 2. Customers’ numbers and electrical energy sold in the KSA [2].

                                         Number of Customers                       Electrical Energy Sales
         Category
                                                                                 (TWh)                   (%)
       Residential                            7,103,515                          143.473                 48.1
       Commercial                             1,569,923                           48.349                 16.2
       Government                              272,713                            38.666                 13.0
        Industrial                              10,783                            54.863                 18.4
          Other                                112,579                            13.089                  4.3
          Total                               8,607,000                          296.673                100.0

      Table 3. Percentage of electricity consumption in the residential sector from the total energy
      consumption during the period of 1990 to 2017 in the KSA [4].

           Year                   1990      1995      2000      2005      2010        2014       2016         2017
      Percentage (%)              72.7      76.8      79.6      81.9      85.2        88.5       87.4         87.3

     The residential sector has many weaknesses and deficits, such as unfit use of electrical
appliances, poor insulation of homes, and citizens being unaware of energy efficiency. This work will
help in creating a way to remove inefficient methods/equipment from the residential sector as, at
present, in the case of the KSA, there are a limited number of such studies for this sector [5]. Hence,
in order to efficiently implement methods/techniques to achieve energy utilization, it is imperative
to carry out economic and environmental analysis, along with energy and exergy analysis. With the
fast development and demand for housing in the KSA, it becomes necessary to study not just the
energy consumption, but also the exergy analysis so as to improve and sustain energy efficiency in
the residential sector. The KSA will increase by about two million homes by 2020, as reported by
Alrashed and Asif [6]; in the Qassim region alone, the number of occupied dwellings was 272,078 in
2017 [4].
Sustainability 2020, 12, 2606 3 of 19
As mentioned above, electrical energy in buildings is primarily consumed for air conditioning,
heating water, lighting, and running appliances in the KSA. As per the Saudi Energy Efficiency
Center’s (SEEC) study, almost 70% of buildings require proper thermal insulation, while an average
of 64% of buildings are estimated as uninsulated by Esmaeil et al. [7]. We adapted the same change
of overall heat transfer coefficient from Uo = 1.8 W/m2 K (the previously established coefficient) to Un
= 0.35 W/m2 K (a new coefficient). This study aims to encourage energy policy-makers to realize
energy-efficient appliances, as well as to develop an efficient residential sector that has less of an
impact on the developmental cost for the nation and the environment. The objectives of this work are
as follows:
Study the energy and exergy analysis of various electrical appliances of households;
Study the exergy analysis of the residential sector in the Qassim region;
Assess the economic and environmental impacts of energy consumption in the residential sector
in the Qassim region.
2. Literature Review
The basis of energy analysis to study and evaluate the performance and efficiency of a system
or a process relies on the first law of thermodynamics. In contrast, exergy analysis is built on the
second law of thermodynamics, and it measures the types of losses in the processes and systems.
Exergy can be defined as “Exergy (also called availability), which is the maximum useful work that
could be obtained from the system at a given state in a specified environment” [8].
As exergy analysis is used for determining energy losses in machines or systems, this method of
analysis could help to identify various losses, as well as the types of losses, in the residential sector.
The results of such analysis could help to improve inefficiencies and reduce losses. Little work has
been reported with reference to the KSA in which exergy, economic, and environmental assessments
have been carried out for the residential sector. According to the authors’ knowledge, no work has
focused on exergy analysis specifically of the Qassim region. Thus, the present study could help to
reduce the unnecessary usage of residential energy and to raise the awareness of the public about
energy consumptions within this region.
The first major energy and exergy analysis for the United States was performed by Reistad [9].
In his study, he examined the consumption sector for oil refining, electricity generation, and
distribution separately. Furthermore, the end-use of energy was split into three sectors—
residential/commercial, industrial, and transportation. Dincer [10] presented the role of exergy in
energy policy making; he reported that it is apparent that no single precise production exergy value
can be established for each type of fuel. Despite these problems, values for production exergy are
needed to carry out an appropriate overall system exergy analysis to enhance the understanding of
environmental, economic, and energy issues. Hepbasli [11] reviewed low exergy heating and cooling
systems for buildings and societies and found that the exergy efficiency values range from 0.40% to
25.3%. Dincer et al. [12] presented an analysis of sectoral energy and exergy utilization of the KSA
between 1990 and 2001. Based on their analysis, it can be concluded that the residential sector is more
efficient with respect to energy, while the industrial sector is most exergy efficient. Al-Ghandoor [13]
also analyzed the energy and exergy utilization, but for Jordan’s economy in the main sectors. In his
calculation for the main sectors, namely, residential, industrial, and transportation, he showed that
the energy efficiencies are 68.3%, 78.3%, and 22.7%, respectively, and the corresponding exergy
efficiencies are 9.5%, 37.9%, and 22.7%. The weighted total energy and exergy efficiencies in the
residential sector for various countries and periods are presented in Table 4.Sustainability 2020, 12, 2606 4 of 19
Table 4. Total energy and exergy efficiencies in the residential sector for various countries.
Year of Collect Overall Energy Overall Exergy
Reference Countries
Data Efficiency (%) Efficiency (%)
Ertesvåg [14] 1970 USA 81.0 14.0
Ertesvåg [14] 1986 Canada 81.0 15.0
Ertesvåg [14] 1990 World 71.0 5.0
Badmus and
1991–2005 Nigerian 19.89 4.38
Osunleke [15]
Ílerı́ and Gürer [16] 1995 Turkey* 55.0 6.0
Utlu and Hepbasli
2000 Turkey* 55.60 8.02
[17]
Utlu and Hepbasli
2002 Turkey* 55.58 9.33
[18]
Dincer et al. [12] 2004 KSA 75.0 9.0
Saidur et al. [19] 1997-2004 Malaysia 69.4 28.4
Kondo [20] 1990–2005 Japan 62.35 6.3
Liu et al. [21] 2002–2011 China 70.30 12.2
Al-Ghandoor et al.
2006 Jordan 66.6 15.4
[22]
Abam et al. [23] 2006–2011 Nigerian 20.19 4.4
Al-Ghandoor [24] 2010 Jordan 68.3 9.5
Armel et al. [25] 2001–2010 Cameroon 58.74 22.63
* Residential and commercial sector.
Badmus and Osunleke [15] studied the overall energy and exergy analyses for the whole
Nigerian residential sector in 1991–2005. They found that the overall utilization energy efficiency was
19.89%, and the exergy efficiency was 4.38%. Abam et al. [23] analyzed the end-use energy and the
total energy and exergy efficiencies of the residential buildings of Nigeria. The main conclusions were
that the mean energy and exergy values for electricity use were 42.76% and 13.77%, respectively, and
for fossil fuel, and the mean energy and exergy efficiencies were 62.63% and 13.46%, respectively, in
the period of 2006–2011. Armel et al. [25] determined the total energy and exergy efficiencies of the
residential sector in Cameroon from 2001 to 2010 using a survey of 250 households. They determined
that the energy and exergy efficiencies were 58.74% and 22.63%, respectively. Saidur et al. [19]
analyzed the energy and exergy utilization in the residential sector in Malaysia from 1997 to 2004.
The overall energy and exergy efficiencies for all devices used were 70% and 28%, respectively.
Kondo [20] studied the energy and exergy efficiencies in Japan’s residential and commercial sectors
from 1990 to 2006. He found that the Japanese residential and commercial sectors had great potential
for energy savings. Liu et al. [21] reported that the exergy efficiency was 11–12.2% for the urban
residential sector in China during the period of 2002–2011, while the energy efficiency was 62.8–
70.2%. The exergy efficiency of air conditioning was deepest by 6%, and thus, the authors emphasized
that energy-saving strategies should pay much more attention to the enhancement of exergy
efficiencies. Al-Ghandoor et al. [22] presented energy and exergy analyses of the Jordanian urban
residential sector by considering the streams of energy and exergy in Jordanian homes. They used a
survey involving 200 households, and energy consumption data were collected. Their results indicate
that the exergy analysis was less efficient than the energy analysis.
Utlu and Hepbasli [17] analyzed the energy and exergy efficiencies of the Turkish residential–
commercial sector (TRCS), and in another work [18], they presented a study to estimate the energy
and exergy efficiencies for the whole TRCS. They reported that the energy and exergy efficiency
values for the TRCS are 55.58% and 9.33%, respectively. Utlu and Hepbasli [26] also conducted an
extensive study to found the effect of energy and exergy utilization efficiencies in the TRCS in the
year 2003. They found that the energy efficiency values for this sector were between 51.95–80.82%
and the exergy efficiency values were 8.11–11.92%. Jansen et al. [27] proposed various concepts to
improve the exergy efficiency of multi-family buildings from the 1960s in Bilbao, Spain, for differentSustainability 2020, 12, 2606 5 of 19
cases. They reported that the overall energy efficiency values of the reference cases and new cases are
50% and 70%, while the exergy efficiency values are 10% and 16%, respectively.
The reference state must be determined for exergy analysis, which is usually the ambient
conditions of the processes or the thermodynamics systems. It can be selected either as a variable
environment state or as a constant environment state (see Table 5) In the first case (group I), as the
state conditions change, with time or place, the outcomes are unique. Meanwhile, in the second case
(group II), due to the constant environment, outcomes are not unique with respect to time or place.
It is noted from Table 5 that most studies adopted the constant conditions in the processes of exergy
analyses in the housing sector, which is more realistic for comparison. Likewise, it should be noted
that the constant reference state was also adopted in this study.
Table 5. Reference environment.
Type of Reference Temperature Pressure
Reference Country/Process
State (°C) (kPa)
Dincer et al. [12] KSA constant 10 101.3
Al-Ghandoor et al.
Jordan constant 25 101.3
[22]
Al-Ghandoor [13] Jordan constant 25 101.3
Armel et al. [25] Cameroon constant 25 -
Badmus [15] Nigeria constant 25 100
Liu et al. [21] China variable 0, 20, 35 101.3
Abam et al. [23] Nigeria constant 27 100
Saidur et al. [19] Malaysia constant 27 100
Al-Ghandoor et al.
Jordan constant 25 101.325
[24]
Liu et al. [28] Cooking constant 25 101.325
Kazanci et al. [29] Cooling constant 30 -
Han et al. [30] Air conditioning constant 20, 25 101.325
Absorption
Gunhan et al. [31] variable From 30 to 42 101.325
cooling
3. Methodology
After outlining the indicators considered in this work, a new and improved survey was
developed based on the previous work of Esmaeil et al. [7]. This new survey is separated into five
parts:
Part I collects universal data on homes;
Part II gathers data on household appliances—there are requests about the number, power, and
the time of use of each household appliance;
Part III gathers data on air conditioners;
Part IV includes a table to obtain the daily electrical energy consumption of the dwelling;
Part V focuses on gas consumption.
The survey was carried out with the assistance of students from the engineering and
architectural colleges at Qassim University. More than 150 students agreed to complete a
questionnaire in their homes and the homes of their relatives. To certify the quality of the data in the
survey, the students were given instructions to explain how to collect the required data appropriately.
After completing the survey, a discussion was held with every student to confirm the accuracy of the
collected data. The survey was conducted in 2017 in Arabic; an English translation is given in
Appendix A. The two most common types of houses in the Qassim area were considered—namely,
villas and flats.
One hundred surveys for dwellings were obtained. In summary, all of the surveys provided
complete answers for Parts I–III and V, but for part IV, only about 30 surveys were collected.Sustainability 2020, 12, 2606 6 of 19
Furthermore, with the permission of the occupants, monthly electricity consumption data for 54
houses were collected for the period from 2015 to 2018.
3.1. Meteorological Conditions
According to climate classification system by Köppen–Geiger, the KSA, which is located
between the latitude lines 32°N and 17°N and between the longitude lines 56°E and 28°E, is
categorized as a hot and arid climate area. Meanwhile, the Qassim region is situated at the center of
the kingdom between the latitude lines of 25.5°N and 27.12°N and the longitude lines of 41.6°E and
44.06°E. As the climatic conditions of the region of interest play an important role in energy
consumption, temperature variation data were collected from a climate monitoring station at Qassim
university for the years 2015–2018, which were then analyzed. Figure 1 shows the monthly maximum,
average, and minimum temperatures in the Qassim region during 2015–2018.
Figure 1. The monthly maximum, average, and minimum temperatures in the Qassim region during
2015–2018.
3.2. Energy and Exergy Calculation
The data from the questionnaire were used to determine the monthly electrical and thermal
energy consumption of the studied buildings in 2017, which was also compared with the average
monthly electrical energy consumption based on electricity bills for 54 houses in the Qassim region
during 2015–2018. The electrical energy consumption (E) calculation of each appliance or lighting
system and air conditioning unit was based on its rating power (RP) and operating time (OT), as per
the following equation:
E = RP × OT (1)
In this study, the efficiencies (i.e., energy, η, and exergy, ϕ) were calculated based on the
following definitions from Dincer et al. [5]:
η = (energy in product/total energy input) × 100 (2)
ϕ = (exergy in product/total exergy input) × 100 (3)
Energy consumption can be segregated under the appliance categories, such as air conditioning
and refrigeration units, lighting system, water heating, other electrical appliances, and cooking
appliances; whereas air conditioning and refrigeration systems lie in the category in which theSustainability 2020, 12, 2606 7 of 19
system’s energy efficiency is calculated based on the coefficient of performance. The energy efficiency
of each appliance was obtained from the Saudi internal market. The exergy efficiency for appliances
dependent on temperature was derived as
ϕ = η/γG |[1 − (To/Tp)]| (4)
where γG = 0.97 means the exergy grade for LPG, which is defined as the share of a gas’s chemical
exergy eG to the gas’s higher heating value HG. Chemical exergy is eG = 44,643 (kJ/kg), and the higher
heating value is HG = 46,024 (kJ/kg) for a reference environment temperature of 25 °C and a pressure
of 101.325 kPa Liu et al. [21].
The exergy efficiency of energy consumption is considered equivalent to its energy efficiency of
devices independent of temperature, such as televisions, personal computers, vacuum machines,
water pumps, exhaust blowers, etc.
In this study, to compute energy and exergy efficiencies for residential buildings, weighted
efficiencies concerning the overall efficiency of the two energy sources were used. The weighting
factor was calculated from the contributed share of each energy source to the total energy input. It
must be noted that less than 1% of total energy consumption was from kerosene and other types of
fuel [4]. Equations (5) and (6) present the overall energy and exergy efficiencies of electrical energy,
respectively:
ηe = Σ ηe,i × WFe,I (5)
ϕe = Σ ϕe,i × WFe,I (6)
where ηe,i and ϕe,i are the energy and exergy efficiencies of the ith portion of electrical energy intake,
respectively.
WFe,i is the share of electrical intake for the ith portion of electrical energy use. The total energy
and exergy efficiencies of the residential sector were calculated as
ηoverall = ηe × WFe + ηG × WFG (7)
ϕoverall = ϕe × WFe + ϕG × WFG (8)
where WFe and WFG are the share of the total electrical energy intake and the thermal energy from
LPG intake to the total energy consumption in 2017, respectively.
4. Results and Discussion
A similarity was observed in most of the results between the previous Esmaeil, et al. [7] and
current questionnaire results. There is some variation in the results, as shown in Table 6. It is noted
that the roof isolation percentage of the buildings under investigation increased from 31% to 43% in
the present work, which indicates an increasing awareness of its importance.
Table 6. Comparison between data that have highly different results.
Surveyed Indicator K. Esmaeil et al. [7] Present Work
The maximum area of the building (m2) 1640 1800
The minimum area of the building (m2) 100 92
Insulation of outer walls (%) 41.0 45.0
Insulation of roofs (%) 31.0 43.0
Average unit Area (m2) 429 582
The average number of occupants per dwelling 6.6 7.32Sustainability 2020, 12, 2606 8 of 19
4.1. Energy Consumption
The average monthly electrical energy consumption for the study period based on the electricity
bills of 54 houses in the Qassim region is plotted in Figure 2. It is observed from this figure that
Consumption in 2017 was higher than the other years (summer temperature is higher than in
other years);
The average monthly consumption was often between 1500 kWh and 4500 kWh;
Consumption was greatest in 2015 in September;
Electrical energy consumption in the summer months was more than double the consumption
in most of the other months.
Figure 2. The average monthly electrical energy consumption of the Saudi House in the Qassim region
during 2015–2018.
The analysis relied on the value of consumption, which was based on the average consumption
resulting from the electricity bills in the year 2017, as it is an average value among the values resulting
from the statistical study based on the questionnaire, which is 34,448 kWh. Table 7. includes the
ownership level, power rating, annual working times, annual electrical energy consumption, and
percentage of electrical energy consumption for each item, which was produced from the
questionnaire results. The average annual electrical energy consumption of 30,832 kWh was obtained
as a result of the information from the questionnaire for 100 households in the Qassim region in 2017.
Table 8 shows the annual electrical energy consumption per item and unit area of the building. We
note from Table 8 that the biggest consumption value was for air conditioners, as the energy
consumption was 3348.9 kWh/year, which is almost equal to the total consumption of all other
electrical items used (3392.4 kWh/year). According to electrical energy consumption data, this
consumption is relatively low compared to the values resulting from the bills obtained from the 54
dwellings (see Table 9). This may be justified, as not all equipment was taken into account, and the
operating time was not determined accurately in some homes. It should also be noted that the number
of air conditioners shown in Table 7 is the number of used air conditioners. The number of air
conditioners installed and rarely used was not taken into account. It was observed that some houses
have more than 20 air conditioners installed; it is also clear that the main consumer is air conditioners.
It should be noted that houses are typically heated by air conditioners or electric heaters. This
indicates that there is a need to focus on improving the efficiency of these devices and on improving
the thermal insulation of the elements of building casing, as well as on trying to increase people’s
awareness about the importance of more sustainable energy conservation in this area. It should be
noted from the questionnaire that the average LPG that a Saudi house consumes per year for cooking
is 300 kg, which is 3720 kWh/year.Sustainability 2020, 12, 2606 9 of 19
Table 7. Ownership level, power rating, annual working times, annual electrical energy consumption,
and electrical energy consumption percentage for each item in 2017.
Annual Annual Electrical
Power Electrical Energy
Ownership Level Working Energy
Items Rating Consumption
(Appliance/House) Times Consumption
(W) Percentage (%)
(h/year) (kWh)
AC 6.2 1835 1825 20,763 67.34
WH 4.55 1050 600 2869 9.31
lighting 48.0 18 2920 2523 8.18
DF 1.75 286 1889 946 3.07
Refrigerator 1.65 270 1938 864 2.80
TV 2.34 97 1764 399 1.29
WM 1.5 664 324 323 1.05
Water
1.08 802 271 234 0.76
pump
VM 1.08 1349 145 211 0.68
Iron 1.11 1304 112 162 0.53
Microwave 0.82 926 191 145 0.47
Oven 0.55 888 171 83 0.27
EB 3.5 41 472 67 0.22
Water
0.79 94 661 49 0.16
cooler
Computer 1.06 48 832 43 0.14
DW 0.23 253 90 5 0.02
Other 5.0 380 605 1150 3.73
Total - - - 30,832 100
AC, air conditioner; WH, water heater; DF, deep freezer; TV, television; WM, washing machine; VM,
vacuum machine; EB, exhaust blower; DW, dishwasher.
Table 8. Annual electrical energy consumption per item and unit area in 2017.
Annual Electrical Energy Consumption Annual Electrical Energy Consumption Per
Items
Per Item (kWh/item) Unit Area (kWh/m2)
AC 3348.9 35.68
WH 630.5 4.93
lighting 52.6 4.34
DF 540.6 1.63
Refrigerator 523.6 1.48
TV 170.5 0.69
WM 215.3 0.55
Water
216.7 0.40
pump
VM 195.4 0.36
Iron 145.9 0.28
Microwave 176.8 0.25
Oven 150.9 0.14
EB 19.1 0.12
Water
62.0 0.08
cooler
Computer 40.6 0.07
DW 21.7 0.01
Other 230.0 1.98
AC, air conditioner; WH, water heater; DF, deep freezer; TV, television; WM, washing machine; VM,
vacuum machine; EB, exhaust blower; DW, dishwasher.Sustainability 2020, 12, 2606 10 of 19
Table 9. Average annual electrical consumption comparison.
2015 2016 2017 2018
Average from Bills 33,865 33,877 34,448 29,155
Average from Survey - - 30,832 -
4.2. Exergy Analysis
Energy efficiency, environmental temperature To, product temperature Tp, exergy efficiency, and
share of used electrical energy for used appliances of different end uses were specified, as shown in
Table 10 the survey, lighting electrical consumption was approximately divided between
Incandescent (40%), fluorescent (30%), and LED (30%). The typical energy and exergy efficiencies for
an incandescent light is 5% and 18.5% respectively [17], while for fluorescent light is 20% and 17.5–
18.5% respectively [19]; [32], and for LED light is 27.3% and 21.8% respectively [32]. Based on these
values, the energy and exergy efficiencies for each type of lighting were determined, as shown in
Table 10. Combining the consumed energy with the energy and exergy efficiencies for each type of
lighting, the rated energy and exergy efficiencies of lighting were 16.19% and 19.34%, respectively.
For exergy analysis of the energy consumed by air conditioners, the reference temperature was taken
as previously mentioned constant 304.7 K, based on the average temperature in 2017 in the Qassim
region.
Table 10. Energy efficiency, environmental temperatures, product temperatures, exergy efficiency,
and electrical energy consumption percentage.
Energy Product Environmental Exergy Electrical Energy
Appliance Efficiency Temperatures Temperatures To Efficiency Consumption
(%) Tp (K) (K) (%) Percentage (%)
AC 200 299 304.7 1.9 67.34
WH 98 333 298.0 10.5 9.31
Lighting,
5 - - 18.5 3.10
Incandescent
Fluorescent 20 - - 18 2.41
LED 27.3 - - 21.8 2.68
DF 180 255 298.0 16.9 3.07
Refrigerator 200 278 298.0 7.2 2.80
TV 80 - - 80 1.29
WM 80 - - 80 1.05
Water pump 80 - - 80 0.76
VM 70 - - 70 0.68
Iron 98 373 298.0 20.1 0.53
Microwave 70 393 298.0 24.2 0.47
Oven 75 393 298.0 24.2 0.27
EB 80 - - 80.0 0.22
Water cooler 200 283 298.0 10.6 0.16
Computer 75 - - 75 0.14
DW 80 - - 80 0.02
Other 75 - - 75 3.73
Total 163.6 10.76 100.00
AC, air conditioner; WH, water heater; DF, deep freezer; TV, television; WM, washing machine; VM,
vacuum machine; EB, exhaust blower; DW, dishwasher.
Based on Equation (5), the total efficiency of electrical energy consumption used in this study
was 163.6% (To is constant), and we used the efficiency of LPG as 65%, although the energy
efficiencies of gas-burning were determined as ηG = 65% by Al-Ghandoor et al. [22]. Also, based on
Equation (6), the total exergy efficiency of electrical energy consumption was 10.76%, and the exergy
efficiency of LPG was obtained using Equation (4):Sustainability 2020, 12, 2606 11 of 19
ϕ = 0.65/0.97 × [1 − (298/393)] = 16.20%
The total exergy efficiencies of gas burning for cooking were determined by Utlu and Hepbasli
(2006) [18] as ϕG = 17.2%. After calculating the electrical energy and LPG consumption per home for
the Qassim region, it was found that the rate was as follows: 88.6% as electrical energy and 11.4% as
thermal energy of used LPG. For the residential sector in the Qassim region, the overall weighted
ηoverall,Q and ϕoverall,Q were calculated using Equations (7) and (8).
ηoverall,Q = 163.6 × 0.886 + 0.65 × 0.114 = 145%
ϕoverall,Q = 10.76 × 0.886 + 16.20 × 0.114 = 11.38%
There is a big difference in energy efficiency in the Qassim region, regarding the KSA between
the current study (145%) and a previous study (77.52%), which was conducted in 2004 by Dincer et
al. [5]. As for the exergy efficiency, there is an improvement in the current study by up to 12%.
As can be observed, the rate of energy consumption for air conditioning is high, so it is necessary
to look for ways to reduce this load. In addition to insulating the construction envelopes, the use of
high-efficiency devices would help to reduce the consumption for the building to become more
sustainable.
Figure 3 shows the effect of the reference temperature on the exergy efficiency. It is observed
that exergy efficiency decreases with increasing reference temperature; it is 11.38% at an ambient
temperature of 26 °C and 11.13% at a temperature of 50 °C. This indicates that the effect of the
reference temperature is generally limited in this application.
Figure 3. Effect of the average reference temperature on the exergy efficiency.
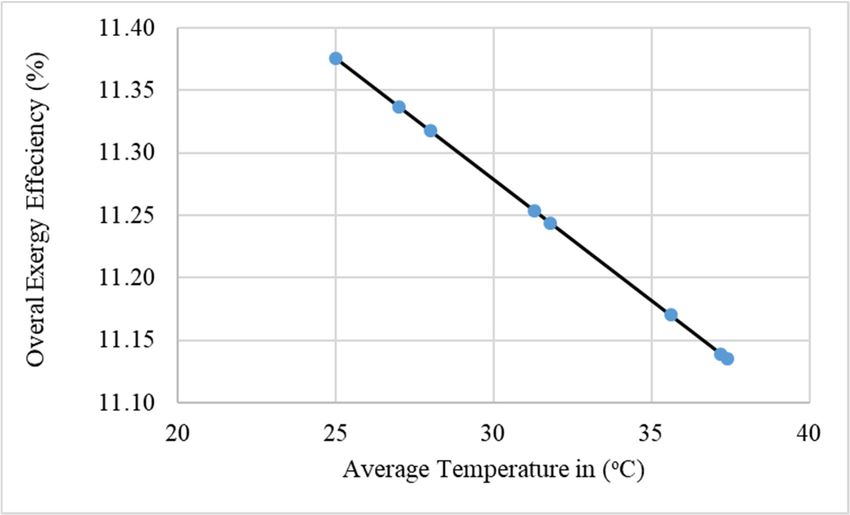
4.3. Energy and Exergy Diagrams
The energy and exergy diagrams are shown in Figure 4 and Figure 5 are very important to
illustrate the overall energy use picture. It should be taken into consideration that although these
diagrams are specifically for urban houses in the Qassim region, such diagrams can also be used for
the Qassim region or the KSA as a whole. In order to do this, the number of homes, as well as the rate
of homes in rural areas in the Qassim region or in other regions in the KSA, which usually consume
less energy than in the current urban situation, will be needed. In the KSA, the average energy
consumption per house, in general, is only about 70% of the values obtained in this study [2], givenSustainability 2020, 12, 2606 12 of 19
the conditions of the surrounding atmosphere, local behavior in different regions, and the envelope
construction of homes. It is supposed that the energy and exergy input to the homes are equal.
The following results can be drawn from the figures:
The used energy (energy transfer) in air conditioners, refrigerators, and deep freezers are higher
than energy income because it depends on the COP, which is a practical fall between 2–4. The
energy losses were not calculated in these devices, knowing that there is a loss, and this loss is
mainly related to the efficiency of the compressor.
The used energy is generally always greater than the waste, except in lighting.
The exergy losses are much larger than that used, except electrical devices independent of
temperature.
Figure 4. The energy flow diagram in a typical home in the Qassim region in 2017.Sustainability 2020, 12, 2606 13 of 19
Figure 5. The exergy flow diagram in a typical home in the Qassim region in 2017.
4.4. Economic and Environmental Analysis
First, in order to improve the overall energy system to be more sustainable in the first place,
energy consumption should be reduced. Second, loss of energy and distraction of exergy can be
reduced by making the devices and processes more efficient. On the other hand, the utilization of
renewable energy sources will help to improve environmental and economic conditions in many
applications. Here, an economic and environmental analysis was carried out of two main processes
of energy consumption in houses the Qassim region: reducing thermal load and trying to take
advantage of solar energy to heat water.
We conducted an economic analysis using the life cycle cost method (LCC), taking into account
the requirements of the Saudi Building Energy Conservation code (KSA SBC-602) [33] for estimating
the potential savings along the life cycle of a system. We considered a home with an average area of
582 m2, based on the results of the survey—consisting of two floors (17 × 17.1 m), walls with a height
of 3.25 m, a roof area of 291 m2, and surrounding walls with an area of 443.3 m2. For 2017, the annual
average total consumed energy using the bill data per home was 34,448 kWh (see Table 7). Adopting
envelope isolation for buildings would reduce the energy consumption of air conditioning by 43%,
according to Esmaeil et al. [7], in addition to an enormous reduction in greenhouse gas (GHG)
emissions. Although, the adoption of passive strategies can reduce the total energy consumption by
as much as 37% [34].
Based on the survey results, 100% of dwellings use electric water heaters. However, Kalogirou
[35] proposed a solar fraction of 79%, while Hazami et al. [36] proposed a solar fraction ranging from
50–100%. It should be noted that the solar fraction is the used solar thermal energy provided by the
solar system divided by the total energy necessary for any application. Indeed, Saudi Arabia
possesses rich solar radiation intensity from 1700–2400 kWh/m2 yearly, and based on its climate
conditions, a solar fraction of at least 70% could be recommended. Therefore, by applying this solarSustainability 2020, 12, 2606 14 of 19
fraction and considering a consumption ratio of 9.31% from the total electrical energy for domestic
heating of water (see Table 7), a yearly energy saving of 6.5% (0.7 × 9.31) of total electrical
consumption could be achieved. Furthermore, an analysis was carried out to identify the amount of
energy saving that may occur in the case of adopting solar water heating (SWH) instead of using
electric water heaters, based on the assumptions in Table 11. Also, some information was collected
from the experts of the local market—for example, the current insulation cost, the cost of
maintenance, and the life cycle of the building or SWH system. By applying the assumptions Table
11 to the represented home in the Qassim region to meet the requirements of the KSA, as per SBC-
602, and by using SWH, the calculations shown in Table 12 were obtained. As mentioned earlier the
proportion of fuel consumed to generate electricity is 53.7% from gas and 46.3% oil in 2017 [2]. By
utilizing the RETScreen program, it was determined that the amount of savings in the deployment of
CO2 would be as follows: 0.866 tCO2/MWh using oil and 0.67 tCO2/MWh using natural gas [37]. As a
result of the evaluation of the calculation process, it was found that the application of the SBC-602
leads to a payback time between 10.07 and 15.15 years, and avoids 383 tCO2 emissions during the life
cycle of the project. In contrast, the use of SWH leads to a payback time between 6.6 and 8.5 years
and savings of 43.1 tCO2 during the life of the system.
This indicates that good economic conditions could be achieved despite the lower price of the
energy unit compared to the global energy price. Also, savings can be achieved in emissions of GHG,
and therefore the buildings could be more sustainable. We should not forget the benefit of ensuring
better thermal comfort conditions for residents as well.
Table 11. Assumptions for economic analysis of applying the Saudi Building Energy Conservation
Code (SBC-602) [34] and using solar water heating (SWH) [7].
Applying the Requirements of the KSA
Using SWH
as per SBC-602
The percentage of energy consumed by
67.33 9.31
total annual energy (%)
Reduction in energy consumption or 70 of the water
43 of the total air conditioning load
solar fraction (%) heating load
The estimated life cycle of the building
50 25
or SWH system (Year)
Cost of isolation materials for walls is 8
$/m2, and 6 $/m2 for the roof.
Capital cost ($/system or home) 600
The total capital cost of isolation materials
is $5290
Annual maintenance cost ($) - 10
Salvage value of the system - neglected
Inflation rate (%) 2 2
Market discount rate (%) 6 6
Electricity tariff ($/kWh) 0.048 0.048Sustainability 2020, 12, 2606 15 of 19
Table 12. Economic and environmental analysis results of applying the Saudi Building Energy
Conservation code (SBC-602) [34] and using solar water heating (SWH).
Applying the requirements of KSA as Using
per SBC-602 SWH
Total present worth during the life cycle of the
5290 754.4
system $
Annual electrical energy saved (kWh) 9973 2245
Annual revenue of saved energy ($) 479 107.76
Total revenue of saved energy during the life
10,225 1664
cycle system ($)
The non-discounted payback time (years) 10.07 6.6
the discounted payback time (years) 15.15 8.5
Annually avoided greenhouse gas (GHG)
7.66 1.724
emissions (tCO2)
avoided GHG emissions during the life cycle
383 43.1
(tCO2)
Esmaeil et al. [7] calculated the impact of the insulation building envelopes to meet the Saudi
standards in the Qassim region. They reported a payback time value of 6.8 years based on the KSA
subsidized electricity tariff of 0.048 $ USD/kWh. In Riyadh and Dammam in the KSA, Ahmad [38]
determined a payback time of wall insulation of 2–2.7 years. It is noticed that there is a difference in
the payback time, which might be a result of price increases; for instance, in the last two years, the
cost of materials and labor have increased by more than 25% in comparison to the study provided by
Esmaeil et al. [7].
Almasri and Almarshoud [39,40] analyzed the Solar Water heater for the residential sector using
the RET Screen program at six sites in the KSA. They reported a wider perspective to include the
costs, benefits to society, and the environment, and that the feasibility of using a Solar Water heater
in the KSA can reduce electricity consumption by about 7.5%. Furthermore, their estimated payback
time for all selected sites is between 3.4–8.35 years. Thus, a good match is observed between the
current results and previous studies.
5. Conclusions and Recommendations
Energy consumption patterns of the residential buildings in the Qassim region in the KSA were
analyzed in order to determine how they could become more sustainable. Although data collected in
the Qassim Region were specifically analyzed for this study, these findings can be generalized for
other areas of the KSA and regions with similar climate conditions, building types, and lifestyles,
including other Gulf countries. The main findings can be summarized as follows:
• The total energy consumption comes from two sources: 88.6% electric energy for all use and
11.4% thermal energy from LPG for cooking.
• The annual average of total electrical energy consumed per home was between 30,832 kWh and
34,448 kWh in 2017.
• The share of each type of end-use residential energy consumption is as follows: air conditioning,
67.34%; water heaters, 9.31%; lighting, 8.18%; and other domestic appliances, 15.17%. In General,
there is a good match between the current results and the results from Esmaeil et al. [7].
• There is a big difference in energy efficiency in the Qassim region between the current study
(145%) and a previous study (77.52%) conducted in 2004 by [5]. As for the exergy efficiency,
there is an improvement in the current study by about 12%.
• It is observed that exergy efficiency decreases with increasing temperature: 11.38% at the
ambient temperature of 26 °C and 11.13% at a temperature of 50 °C. This indicates that the effect
of reference temperature is generally limited in residential buildings.
• The application of the SBC-602 results in a payback time between 10.07 and 15.15 years and in
the avoidance of 383 tCO2 emissions during the life cycle of the project.Sustainability 2020, 12, 2606 16 of 19
• Using SWH leads to a payback time of 6.6–8.5 years and saves 43.1 tCO2 during the life cycles of
the system, which coincides with the results of Almasri and Almarshoud [39,40].
• It is important to create a culture of rationalizing energy consumption and include it in school
curricula.
• Supporting renewable energy applications, especially solar energy, to reduce subsidies from
traditional energy sources is crucial.
• The level of used energy is generally always greater than the waste, except in lighting.
• The exergy losses were much larger than the used exergy except in electrical appliances.
• Improving the quality of electrical appliances that are manufactured and imported in terms of
efficiency is important in reducing energy consumption, especially that of air conditioners.
Author Contributions: R.A.A. conceived of the presented idea, planned and collect the data. A.F.A. conducted
economic and environmental analysis. H.M.O. analyzed and presented the results, K.H.E. and M.S. writing and
analyzing the manuscript to the final version.
Funding: This research was funded by Qassim University, represented by the Deanship of Scientific Research,
grant number (2051).
Acknowledgments: The authors gratefully acknowledge Qassim University, represented by the Deanship of
Scientific Research, on the material support for this research under the number (2051) during the academic year
1437 AH/ 2017 AD.
Conflicts of Interest: The authors declare no conflicts of interest.
Abbreviations
AC Air conditioner
DF Deep freezer
DW Dishwasher
EB Exhaust Blower
GHG Greenhouse gas
IEA International Energy Agency
KSA Kingdom of Saudi Arabia
LCC life cycle cost
LPG Liquefied petroleum gas
Q Qassim region
SAMA Saudi Arabian Monetary Authority
SBC Saudi Building Energy Conservation
SEC Saudi Electricity Company
SEEC Saudi Energy Efficiency Center
SWH Solar water heating
TV Television
VM Vacuum machine
WH Water heater
WM Washing machineSustainability 2020, 12, 2606 17 of 19
Appendix A. Energy Consumption Evaluation Survey in Existing Buildings
Please complete the Survey form with requisite data; however, if you are not sure about the
answer to any of the items, please leave it blank and do not answer it.
Part I: General Data.
Villa How Many Floors does the Building Have?
Building type Flat
On which Floor of the Dwelling?
Other
Ownership owner renter
Year of Construction
City Area of the occupied building ____ m2
Age of the occupants less than 11- 21- 31- 71– more
41–50 51–60 61–70
(years) 10 20 30 40 80 than 80
No. of occupants
Insulation of outer walls Insulated with ________________ Not insulated
Insulation of roof Insulated with ________________ Not insulated
Insulation of ground Insulated with ________________ Not insulated
Glass Single glass Double glass
Outer Windows
Frame Aluminum Iron PVC Wooden
Water heating method Electricity Diesel Gas Solar
Insulation of water heating
Insulated Not insulated
tank
Time of occupation Full time Part-time (details: _________________)
Part II: Electricity Consuming Articles Information
Power Rating Ownership Daily Working Times
Consuming Item Model Notes
(kW) level (h/day)
Washer
Refrigerator
Freezing
Water Cooler
Electric oven
Water heater
Microwave
TV
Computer
Vacuum cleaner
Iron
Water pump
Filter
Blower
Incandescent
Lighting devices in Fluorescent
the home Efficient
light
Others Items
Part III: Air conditioning electrical consumption
Type of Air Conditioner: Split or Daily Working Times (h/day)
Power
Window or Evaporative Cooler In Very Hot In Hot In Moderate In Cold
(kW)
(Sahrawy) Months Months Months Months
1
2
3Sustainability 2020, 12, 2606 18 of 19
Part IV: Daily electrical energy consumption of the housing
Day date
Timing 1 3 5 7 9 11 13 15 17 19 21 23
meter reading
Part V: Gas consumption
Explain the Method used for An average Number of Small Gas ______ Cylinder
Cooking Cylinders per Month:
The number of times per
The volume of the large gas tanks used
Electricity Gas year ______
______ liters
References
1. OECD/IEA. Key Words Energy Statistics. Available online: http://www.iea.org/statistics/ (accessed on 12
June 2016).
2. Annual Statistical Booklet for Electricity and Seawater Desalination Industries. p. 162. Available online:
https://www.ecra.gov.sa/en-us/MediaCenter/doclib2/Pages/SubCategoryList.aspx?categoryID=5
(accessed on 13 May 2017).
3. Vision 2030 of Kingdom of Saudi Arabia. Available online: http://vision2030.gov.sa/en/ntp (accessed on 12
December 2018).
4. Household Energy Survey. General Authority for Statistics. 2017. p. 288. Available online:
https://www.stats.gov.sa/en/5654 (accessed on 16 May 2017).
5. Dincer, I.; Hussain, M.M.; Al-Zaharnah, I. Analysis of sectoral energy and exergy use of Saudi Arabia. Int.
J. Energy Res. 2004, 28, 205–243.
6. Alrashed, F.; Asif, M. Prospects of Renewable Energy to Promote Zero-Energy Residential Buildings in the
KSA. Energy Procedia 2012, 18, 1096–1105.
7. Esmaeil, K.K.; Alshitawi, M.S.; Almasri, R.A. Analysis of Energy Consumption Pattern in Saudi Arabia’s
Residential Buildings with Specific Reference to Qassim Region. Energy Effic. 2019, 12, 2123–2145.
8. Cengel, Y.A.; Boles, M.A. Thermodynamics an Engineering Approach, 8th ed.; McGraw-Hill: New York, NY,
USA, 2015.
9. Reistad, G.M. Available Energy Conversion and Utilization in the United States. J. Eng. Power 1975, 97, 429–434.
10. Dincer, I. The role of exergy in energy policy making. Energy Policy 2002, 30, 137–149.
11. Hepbasli, A. Low exergy (LowEx) heating and cooling systems for sustainable buildings and societies.
Renew. Sustain. Energy Rev. 2012, 16, 73–104.
12. Dincer, I.; Hussain, M.M.; Al-Zaharnah, I. Energy and exergy use in public and private sector of Saudi
Arabia. Energy Policy 2004, 32, 1615–1624.
13. Al-Ghandoor, A. Evaluation of energy use in Jordan using energy and exergy analyses. Energy Build. , 2013,
59, 1–10.
14. Ertesvåg, I.S. Society exergy analysis: A comparison of different societies. Energy 2001, 26, 253–270.
15. Badmus, I.; Osunleke, A.S. Application of energy and exergy analyses for efficient energy utilisation in the
Nigerian residential sector. Int. J. Exergy 2010, 7, 352–368.
16. Ílerı́, A.; Gürer, T. Energy and exergy utilization in Turkey during 1995. Energy 1998, 23, 1099–1106.
17. Utlu, Z.; Hepbasli, A. Analysis of energy and exergy use of the Turkish residentialcommercial sector. Build.
Environ. 2005, 40, 641–655.
18. Utlu, Z.; Hepbasli, A. Estimating the energy and exergy utilization efficiencies for the residential-
commercial sector: An application. Energy Policy 2006, 34, 1097–1105.
19. Saidur, R.; Masjuki, H.H.; Jamaluddin, M.Y. An application of energy and exergy analysis in residential
sector of Malaysia. Energy Policy 2007, 35, 1050–1063.
20. Kondo, K. Energy and exergy utilization efficiencies in the Japanese residential/commercial sectors. Energy
Policy 2009, 37, 3475–3483.
21. Liu, Y.; Li, Y.; Wang, D.; Liu, J. Energy and exergy utilizations of the Chinese urban residential sector.
Energy Convers. Manag. 2014, 86, 634–643.
22. Al-Ghandoor, A.; Al-Hinti, I.; Akash, B.; Abu-Nada, E. Analysis of energy and exergy use in the Jordanian
urban residential sector. Int. J. Exergy 2008, 5, 413–428.Sustainability 2020, 12, 2606 19 of 19
23. Abam, F.I.; Ohunakin, O.S.; Bethrand, N. End-use energy utilization efficiency of Nigerian residential
sector. Front. Energy 2014, 8, 322–334.
24. Al-Ghandoor, A.; ALSalaymeh, M.; Al-Abdallat, Y.; Al-Rawashdeh, M. Energy and exergy utilizations of
the Jordanian SMEs industries. Energy Convers. Manag. 2013, 65, 682–687.
25. Armel, T.K.F.; Vidal, A.K.C.; René, T. Energy Analysis and Exergy Utilization in the Residential Sector of
Cameroon. Energy Power Eng. 2015, 7, 93–104.
26. Utlu, Z.; Hepbasli, A. Parametrical investigation of the effect of dead (reference) state on energy and exergy
utilization efficiencies of residential–commercial sectors: A review and an application. Renew. Sustain.
Energy Rev. 2007, 11, 603–634.
27. Jansen, S.C.; Teres-Zubiaga, J.; Luscuere, P.G. The exergy approach for evaluating and developing an
energy system for a social dwelling. Energy Build. 2012, 55, 693–703.
28. Liu, C.; Xie, Z.; Sun, F.; Chen, L. Exergy analysis and optimization of coking process. Energy 2017, 139, 694–705.
29. Kazanci, O.B.; Shukuya, M.; Olesen, B.W. Theoretical analysis of the performance of different cooling
strategies with the concept of cool exergy. Build. Environ. 2016, 100, 102–113.
30. Han, T.; Zheng, Y.; Gong, G. Exergy analysis of building thermal load and related energy flows in
buildings. Indoor Built Environ. 2015, 26, doi:10.1177/1420326X15612881.
31. Gunhan, T.; Ekren, O.; Demir, V.; Hepbasli, A.; Erek, A.; Sahin, A.S. Experimental exergetic performance
evaluation of a novel solar assisted LiCl–H2O absorption cooling system. Energy Build. 2014, 68, 138–146.
32. Causone, F.; Sangalli, A.; Pagliano, L.; Carlucci, S. An Exergy Analysis for Milano Smart City, the
International Conference on Sustainability in, Energy Buildings. Energy Procedia 2017, 111, 867–876.
33. Saudi Building Energy Conservation Code-Residential SBC 602; Riyadh, KSA: 2018; p. 64.
34. Al-Badi, A.H.; Al-Saadi, S.N. Toward energy-efficient buildings in Oman. Int. J. Sustain. Energy 2019, 1–22,
doi:10.1080/14786451.2019.1685521.
35. Kalogirou, S. Thermal performance, economic and environmental life cycle analysis of thermosiphon solar
water heaters. Sol. Energy 2009, 83, 39–48.
36. Hazami, M.; Naili, N.; Attar, I.; Farhat, A. Solar water heating systems feasibility for domestic requests in
Tunisia: Thermal potential and economic analysis. Energy Convers. Manag. 2013, 76, 599–608.
37. Alalouch, C.; Al-Saadi, S.; AlWaer, H.; Al-Khaled, K. Energy saving potential for residential buildings in
hot climates: The case of Oman. Sustainable Cities and Society, 2019. 46: p. 101442.
38. Ahmad, A. Energy simulation for a typical house built with different types of masonry building materials.
Arab. J. Sci. Eng. 2004, 29, 113–126.
39. Almasri, R.A.; Almarshoud, A.F. Technical and Economic Performance of Thermosiphon Flat Plate Solar
Water Heaters in Saudi Arabia. Trans. Eng. Sci. 2016, 4, 16.
40. Almasri, R.A.; Almarshoud, A.F. Feasibility of Using Evacuated Tube Solar Water Heaters in Saudi Arabia.
Eur. J. Adv. Eng. Technol. 2017, 4, 232–241.
© 2020 by the authors. Licensee MDPI, Basel, Switzerland. This article is an open access
article distributed under the terms and conditions of the Creative Commons Attribution
(CC BY) license (http://creativecommons.org/licenses/by/4.0/).You can also read