Aluminium Sector Greenhouse Gas Pathways to 2050 - March 2021 world-aluminium.org - World ...
←
→
Page content transcription
If your browser does not render page correctly, please read the page content below
Aluminium Sector
Greenhouse Gas
Pathways to 2050
       March 2021

    world-aluminium.org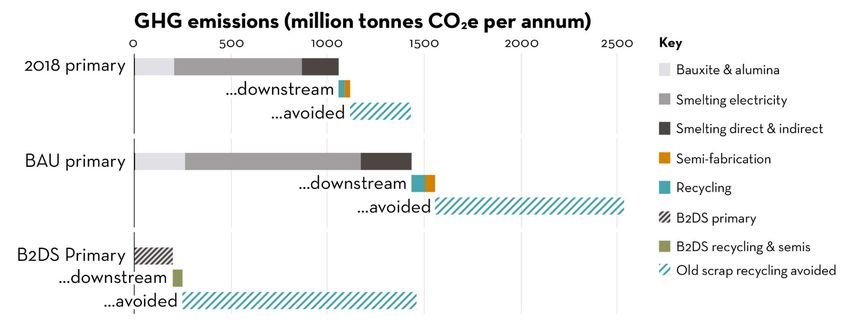
International Aluminium Institute (IAI)
Current IAI membership represents the major producers of bauxite, alumina and aluminium in all
significant regions, including China. Since its foundation in 1972, members of IAI have been
companies engaged in the production of bauxite, alumina, aluminium, the recycling of aluminium, or
fabrication of aluminium, or as joint venture partners in such. The key objectives of IAI are to:
Increase the market for aluminium by enhancing worldwide awareness of its unique and valuable
qualities;
Provide the global forum for aluminium producers on matters of common concern and liaise with
regional and national aluminium associations to achieve efficient and cost-effective cooperation;
Identify issues of relevance to the production, use and recycling of aluminium and promote
appropriate research and other action concerning them;
Encourage and assist continuous progress in the healthy, safe and environmentally sound
production of aluminium;
Collect statistical and other relevant information and communicate it to the industry and its
principal stakeholders; and
Communicate the views and positions of the aluminium industry to international agencies and
other relevant parties.
Through IAI, the aluminium industry aims to promote a wider understanding of its activities and
demonstrate both its responsibility in producing the metal and the potential benefits to be realised
through their use in sustainable applications and recycling.
Disclaimer: The information contained in this publication is presented to the best of IAI’s knowledge
but is without warranty.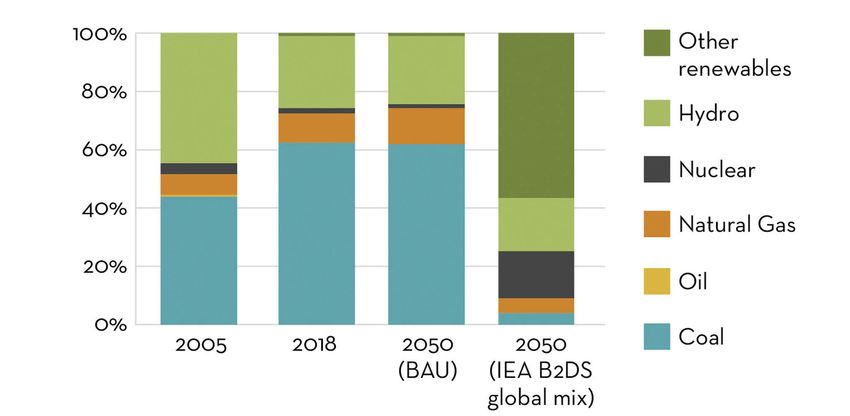
Contents
1.     Aluminium: central to a sustainable future ........................................................................ 1

2.     The International Aluminium Institute: a scientific authority & enabler of change ......... 2

3.     What is the aluminium sector’s carbon footprint? ............................................................ 2

4.     What would a Paris-aligned 2050 aluminium footprint look like? .................................... 7

5.     GHG emission reduction pathways .................................................................................. 10
           Electricity decarbonisation .............................................................................................. 10
           Direct emissions reduction .............................................................................................. 13
           Recycling & resource efficiency ...................................................................................... 15

6.     What is needed to deliver a Paris-aligned aluminium industry? .................................... 19

7.     References ......................................................................................................................... 20

                                                              Figures
Figure 1 2018 total aluminium sector emissions (Mt CO2e) heat mapped, by process and source .. 3

Figure 2 Global primary aluminium smelting power mix, TWh per annum (1980-2019) ................... 5

Figure 3 Global primary aluminium production by region, Mt Al per annum (1973-2019)................. 5

Figure 4 World average 2018 emissions intensity of PRIMARY aluminium, t CO2e/t Al................... 6

Figure 5 Total 2018 emissions from PRIMARY aluminium by power source, Mt CO2e .................... 6

Figure 6 Historic and forecast sector emissions under BAU scenario, Mt CO2e per annum ............ 7

Figure 7 Sector-wide emissions in 2018 and 2050 under BAU and B2DS, Mt CO2e ....................... 8

Figure 8 Global average primary aluminium carbon footprint under B2DS, t CO2e/t Al.................... 9

Figure 9 Changing smelter power mix under 2050 BAU and B2DS ............................................... 11

Figure 10 Pathway 1: Electricity decarbonisation .......................................................................... 12

Figure 11 Pathway 2: Direct emissions ......................................................................................... 14

Figure 12 Pathway 3: Recycling & resource efficiency .................................................................. 16

Figure 13 Aluminium supplied from primary and recycled sources in 2018 and 2050, Mt Al.......... 17

Figure 14 Cumulative impacts of recycling & resource efficiency potential, Mt CO2e..................... 18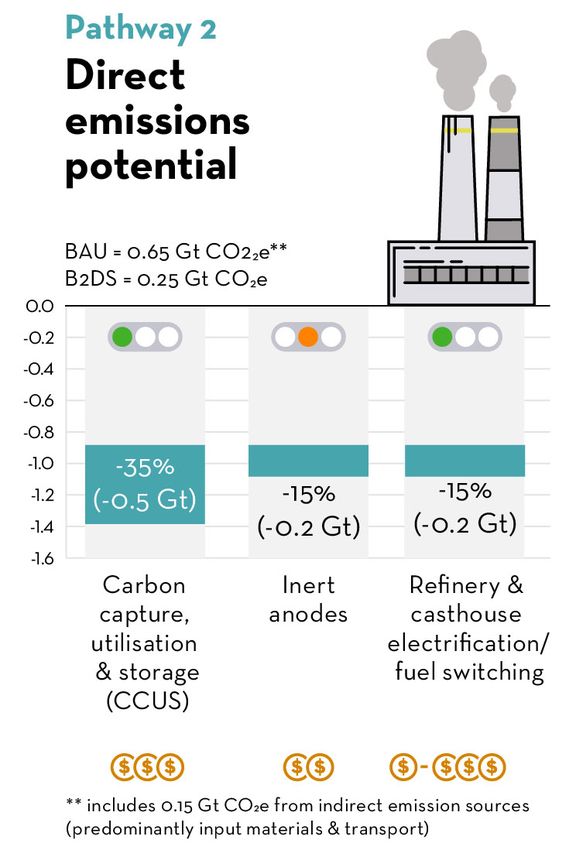
1. Aluminium: central to a sustainable future
Aluminium products are essential enablers of a low carbon future and the increased use of the metal
will lead to reduced economy-wide emissions.

Fleets of lightweight, autonomous, electric vehicles delivering leased mobility services to a growing
global population, powered by renewable energy grids; net positive, modular, intelligent buildings,
producing more energy than they consume and adapting in real time to the varied needs of their
occupants; lightweight and protective packaging solutions, bringing nutritional and pharmaceutical
benefits to ten billion people by 2050, minimising wastage and reducing burdens on logistics – all
will require the material and energy benefits that aluminium brings…and in increasing quantities.

While aluminium is part of the solution for a sustainable future (because of its unique combination of
properties: lightness, strength, durability, electrical and thermal conductivity, formability and
recyclability), the industry recognises that it has the potential to be part of the problem if the sector
does not plan and act quickly to reduce its greenhouse gas emissions in line with societal climate
goals. Increasing demand for aluminium will only be enhanced by transitioning to a low carbon
trajectory and such paths will be different for different actors within the aluminium sector around the
world and along the value chain.

This is a challenge. Not just an environmental challenge, but an economic, political, social, logistical
and technological one, made even more complex by differential access to the solutions that will be
required to deliver it (and the fact that many of these solutions are currently on the drawing board
while others do not yet exist).

It is, however, a challenge that the aluminium sector is poised to address, in part through the work
of the International Aluminium Institute (IAI), which is exploring realistic and credible technological
pathways for 2050 sector-wide greenhouse gas emissions reduction. These pathways are in line
with the Paris Agreement goal to limit global warming to well below 2°C, preferably to 1.5°C,
compared to pre-industrial levels.

With unrivalled industrial and material data and analyses, the IAI has mapped out the three main
routes for the aluminium industry to achieve global climate goals (while addressing other
sustainability issues). The technology needed in many cases is in the final stages of development
and deployment, however, significant investment is required. The greatest need is for policies to
support and accelerate that investment.

                                                                                                       1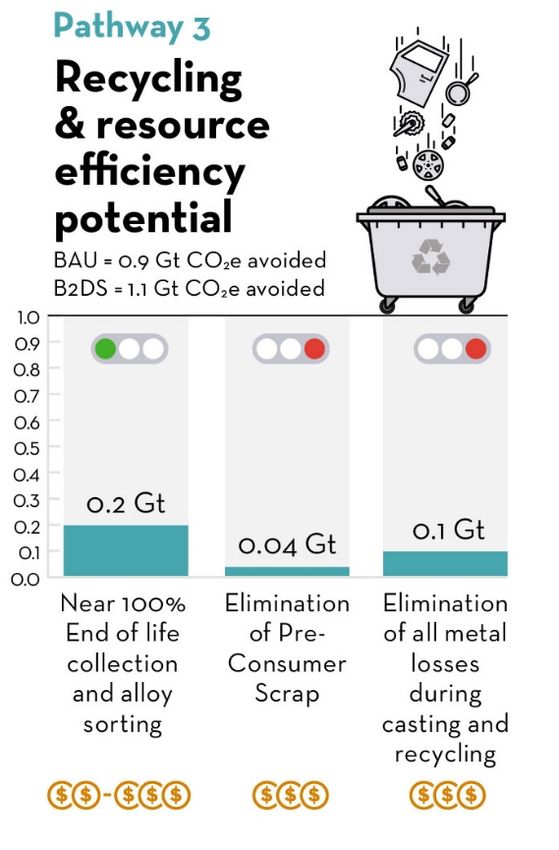
2. The International Aluminium Institute: a scientific authority & enabler
   of change
The Greenhouse Gas Pathways Working Group, made up of IAI member companies and regional
associations, has worked collaboratively to understand and articulate:

-   The emissions benefits delivered by the use and recycling of aluminium products;
-   The sector’s footprint and sources of emissions;
-   How this footprint might change over the next thirty years if no action is taken, given changing
    demand for aluminium products;
-   What the industry as a whole (and individual actors along the value chain) would need to achieve
    under a below 2-degree warming scenario;
-   The range and mix of decarbonisation technologies, including existing, new, under-development
    and yet-to-be-developed solutions, available to different actors with varying processes and
    emission profiles;
-   Policy (and investment) drivers and barriers to decarbonisation – through production process
    emissions mitigation and through recycling savings.

All of this is underpinned by the IAI’s mature emissions models, built on its member companies’ data
and analytical expertise.

The pathway choices made by aluminium industry actors will depend on their unique energy
endowments, raw material and scrap availability, regional policies, investment options and the
availability, speed and cost of technology development and implementation.

There is a need for sector-wide and inter-sectoral partnerships to address the huge challenge of
reducing GHG emissions, while satisfying growing demand. Partnerships will be required among
and between producers, as well as with the public sector and academia, power generators, semi-
fabricators, customers/original equipment manufacturers (OEMs) and end users. Due to its relative
homogeneity in terms of processes and products, along with its scale and global scope, the
aluminium industry can meet this need, with the IAI uniquely placed to initiate, facilitate and inform
such partnerships.

3. What is the aluminium sector’s carbon footprint?
The IAI has collected data on industry emissions for more than two decades, recently publishing a
15-year database of sector emissions (IAI, 2020a), which covers all processes cradle-to-gate. That
means ALL the emissions that the sector generates in its own facilities (primary and recycling), but
also those embedded in the raw materials, ancillary materials and energy that the sector consumes.
This is the most comprehensive, detailed and up to date sector-wide dataset that exists for
aluminium, but also any material, today.

                                                                                                    2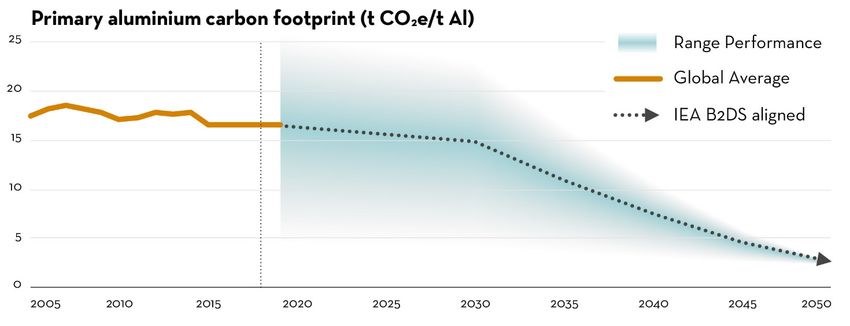
According to this 2018 data, the sector is responsible for 1.1 billion tonnes of greenhouse gas
emissions per annum, around 2% of all global anthropogenic emissions 1. More than 90% of this
footprint is from primary production processes, while primary aluminium currently makes up around
70% of annual metal demand.

                                                                                                                  Internal
                           Bauxite    Alumina      Anode                                              Semis
                           mining     refining   production
                                                              Electrolysis   Casting   Recycling*
                                                                                                    production
                                                                                                                   scrap
                                                                                                                 remelting
                                                                                                                             Total

            Electricity
             (indirect)     0.6        16.9          -         670.6           -         3.1          9.5          2.5        703

       Non CO2 GHGs
             (direct)        -         32.2          -          35.4           -           -            -           -         68

          Process CO2
              (direct)       -           -         6.4          92.6           -           -            -           -         99

    Ancillary materials
              (indirect)     -         14.8       19.3           6.4           -           -            -           -         41

       Thermal energy
      (direct/indirect)     2.6       124.3        6.4             -          6.4       15.6         19.0          8.4        183

             Transport
             (indirect)      -         15.4          -          18.7           -           -            -           -         34

                  Total
       (cradle to gate)      3         204          32          824            6          19           29          11        1,127

           Figure 1 2018 total aluminium sector emissions (Mt CO2e) heat mapped, by process and source
                                     (*recycling of pre- and post-consumer scrap), (IAI, 2020a)

In the IAI’s material flow analysis (IAI, 2021a) demand for aluminium is expected to grow by 80% by
2050. This will be met by a combination of recycled and primary aluminium. Aluminium products
already have high recycling rates. Yet, even with further improvements in collection, the long lifetimes
of durable aluminium products, a growing population and a broader range of applications mean there
will not be enough post-consumer scrap to meet this demand alone and primary metal will still need
to be produced until at least the second half of the century.

Collection rates of end-of-life products are currently above 70%, having increased by 10% in the
past 10 years (IAI, 2020b). However, there are still significant opportunities to increase the collection,
sorting and recycling of post-consumer products to reduce (to some extent) the need for primary
aluminium.

1   Expressed as CO2 equivalents – CO2e (or 4% of carbon dioxide (CO2) emissions)

                                                                                                                                     3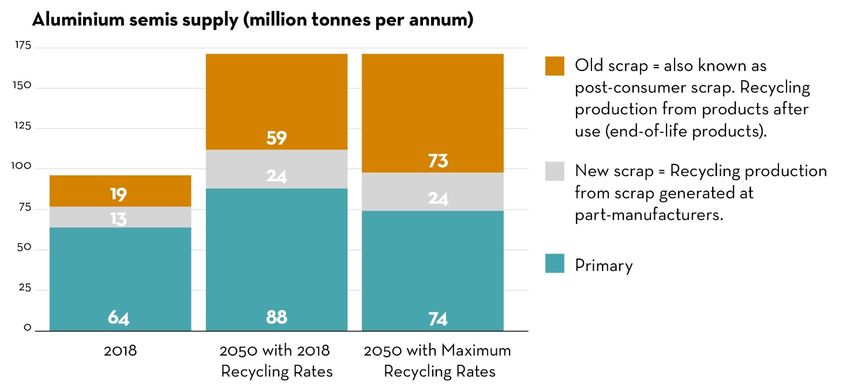
Primary aluminium production is an energy intensive process (IAI, 2020c), requiring huge amounts
of electricity to break the strong oxygen bonds of the input chemical - alumina 2. The reactivity of
aluminium is a function of its atomic structure, which is also the source of its valuable physical
qualities, such as lightness, strength, durability and conductivity, making it the material of choice for
so many applications.

The production of primary aluminium (IAI, 2018) begins with the mining of bauxite ores. Around 5.5
tonnes of bauxite is required on average to produce one tonne of aluminium. The mining process
itself is relatively low emitting (compared to other processes in the value chain) representing one
quarter of a percent of total sector emissions, mainly from mobile equipment. Transport of bauxite
(and all other intermediate products) amounts to around 3% of emissions.

Alumina is extracted from bauxite in the Bayer Process, which requires energy in the form of heat
and steam, as well as ancillary materials such as sodium hydroxide, all of which come with a carbon
footprint. Alumina production represents just under 20% of all sector emissions.

The smelting of aluminium currently takes the form of a reduction-oxidation reaction between the
raw material, alumina, and carbon anodes, in which three electrons are provided to each aluminium
ion to reduce it to its metal form, while the carbon atoms of the anodes are oxidised to form carbon
dioxide, according to the reaction:

                                      2Al2O3 + 3C → 4Al + 3CO2

Thus, direct carbon dioxide emissions from this process are proportional to the production of
aluminium. This electro-chemical process (electrolysis) requires electricity, carbon anodes and
ancillary products, such as cryolite (sodium aluminium fluoride), as well as thermal energy to cast
liquid metal into solid products. Electricity-related emissions dominate the 75% of sectoral emissions
that smelting represents. And yet, this is the source with the greatest variation across the industry,
depending on the smelter power mix – historically dominated by hydropower, but now increasingly
by coal and gas combustion (IAI, 2020d).

Recycling on the other hand, requires much less energy – essentially only that needed to melt the
aluminium scrap. It also has no need to reduce aluminium oxide to aluminium metal and so emissions
of carbon dioxide from the chemical reaction mentioned above are eliminated.

Thus, the emissions profile of the industry is dominated by primary aluminium production, with a
kilogram having a carbon footprint of anywhere between less than 5 and more than 25 kg CO2e,
depending on the source of energy used to generate the electricity.

2   Alumina is a chemical compound of aluminium and oxygen with the chemical formula Al2O3

                                                                                                       4
1,000
                                                                                                          Other Renewable
                       900
Power consumption (TWh)

                       800                                                                                Other Non-renewable
                       700
                       600                                                                                Nuclear

                       500                                                                                Oil
                       400
                       300                                                                                Natural Gas

                       200                                                                                Coal
                        100
                          0                                                                               Hydro

                                                                                            2012
                                                                                                   2016
                                    1980
                                           1984
                                                  1988
                                                         1992
                                                                1996
                                                                       2000
                                                                              2004
                                                                                     2008

                            Figure 2 Global primary aluminium smelting power mix, TWh per annum (1980-2019), (IAI, 2020d)

                             70
                                                                                                          Estimated unreported
                             60                                                                           Oceania
Million tonnes primary Al

                             50                                                                           East & Central Europe

                             40                                                                           West Europe

                                                                                                          South America
                             30
                                                                                                          North America
                             20                                                                           China (Estimated)
                              10                                                                          GCC

                               0                                                                          Asia (ex China)
                                    1973
                                    1977
                                     1981

                                    2013
                                    2017
                                    1985
                                    1989
                                    1993
                                    1997
                                   2001
                                   2005
                                   2009

                                                                                                          Africa

                       Figure 3 Global primary aluminium production by region, Mt Al per annum (1973-2019), (IAI, 2021b)

                                                                                                                                  5
24
Transport
Emissions Intensity (t CO2e/t Al)
20 Thermal Energy
Ancillary Materials
16
Direct Process
12 Electricity
8
4
0
World Coal-fired Gas-fired Mixed grid Low-C
average power
Figure 4 World average 2018 & example power mix cradle-to-gate emissions intensity
of PRIMARY aluminium, t CO2e/t Al
1,000
Transport
900
Thermal Energy
Total Emissions (Mt CO2e)
800
700 Ancillary Materials
600 Direct Process
500
Electricity
400
300
200
100
0
Coal-fired Gas-fired Mixed grid Low-C power
Figure 5 Total 2018 cradle-to-gate emissions from PRIMARY aluminium by power source, Mt CO2e
61,600
1,400
Total Emissions (Mt CO2e)
1,200
1,000
800
600
400
200
0
2005 2010 2015 2020 2025 2030 2035 2040 2045 2050
Electricity indirect Process directs Other indirects Non-primary emissions
Figure 6 Historic (2005-2018) and forecast (2019-2050) global aluminium sector emissions
under the BAU scenario, Mt CO2e per annum
Driven by the expected growth in demand for aluminium applications, and even with recycling
forming a significant proportion of supply (up to 60% by mid-century), Business As Usual emissions
for the sector are forecast to reach 1.6 Gt CO2e by 2050, the majority (1.5 Gt) from primary
production.
4. What would a Paris-aligned 2050 aluminium footprint look like?
The International Energy Agency (IEA) recognises the contribution of aluminium to a decarbonising
world and has therefore given the sector a 2050 allowance for greenhouse gas emissions that is
above zero, even as the world would need to be at net zero by the second half of the 21st century.
The IEA has published two below 2°C warming scenarios: the Beyond 2°C Scenario (B2DS) (IEA,
2017) and the Sustainable Development Scenario (SDS) (IEA, 2020). Under B2DS, the IEA
forecasts that by 2050 there should be a reduction in total anthropogenic CO2 emissions from 34.3
Gt CO2 (2014) to 4.8 Gt CO2, whilst the SDS requires a reduction from 35.7 Gt (2019) to 9.4 Gt CO2
(2050). The IAI decided to work under the B2DS scenario framework due to the availability of regional
electricity datasets and the lower overall global CO2 emissions budget by 2050. Nevertheless, the
IAI will continue to work on improving its scenarios based on material flow modelling and updated
climate science.
The IEA’s B2DS budget for the aluminium sector includes a subset of the industry’s direct emissions,
with separate regional pathways for the electricity consumed by the industry. The IAI has therefore
7brought together the IEA scenario for direct CO2 emissions generated by the aluminium sector and
its power consumption and developed B2DS-aligned pathways for the emissions not included in the
IEA’s dataset. The result is a B2DS-aligned pathway for the entire aluminium sector, which indicates
that by 2050:
• Total aluminium sector emissions covering the entire chain (bauxite, alumina and primary
aluminium production, pre- and post-consumer aluminium scrap recycling and semi-finished
aluminium production processes, cradle-to-gate) would need to be reduced to 250 Mt CO2e
(from a 2018 baseline of 1,100 Mt CO2e and a projected Business as Usual (BAU) 2050
pathway of 1,600 Mt CO2e).
• Out of this 250 million tonnes, the emissions from electricity consumed in all processes (but
in particular smelting) would account for near zero emissions. Today this source accounts for
700 Mt CO2e and in 2050 would emit 900 Mt CO2e under BAU.
• Non-electricity primary aluminium emissions (cradle-to-gate) would need to be reduced from
400 Mt CO2e today (over 520 Mt in 2050 under BAU) to below 200 Mt CO2e.
• Fuel combustion emissions from recycling and fabrication processes would need to be
reduced by 55% compared to BAU, from over 110 Mt CO2e to 50 Mt CO2e.
In 2018, global demand for aluminium was 95 million tonnes per annum; two-thirds of which was met
by primary aluminium and one third from recycled scrap.
Rapid population and economic growth over the coming decades means global demand for
aluminium is set to increase by up to 80% (to 170 Mt) by 2050 (material flow model “2020 IAI
Reference Scenario” (IAI, 2021a) and this will still be met by a mix of both recycled and primary
metal.
Figure 7 Sector-wide emissions in 2018 and 2050 under BAU and B2DS, Mt CO2e
8The global average emissions intensity of a tonne of aluminium (semi-fabricated) product would
therefore need to be around 1.5 t CO2e/t Al (cradle-to-gate) in 2050 to be B2DS aligned:
(2050 B2DS-aligned sectoral “allowance”) / (2050 aluminium semis demand)
(million tonnes CO2e) / (million tonnes aluminium)
250 / 170
= 1.5 t CO2e/t Al semis
Despite increased projected recycled metal supply, the IAI estimates that between 75 and 90 million
tonnes per annum of primary aluminium will still be required in 2050. Assuming a primary aluminium
“allowance” of 200Mt (80% of the 2050 budget, compared to 95% today), the average emissions
intensity of primary aluminium would need to be 2-3 t CO2e/t Al (cradle-to-gate) to be B2DS aligned:
(2050 B2DS-aligned primary “allowance”) / (2050 aluminium primary demand)
(million tonnes CO2e) / (million tonnes aluminium)
200 / 80
= 2.5 t CO2e/t Al primary
Broadly these numbers assume a 100% reduction of electricity-related emissions over the next 30
years - a significant challenge for primary producers. This also assumes a 50% reduction in direct
(process and thermal energy) emissions and those embedded in raw materials and ancillary
processes – a challenge common to all players along the value chain, including the downstream
industry.
Figure 8 Global average primary aluminium carbon footprint under B2DS aligned 2050 scenario, t CO2e/t Al
95. GHG emission reduction pathways
There are three broad areas that have the potential to contribute to this delinking of growth and
emissions, each with distinct innovation, policy and financial drivers, barriers, costs and materiality:
1. Electricity decarbonisation
2. Direct emissions reduction
3. Recycling & resource efficiency
The following exploration of greenhouse gas emissions pathways identifies the most significant
(greatest emissions reduction potential) technological and policy changes that can/may be
implemented in order to realise sectoral B2DS-aligned decarbonisation.
Depending on where they sit within the aluminium value chain, the processes currently employed
and the future availability of energy and material resources, different corporate actors will follow
different (or a range of different) pathways, at different rates and from different starting points.
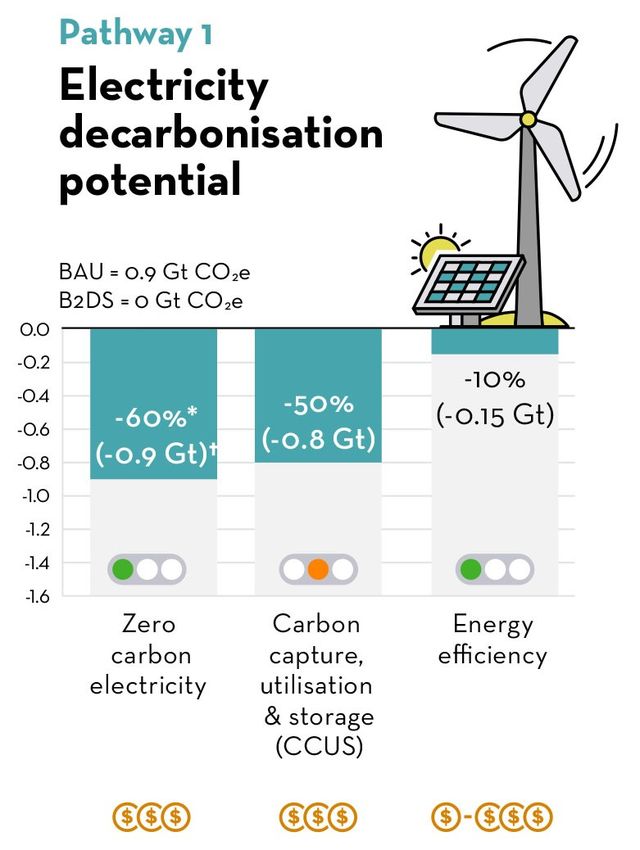
Electricity decarbonisation
The generation of electricity was responsible for 60% of the sector’s emissions in 2018.
Decarbonised power generation and the accelerated deployment of carbon capture utilisation and
storage (CCUS) offer the most significant opportunity for emissions reduction.
Decarbonisation of electricity grids (currently supplying a third of the industry’s power needs) and a
shift in captive (self-generating) power plants to low/near-zero emissions sources will require
significant investment, both for the existing 45 million tonnes of primary aluminium currently powered
by fossil fuel-generated electricity, and for the additional 20-25 million tonnes of aluminium
production capacity required to meet 2050 demand.
Existing producers are presented with a wide range of significantly different opportunities,
technologies and pathways depending on local circumstances and energy endowment.
Aluminium production in fossil fuel heavy regions is predominantly powered by self-generated
electricity. In some cases, this is due to grid power being unreliable during the construction of
smelters, which require 24/7 power. IAI data indicates that 97% of electricity in Asia (ex-China), for
instance, is self-generated (IAI, 2020d).
Depending on the pathway(s) followed, the capital investment required for electricity decarbonisation
is in the range of US$ 0.5 to 1.5 trillion over the next 30 years.
Aside from this capital investment, it is recognised that the sector (and society in general) will likely
pay more per unit of energy and that further investments will be required to upgrade or install new
aluminium production facilities.
10Hydropower was the dominant source of electricity for aluminium smelters throughout the 20th
century (IAI, 2020d). While hydro-based production has remained relatively flat since the 1970s,
recent years have seen plans for significant growth. This has occurred as a number of aluminium
producers in China begin to replace coal-fired capacity (much of it relatively young, less than 10
years old) in central and eastern China with new capacity in Yunnan Province. Three million tonnes
of aluminium have relocated in the last year with a further 3-5 million tonnes scheduled to shift in the
coming years. This is part of a broader plan for low carbon aluminium production proposed by the
largest Chinese producers (China Hongqiao & China Aluminum Corporation, 2021).
Figure 9 Changing smelter power mix under 2050 BAU compared to IEA Beyond 2 Degree Scenario (B2DS).
(Fossil fuel in B2DS predominantly with CCUS).
The United Arab Emirates (UAE) Energy Strategy 2050 (UAE Government, 2017) aims to reduce
the carbon footprint of power generation by 70% (with an energy mix that combines renewable,
nuclear and other clean energy sources). It will also improve the energy efficiency of consumers by
40%, through an AED 600 billion (USD$ 165 bn) investment over the next 30 years, while delivering
savings of AED 700 billion (USD$ 190 bn).
Carbon capture utilisation and storage (CCUS) from power plants has the potential to reduce
emissions from electricity supply at a similar level as grid decarbonisation at similar costs per tonne
of carbon, with the IEA identifying costs of US$ 40-80/tCO2 for coal- and gas-fired power plants (IEA,
2019).
Energy efficiency gains in existing facilities through incremental improvement (“creep”) and
retrofitting and installing new capacity would contribute only 10% to emissions reduction.
11As grids transition to lower inertia (intermittent renewable electricity generation sources, with a
changing demand base including more electric vehicles that lead to peak loads at given times), large
and consistent electricity consumers, like aluminium smelters, will play an increasingly important role
in stabilising grids. This enabling role will be important in giving smelters access to renewables grids
– in the same way that many 20th century smelters enabled the development of new power networks
in regions such as Brazil and southern Africa.
Figure 10 Pathway 1: Electricity decarbonisation
12Direct emissions reduction
The past 20 years have seen a dramatic reduction in the proportion of sectoral emissions that are
directly emitted from the aluminium production process (as opposed to the electricity and raw
materials they consume) and of that share, those which are evolved from the combustion of fuels (to
provide heat and steam) and other sources.
This is partly a consequence of the growth in fossil fuel power and the focus of the industry on
eliminating process-related emissions, such as the high global warming potential gases
perfluorocarbons (PFCs) from anode effects, improving energy efficiency and adding new (and best
available) refining and smelting technologies.
In 1990, with sector-wide emissions at less than 300 Mt CO2e per annum, direct emissions made up
around two-thirds of this total. Of this approximately 200 Mt CO2e, PFCs constituted 100 Mt CO2e
(33%).
Today, direct emissions constitute less than one-third of the total sectoral emissions (300 Mt CO2e
of the 2018 total of 1.1 Gt CO2e), with PFCs making up only 35 Mt CO2e (3%) (IAI, 2020a). This is
due to a concerted effort to improve management of the smelting process in the 1990s and 2000s,
as well as the addition of new technologies in the 2000s and 2010s. Anode consumption in the
smelting process and fuel combustion across all production processes make up almost all of the
direct emissions from the sector.
Thus, the promising pathways to emissions reduction in this category are focused on two things:
• novel (inert anode) technologies that eliminate the need for carbon anodes in smelting, and
• the development of technologies that can provide heat and steam without the combustion of
fossil fuels (e.g. electrification with renewable power sources, combustion of renewables-
produced hydrogen, concentrated solar thermal as a share of the energy mix and mechanical
vapour re-compression of steam).
In addition, the capture and sequestration of greenhouse gases from each source at point of
emission or evolution is another potential pathway.
Challenges with CCUS are not unique to the aluminium sector and costs reflect wider issues that
emitters will face in developing and deploying these technologies appropriately. For aluminium
smelting however, the low concentration of CO2 in the flow of gases from electrolytic cells at 500-
15,000 ppm presents an additional challenge, requiring redesign or retrofitting of cells and
consequent costs of design, realisation and deployment. This is without counting the cost of
scrubbing the other contaminants before the carbon is captured (to reduce contamination of captured
CO2).
Removal of direct emissions from the electrolytic smelting process (transforming alumina into
aluminium) is a challenge common to all primary aluminium producers and will require a step change
in technology to realise. Novel cell technologies, such as inert anodes, will play an important role in
13emissions reduction, but it should be noted that the sources they mitigate make up around 15% of
global sector-wide emissions.
These technologies will also need to operate at similar or better energy intensity than existing carbon
anodes during the transition to zero-carbon power environments. This is because any reductions in
direct emissions could be outweighed by indirect electricity-related emissions if deployed at a higher
energy consumption in fossil fuel powered grids. However, in the long-term, inert anodes will be an
important component of a B2DS-aligned sectoral pathway.
Figure 11 Pathway 2: Direct emissions
14Alumina production (from bauxite ore) requires significant amounts of heat and steam (IAI, 2020e).
The challenges associated with technologies to decarbonise these energy carriers are not unique to
the aluminium industry.
For these thermal processes, electrification with renewables offers a potential pathway to
decarbonisation. Fuel switching to green hydrogen, concentrated solar thermal energy and carbon
capture utilisation and storage (CCUS) are opportunities where electrification is not feasible, such
as alumina calcining, where direct replacement of fossil fuel-fed boilers with electric boilers could
have product quality implications and thus higher emissions downstream.
Other fuel combustion processes (mobile equipment in mining, ovens for baking anodes, casthouse
furnaces, remelting & recycling) will follow similar pathways (electrification, fuel switching and
CCUS), while already electrified processes (extrusion, rolling, etc.) will require renewables
deployment at the same rate as smelting (zero emissions by 2050).
Ancillary materials and transport emissions (representing around 8% of sector emissions under BAU)
will be reduced at the same rate as direct emissions through pathway changes in other sectors and
purchasing choices by aluminium producers.
Recycling & resource efficiency
Infinite recyclability, without loss of properties, is one of aluminium’s unique benefits, making it an
enabling material for circular economies (IAI, 2018). Current end-of-life (post-consumer) recycling
(collection) rates for the metal in its largest market segments (transport, building and construction)
are high – above 90%. However, these applications tend to have long lifetimes (taking advantage of
aluminium’s durability) and so scrap availability is as much constrained by product life as it is by
recycling rates.
Thus, three quarters of the more than 1.4 billion tonnes of aluminium ever produced is still in
productive use, providing services globally today and available for collection and recycling/reuse in
the future (IAI, 2021a).
Aluminium in packaging applications has a much shorter lifetime and a range of collection and
recycling rates depending on the application (cans tend to be higher than flexible packaging) and
local market, consumer behaviour and political conditions.
The aluminium scrap that is collected at the end of product life also has a diversity of qualities,
depending on the constituent alloy classes and how well the scrap has been sorted. Lower quality,
mixed scrap, while of use for certain applications today, will have fewer “places to go” in a future that
will require higher value, wrought alloys (in applications such as electric vehicle light-weighting).
The onus is on producers and consumers (and waste management actors) to ensure that material
is brought back into the system at end of life. It is also a responsibility of those who design and
transform the metal into products to create applications from which aluminium components can be
15easily and efficiently separated, collected and sorted to ensure that the metal’s value and its alloys
are retained.
The recycling of post-consumer scrap today avoids the need for almost 20 million tonnes of primary
aluminium and thus around 300 million tonnes of CO2e. Once collected, metal losses during scrap
processing (3%) and melting (6%) are relatively low.
Figure 12 Pathway 3: Recycling & resource efficiency
There are high recycling rates (>90%) in building and construction and automotive segments. In
some regions recycling of cans is almost 100%, though lower rate regions consume significant
volumes of metal. In 2018, 1.2 million tonnes of aluminium in the form of used beverage cans and
other rigid packaging was not collected at end of life.
16Across all segments, around 7 million tonnes of aluminium is not recycled every year due to collection
and processing losses at the end of its life (2018), and this will rise to 17 million tonnes per annum
by 2050 with no change to current recycling rates (IAI, 2021a).
When this metal is not retained in the economy, it must be replaced by primary aluminium. Primary
production today has a greenhouse gas emissions profile on average twenty times higher than
recovery of metal from scrap.
Recovery of 95% of this material through improved collection, sorting and recycling processes would
reduce the need for primary aluminium by 15% and deliver 250 million tonnes of absolute CO2e
emissions reduction per year, second in magnitude only to the decarbonisation of smelter electricity.
New and internal scrap (the scrap that is generated in the various production and fabrication
processes prior to final product manufacture) has a very high collection rate and low post-collection
losses. This is due to the fact that it tends to be a clean, well-sorted material stream, already under
the management and control of producers, who understand its value and for whom material losses
impact profitability. Thus, while the volumes of new scrap generated today (13 million tonnes in 2018)
and in 2050 (24 Mt) are high, losses are extremely low.
Figure 13 Aluminium supplied from primary and recycled sources in 2018 and 2050,
under alternative recycling rate scenarios, Mt Al
New and internal scrap is remelted (through a thermal process), which generates CO2, albeit at a
very low level compared to primary production (IAI, 2020a). The reduction in new scrap generation,
through some yet unknown processes (e.g. 3D printing), while seemingly attractive to reduce the
number of internal scrap loops, has a limited impact (1.5% or 38 Mt CO2e) on emissions reduction.
17A fully circular system without any (collection, process and melt) losses and no generation of new
and internal scrap would deliver a 20% reduction on BAU sector emissions.
2050 (BAU) with 2018 recycling rates
Recycling with maximised recycling rates
Utilization zero new scrap generation
Process Losses zero pre-melting and melting losses
Circular maximum recycling & resource efficiency potential
Figure 14 Cumulative impacts of recycling & resource efficiency potential, Mt CO2e
This transformation of the supply of aluminium requires action from all actors along the value chain
- including consumers - and policy frameworks that incentivise circularity, including investments in
scrap recycling capacity and design for disassembly/recycling, including novel metal/material joining
technologies.
186. What is needed to deliver a Paris-aligned aluminium industry?
As an integrated and global industry, supplying energy-saving and emissions-reducing lightweight,
recyclable products to some of the highest GHG emitting sectors, a full value chain approach to
emissions reduction is critical for the aluminium sector. This lifecycle approach requires that, in
addition to reducing the global industry’s footprint, the in-use benefits of aluminium products and
savings from recycling are maximised.
As an industry, moving from a 1.1 Gt CO2e base to 250 Mt CO2e by 2050, while growing production
by up to 80%, will require action from all actors along the value chain, including technology providers,
governments and investors.
Commitments from producers to mid-century targets that are B2DS or SDS aligned will need to be
bolstered and enabled by policies that secure long-term aluminium sector access to competitively
priced renewable electricity and drive increased investment in research, development and the
deployment of electrified processes, green hydrogen, inert anode and CCUS (in concert with co-
located industries). In addition, circular economy policies that promote both improved scrap
collection (particularly in packaging) and scrap alloy sorting (particularly in automotive) will be critical
to ensuring that the value of aluminium (and the significant energy required in its initial production)
is not lost at the end of products’ life.
Here, customers have a role to play too in designing aluminium containing products in a way that
maximises metal recovery and recycling, as well as sorting production scrap by alloy class at the
point of generation.
Finally, and crucially, with the cost of decarbonisation of the aluminium sector in the order of trillions
of dollars, the key enabler of a 2050 low carbon aluminium sector is investment:
• to deliver up to 25 million tonnes of new smelting capacity and the decarbonisation of an
existing 65 Mt capacity.
• for the 180 million tonnes of alumina capacity required to meet smelter demand.
• in the new carbon-free or CCUS technologies that currently make up less than 1% of
aluminium production, but by 2050 will need to fulfil over 50%.
• in the electrification of operations all along the value chain and the renewables grids that
power them.
• in an industry that is critical to the global achievement of net zero emissions across all sectors
by the end of this century.
197. References
China Hongqiao & China Aluminum Corporation. (2021, January 15). Accelerating Aluminum
Industrial Green and Low-Carbon Development Joint Proposal. Retrieved March 10, 2021,
from http://en.hongqiaochina.com/details/750.html
IAI. (2018). The Aluminium Story. Retrieved March 10, 2021, from www.thealuminiumstory.com
IAI. (2020a, July 21). GHG Emission Data for the Aluminium Sector (2005-2019). Retrieved March
9, 2021, from World Aluminium: https://www.world-
aluminium.org/media/filer_public/2020/10/01/ghg_emissions_aluminium_sector_21_july_20
20_read_only_25_september_2020.xlsx
IAI. (2020b, October). Aluminium Recycling Factsheet. Retrieved March 10, 2021, from World
Aluminium: https://www.world-
aluminium.org/media/filer_public/2020/10/20/wa_factsheet_final.pdf
IAI. (2020c, August 5). Primary Aluminium Smelting Energy Intensity. Retrieved March 10, 2021,
from World Aluminium: https://www.world-aluminium.org/statistics/primary-aluminium-
smelting-energy-intensity/
IAI. (2020d, July 8). Primary Aluminium Smelting Power Consumption. Retrieved March 10, 2021,
from World Aluminium: https://www.world-aluminium.org/statistics/primary-aluminium-
smelting-power-consumption/
IAI. (2020e, June 22). Metallurgical Alumina Refining Energy Intensity. Retrieved March 10, 2021,
from World Aluminium: https://www.world-aluminium.org/statistics/metallurgical-alumina-
refining-energy-intensity/
IAI. (2021a). Global Aluminium Cycle 2018. Retrieved March 9, 2021, from The Global Aluminium
Cycle: https://alucycle.world-aluminium.org/
IAI. (2021b, February 22). Primary Aluminium Production. Retrieved March 10, 2021, from World
Aluminium: https://www.world-aluminium.org/statistics/primary-aluminium-production/
IEA. (2017). Energy Technology Perspectives 2017. Paris: IEA. Retrieved March 10, 2021, from
https://www.iea.org/reports/energy-technology-perspectives-2017
IEA. (2019). Transforming Industry through CCUS. Paris. Retrieved March 10, 2021, from
https://www.iea.org/reports/transforming-industry-through-ccus
IEA. (2020). Energy Technology Perspectives 2020. Paris: IEA. Retrieved March 10, 2021, from
https://www.iea.org/reports/energy-technology-perspectives-2020
UAE Government. (2017). Energy Strategy 2050. United Arab Emirates. Retrieved March 10, 2021,
from https://u.ae/en/about-the-uae/strategies-initiatives-and-awards/federal-governments-
strategies-and-plans/uae-energy-strategy-2050
20International Aluminium Institute
2 Duke Street, St James’s
London
SW1Y 6BN
United Kingdom
+44 (0) 20 7930 0528
www.world-aluminium.orgYou can also read