VALUING WATER The United Nations World Water Development Report 2021 Facts and figures - UN-Habitat
←
→
Page content transcription
If your browser does not render page correctly, please read the page content below
The United Nations World Water Development Report 2021

   VALUING WATER
   Facts and figures

           United Nations     World Water
Educational, Scientific and   Assessment
    Cultural Organization     Programme
Water availability
Water stress, essentially measured as water use as a function of available supply, affects
many parts of the world. Over two billion people live in countries experiencing water stress
(United Nations, 2018).1
Physical water stress is often a seasonal rather than an annual phenomenon, as exemplified
by the seasonal variability in water availability. An estimated four billion people live in areas
that suffer from severe physical water scarcity for at least one month per year (Mekonnen and
Hoekstra, 2016).
About 1.6 billion people face ‘economic’ water scarcity, which means that while water
may be physically available, they lack the necessary infrastructure to access that water
(Comprehensive Assessment of Water Management in Agriculture, 2007).
Several of the world’s main aquifers are under increasing stress and 30% of the largest
groundwater systems are being depleted (Richey et al., 2015). Water withdrawals for irrigation
are the primary driver of groundwater depletion worldwide (Burek et al., 2016).
Water storage
Globally, built reservoir capacity per person is decreasing, as reservoir expansion has not
been able to keep pace with population growth, but also because storage capacity of existing
reservoirs is decreasing, chiefly due to sedimentation.
Average annual storage volume losses equal about 1% of total built reservoir capacity, and the
estimated costs for restoring these losses are approximately US$13 billion per year (George
et al., 2017). An assessment of the value of storage capacity for enhancing water security in
the world’s 400 largest river basins identified water shortage risks in many parts of Africa, as
well as in Australia, northern China, India, Spain and the western USA (Gaupp et al., 2015).
There are widespread declines in total water storage and associated freshwater availability
that are primarily attributed to the intensive overextraction of groundwater and an increasing
temperature-induced surface water loss (Liu et al., 2019).
Water demand and use
Global freshwater use has increased by a factor of six over the past 100 years and continues
to grow at a rate of roughly 1% per year since the 1980s (AQUASTAT, n.d.). Much of this growth
can be attributed to a combination of population growth, economic development and shifting
consumption patterns.
Agriculture currently accounts for 69% of global water withdrawals, which are mainly used for
irrigation but also include water used for livestock and aquaculture. This ratio can reach up to
95% in some developing countries (FAO, 2011a).
1
For all sources cited in this document, please refer to the full report available at www.unesco.org/
water/wwap.
2 THE UNITED NATIONS WORLD WATER DEVELOPMENT REPORT 2021 VALUING WATERIndustry (including energy and power generation) accounts for 19%, while municipalities are
responsible for the remaining 12% (AQUASTAT, 2016).
Globally, agriculture accounts for only about 4% of global Gross Domestic Product (GDP) with
an average contribution per country of 10.39%, the trend being a decreasing share of GDP
(World Bank, 2020). Such figures suggest that the value added of water use in agriculture is
very low.
The Food and Agriculture Organization of the United Nations (FAO) estimates, based on a
business-as-usual scenario, that the world will need about 60% more food by 2050, and that
irrigated food production will increase by more than 50% over the same period (FAO, 2017a).
The necessary amounts of water for these developments are not available. FAO recognizes
that the amounts of water withdrawn by agriculture can only increase by 10%.
The 2030 Water Resources Group (2009) concluded that the world would face a 40% global
water deficit by 2030 under a business-as-usual scenario.
Water quality
Water quality has deteriorated as a result of pollution in nearly all major rivers in Africa, Asia
and Latin America. Nutrient loading, which is often associated with pathogen loading, are
among the most prevalent sources of pollution (UNEP, 2016).
Significant data gaps for wastewater remain. For example, reporting on the Sustainable
Development Goals (SDG) Indicator 6.3.1, the proportion of wastewater safely treated, shows
that 59% of domestic wastewater flow is collected and safely treated, but this is based on
data from only 79 countries, mostly high- and middle-income, and the data on industrial
wastewater are insufficient (United Nations, 2018). It has been estimated that only 8% of
industrial and municipal wastewater in low-income countries undergoes treatment of any
kind (Sato et al., 2013).
Globally, an estimated 80% of all industrial and municipal wastewater is released into the
environment without any prior treatment, with detrimental effects on human health and
ecosystems (WWAP, 2017). This ratio is much higher in least developed countries, where
sanitation and wastewater treatment facilities are grossly lacking.
About 380 billion m3 of water can be recovered from the annual volumes of wastewater
produced. This type of water recovery is expected to reach 470 billion m3 by 2030 and
574 billion m3 by 2050 (Qadir et al., 2020).
Recovering water, nutrients, precious metals and energy from waste streams are means
of delivering value added (WWAP, 2017). The full recovery of nitrogen, phosphorus and
potassium from wastewater can offset 13.4% of the global demand for these nutrients in
agriculture but current technologies of nutrient recovery from wastewater have yet to reach
100% efficiency levels (Fernández-Arévalo et al., 2017; Ward et al., 2018). Beyond nutrient
recovery and economic gains, there are critical environmental benefits, such as a reduction in
eutrophication (Mayer et al., 2016).
In Australia, for example, algal blooms associated with excessive nutrients in freshwater
systems cost US$116–155 million annually, including through major disruptions of water
supplies for livestock and urban areas, as well as fish kills (OECD, 2017a).
Facts and figures 3One study puts the value of wastewater at US$1.1 trillion, with that number expected to rise
to US$2 trillion by 2050 according to a model focusing on water reuse, energy, nutrients and
metals (Stacklin, 2012).
Extreme events
Over the period 2009–2019, floods caused nearly 55,000 deaths (including 5,110 in 2019
alone), affected another 103 million people (including 31,000 in 2019 alone) and caused
US$76.8 billion in economic losses (including US$36.8 billion in 2019 alone) (CRED, 2020).
Over the same period, droughts affected over 100 million people, killing over 2,000 people
more, and directly causing over US$10 billion in economic losses (CRED, 2020).
Globally, floods and extreme rainfall events have increased by more than 50% over the past
decade, occurring at a rate four times greater than in 1980 (EASAC, 2018). Climate change is
expected to further increase the frequency and severity of floods and droughts (IPCC, 2018).
Risk and resilience
Water shortages consistently rank among the global risks of greatest concern to policy-makers
and business leaders (World Economic Forum, 2019).
In a survey of 525 investors with US$96 trillion in assets, 45% reported exposure to substantive
risks from water insecurity – risks that threaten their reputation and license to operate, the
security of their supply chains, their financial stability, and their ability to grow. Among the
companies reporting exposure, the combined business value at risk topped out at US$425 billion
with about 40% of the risks anticipated to hit within the next 1–3 years (CDP, 2020).
The World Bank (2016a) estimated that regions affected by water scarcity could see their
growth rates decline by as much as 6% of GDP by 2050 as a result of losses in agriculture,
health, income and property – sending them into sustained negative growth.
Economic valuation of the environment and infrastructure
Significant values can be attributed to ecosystem services that relate to supporting resilience
or reducing risks. In 2019, environment-related risks accounted for three of the top five risks
by likelihood and four of the top five by impact (World Economic Forum, 2019). Most disaster
risks and costs are water-related.
The value of nature’s contribution to people outstrips other economic values. One estimate of
the notional economic value of nature’s contribution to people was US$125 trillion per year in
2011, around two-thirds higher than global GDP at that time. Only the water-related services
provided by nature are valued at US$29 trillion per year (Costanza et al., 2014).
The costs of inaction, in terms of ecosystem loss and degradation, are high. As reported by the
Organisation for Economic Co-operation and Development (OECD, 2019, p. 9), “between 1997
and 2011, the world lost an estimated US$4–20 trillion per year in ecosystem services owing to
land cover change and US$6–11 trillion per year from land degradation.”
4 THE UNITED NATIONS WORLD WATER DEVELOPMENT REPORT 2021 VALUING WATERBy 2030, investment in water and sanitation infrastructure will need to be around
US$0.9–1.5 trillion per year, roughly 20% of the total requirement for all types of
infrastructure investment (OECD, 2017b). About 70% of this total infrastructure investment
will be in the global South, with a large share in rapidly growing urban areas (GCEC, 2016).
In developed countries, large investments will be required for renovation and upgrade.
Investments in both grey and green water infrastructure have the potential to deliver a good
economic return, in addition to often unquantifiable social and human welfare returns.
There are some estimates of national water infrastructure value that can be implied from
projected benefits delivered. For example, in the USA, current national water infrastructure
capital needs are US$123 billion per year, with an aggregate economic impact of
US$220 billion in annual economic activity and 1.3 million jobs, and an added indirect benefit
of US$140 billion (The Value of Water Campaign, 2017). But these kinds of estimates are
not available for the majority of countries.
Some indications of global values can be implied from the costs of infrastructure deficits
or infrastructure failure. In 2015, the economic losses caused by water risks were
estimated at approximately US$500 billion annually (Sadoff et al., 2015).
In the USA, service disruptions put US$43.5 billion in daily economic activity at risk
(The Value of Water Campaign, 2017).
A recent World Bank study found that only 35% of utilities can cover operation and
maintenance costs through revenues generated by tariffs, and only 14% can cover all
economic costs related to service provision (Andres et al., 2019). Even fewer of these
utilities can cover the original capital costs, which are often on par or higher than operation
and maintenance costs (for instance, capital costs amount to an average of 49% of total
costs for water utilities in the United Kingdom (Kingdom et al., 2018)).
About half of global utilities use increasing block tariffs. They are especially popular in
Latin America (70% of the utilities), the Middle East and North Africa (74%), and East Asia
and the Pacific (78%). The uniform volumetric tariff is the next most common water tariff,
and used in many developed countries (44%). It is the dominant practice in Europe and
Central Asia (85%) (IBNet Tariffs database, 2018).
Valuing water supply, sanitation and hygiene (WASH)
services in human settlements
In 2017, 5.3 billion people (71% of the global population) used a safely managed
drinking water service – one located on premises, available when needed and free from
contamination. 3.4 billion people (or 45% of the global population) used safely managed
sanitation services – an improved toilet or latrine that is not shared, from which excreta
are safely disposed of in situ or treated off-site (WHO/UNICEF, 2019a).
Each year, it is estimated that approximately 829,000 people die from diarrhoea as a result
of unsafe drinking water, sanitation and hand hygiene. These causes represent 60% of all
deaths due to diarrhoea globally, including nearly 300,000 children under the age of five,
5.3% of all deaths in this age group (Prüss-Üstün et al., 2019).
Facts and figures 5Poor sanitation and hygiene, as well as unsafe drinking water, cause diarrhoeal disease
and environmental enteropathy, which inhibit nutrient absorption, resulting in undernutrition
(Teague et al., 2014). Roughly 50% of all malnutrition is associated with repeated diarrhoea
or intestinal worm infections as a direct result of inadequate water, sanitation and hygiene
(Prüss-Üstün et al., 2008).
An estimated 45% of all deaths of children under the age of five is from undernutrition
(United Nations, 2018). The economic cost of undernutrition is estimated to be up to
US$2.1 trillion (FAO, 2013a).
A recent assessment of the impact of unsafe WASH on childhood diarrhoeal disease
suggests that household connections to water supplies and higher levels of sanitation
coverage in communities lower risks of diarrhoeal morbidity. The assessment found that
piped water of higher quality and continuous availability to premises reduced diarrhoea
risk by 75%, compared to a baseline of unimproved drinking water. Sanitation interventions
reduced diarrhoeal risk by 25%, with evidence for greater reductions when high sanitation
coverage is reached, while interventions promoting handwashing with soap reduced these
risks by 30%, compared with no intervention (Wolf et al., 2018).
Hand hygiene is extremely important to prevent the spread of COVID-19 (WHO, 2020a).
Globally, over three billion people and two out of five health care facilities lack adequate
access to hand hygiene facilities (WHO/UNICEF, 2019b).
At the global level, 11% of maternal deaths, mostly in low- and middle-income countries, are
caused by infections linked to unhygienic conditions during labour and birth at home or in
facilities, and to poor hygiene practices in the six weeks after birth (WHO/UNICEF, 2019b).
Infections associated with unclean births may account for more than one million deaths
each year (WHO/UNICEF, 2019b). Basic hygiene practices during antenatal care, labour and
birth can reduce the risk of infections, sepsis and death of infants and mothers by up to 25%
(PMNCH, 2014).
WHO/UNICEF (2018) showed that 69% of schoolchildren had access to drinking water
(based on data from 92 countries), 66% to sanitation (in 101 countries) and 53% to hygiene
(in 81 countries). This equates to 570 million children lacking drinking water in schools,
620 million lacking sanitation and 900 million lacking hygiene. UNDP (2006) reported that
over 443 million school days are lost due to water-related illnesses.
Around 230 million people, mostly women and girls, spent more than 30 minutes per trip
collecting water from sources away from their home (WHO/UNICEF, 2017a). This puts
them at additional risk of attack or rape. Across 61 countries, women and girls were
responsible for carrying water in eight out of ten households. The United Nations Children’s
Fund (UNICEF) has calculated how much time women and girls spend carrying water every
day, which equals 200 million hours, or 8.3 million days, or 22,800 years (UNICEF, 2016).
It is estimated that at least US$6.5 billion is lost per year in working days due to a lack of
access to sanitation (WHO, 2012). In addition, almost 400,000 work-related deaths occur
each year from communicable diseases, which have the main contributing factors being
poor-quality drinking water, and poor sanitation and hygiene (WWAP, 2016).
Access to WASH in the workplace is also an issue that impacts gender equality and
women’s workplace productivity. It was shown that in the Philippines and Viet Nam, in
workplaces where WASH facilities were inadequate and assuming women would be
6 THE UNITED NATIONS WORLD WATER DEVELOPMENT REPORT 2021 VALUING WATERabsent for at least one day during their menstrual period for lack of such facilities, this would
equate to 13.8 million and 1.5 million workday absences, respectively, and US$13 million and
1.28 million in economic losses (Sommer et al., 2016).
The World Health Organization (WHO) estimated that the total economic losses associated
with inadequate WASH services amount to US$260 billion annually in 136 low- and middle-
income countries, which is roughly equivalent to an average annual loss of 1.5% of the
aggregate GDP of those countries (WHO, 2012).
It has been estimated that achieving universal access to safe drinking water, sanitation and
hygiene (SDG Targets 6.1 and 6.2) in 140 low- and middle-income countries would cost
approximately US$1.7 trillion from 2016 to 2030, or US$114 billion per year (Hutton and
Varughese, 2016).
According to research done across ten low- and middle-income countries, on average, 56% of
subsidies end up in the pockets of the richest 20%, while only 6% of subsidies find their way to
the poorest 20% (Andres et al., 2019). The 2019 World Water Development Report observed that
people living in informal settlements often pay 10–20 times more for their water, which comes
from suppliers such as water tankers (WWAP, 2019).
While it has previously been reported that returns on investment in sanitation, based on the
global averages, deliver over twice the return on investment compared to drinking water (WHO,
2012), new analysis by Hutton (2018), based on disaggregated data between rural and urban
areas, suggest that current benefit–cost ratios (BCRs) favour drinking water supply (with BCRs
of 3.4 and 6.8 for urban and rural areas respectively) over sanitation (with 2.5 and 5.2. for
urban and rural areas respectively).
These differences in BCRs between the two services and the differences in BCRs for each
service between urban and rural settings are possibly due to basic sanitation being generally
more expensive to provide than basic water supply (Hutton and Varughese, 2016), while both
are more costly in urban areas.
Food and agriculture
Although global food production has kept pace with population growth, close to 750 million
people (or 10% of the global population) were exposed to severe levels of food insecurity in
2019 (FAO/IFAD/UNICEF/WFP/WHO, 2020). Unfortunately, this number has increased even
further over the course of 2020 due to the COVID-19 pandemic and its economic impacts
worldwide.
Rainfed agriculture covers 80% of the world’s cropland and accounts for the major part (60%)
of food production (Rockström et al., 2007). Rainfed agriculture has a global water footprint of
5,173 km3 per year (Mekonnen and Hoekstra, 2011a).
Irrigated agriculture covers about 20% of cultivated lands, yet it accounts for 40% of food
production (Molden et al., 2010) (Table 5.1), and has a global water footprint of 2,230 km3
per year (Mekonnen and Hoekstra, 2011a).
The global water footprint related to crop production in the period 1996–2005 was 7,404 km3
per year, representing 92% of humanity’s water footprint (Hoekstra and Mekonnen, 2012).
Facts and figures 7Despite striking economic growth in the past, there are still 2.1 billion poor people, of whom
767 million people live in extreme poverty. Of all people living in poverty, 80% live in rural areas,
where agriculture continues to be the mainstay of their livelihoods (World Bank, 2016b).
Estimates based on comprehensive national and subnational data indicate that 40% of actually
irrigated area in the world is serviced by groundwater sources (Siebert et al., 2010).
With proper water accounting and the enforcement of strict withdrawal regulations, the
adoption of highly efficient irrigation systems could reduce non-beneficial water consumption
at the river basin level with more than 70% while maintaining the current level of crop
yields, enabling the reallocation of water to other uses, including environmental restoration
(Jägermeyr et al., 2015).
The global economic value of the ecosystem services provided by wetlands only was
estimated at US$26 trillion per year in 2011 (Costanza et al., 2014). However, much of the
irrigation development worldwide that occurred in the last decades was considered a priority
over environmental flows (Jägermeyr et al., 2017).
The full nutrient recovery from wastewater would offset more than 13% of the global demand
for these nutrients in agriculture. The recovery of these nutrients could result in a revenue
generation of US$13.6 billion globally (Qadir et al., 2020). Beyond the economic gains of
reusing wastewater to maintain or improve agricultural productivity, there are critical human
health and environmental benefits (FAO, 2010a).
The use of treated wastewater is becoming particularly appealing for agriculture in peri-urban
and urban settings. It is estimated that 380 km3 of wastewater is produced annually across the
world, which equals about 15% of agricultural water withdrawals. The irrigation potential of this
volume of wastewater stands at 42 million ha (Qadir et al., 2020).
Globally around 14%, in terms of economic value, of the food produced is lost from post-
harvest up to, but not including, the retail level (FAO, 2019c). Kummu et al. (2012) found that
the global production of lost and wasted food crops accounts for 24% of total freshwater
resources used in food crop production.
Sustainable diets are those that are healthy, have a low environmental impact, are affordable
and culturally acceptable (FAO, 2010b). Such diets involve a limited consumption of meat,
added sugars and highly processed foods, and eating a diversity of plant-based foods (Tilman
and Clark, 2014). Shifts towards sustainable diets could also reduce the use of water for food
production by about 20% compared to current diets (Springmann et al., 2018).
Energy, industry and business
The International Energy Agency (IEA) estimates that energy (primary energy and power
production) in 2014 was responsible for approximately 10% of total water withdrawals, of
which about 3% was consumed (IEA, 2016). The IEA also estimates that a similar amount
(about 10% of global water withdrawals) was used by the other industries.
Projected global water demand between 2000 and 2050 shows a 400% increase for
manufacturing and a 140% increase for thermal power generation (OECD, 2012). Another
study (2030 WRG, 2009) foresees almost a doubling of industrial water withdrawals to 2030,
reaching a percentage of 22% globally.
8 THE UNITED NATIONS WORLD WATER DEVELOPMENT REPORT 2021 VALUING WATERIn the last four years, even though the number of companies reporting water reduction
targets to the CDP (formerly the Carbon Disclosure Project) has close to doubled,
there is a nearly 50% increase in companies reporting higher water withdrawals with
expanding production, particularly in Asia and Latin America (CDP, 2018).
Water-related financial company losses of US$38.5 billion were noted in 2018. These
numbers may be larger, as at least 50 companies could not provide figures (CDP, 2018).
In 2019, the combined risk to business value was US$425 billion (CDP, 2020).
Globally, for industrial products the average virtual water content is 80L/US$ (Hoekstra
and Chapagain, 2007), with a wide range between countries. For example, in the USA it is
100L/US$, whereas in China and India it is between 20 and 25L/US$.
Regional perspectives
Sub-Saharan Africa
Africa’s freshwater resources are estimated to be nearly 9% of the world’s total
(Gonzalez Sanchez et al., 2020). However, these resources are unevenly distributed,
with the six most water-rich countries in Central and Western Africa holding 54% of
the continent’s total resources and the 27 most water-poor countries holding only 7%
(UNESCO Regional Office for Eastern Africa, 2020).
About 73% of the total population of Sub-Saharan Africa did not use safely managed
drinking water services in 2017 (WHO/UNICEF, 2019). An estimated 14% of Africa’s
population (about 160 million people) currently live under conditions of water scarcity
(Hasan et al., 2019), due in part to the uneven distribution of water resources as well as
inequalities in the access to clean and portable water services (UNEP, 2002).
The Pan-European region
The development of overarching frameworks such as the 2000 European Union
Water Framework Directive (European Parliament/Council of the European Union,
2000) demonstrates the increasing significance that is being placed on valuing water.
Nonetheless, efforts to value water, especially in a transboundary context, remain limited
in scope and often use different approaches.
The discernible approaches to valuing water quantitatively in the transboundary context
are more targeted on specific aspects of managing transboundary water resources, such
as flood management, disaster risk reduction (DRR), early-warning systems (EWS) and
ecosystem services.
Investment in data collection systems is recognized as being of vital importance and
while it comes at an additional cost, that cost can be compensated by the benefits of
effective cooperation.
The 2017 joint Adelphi and Regional Environmental Centre for Central Asia study noted
that “it is important not to neglect the indirect costs of suboptimal water management
because they demonstrate that the true value of water cooperation is far greater than the
direct economic benefits that can be derived from better water management” (Adelphi/
CAREC, 2017, p. VII).
Facts and figures 9Latin America and the Caribbean
Latin America and the Caribbean (LAC) possess an average water endowment per inhabitant
of close to 28,000 cubic metres per year, which is more than four times the world average of
6,000 m3/inhabitant/year (FAO, 2016).
Water stress in parts of the region has fuelled a number of conflicts, as various sectors,
including agriculture, hydroelectricity, mining and even drinking water and sanitation, are
competing over scarce resources.
Some of the major obstacles in securing effective allocation processes are connected to poor
regulation, missing incentives and/or lack of investment. All these factors ultimately reflect the
low value that is largely attributed to water resources in the region.
The average proportion of wastewater that is safely treated is just below 40%. About a quarter
of the river stretches in the region are affected by severe pathogenic contamination. The main
source of this kind of pollution is domestic sewage (UNEP, 2016).
Asia and the Pacific
The Asia and the Pacific region is home to 60% of the world’s population but has only 36% of
the world’s water resources, causing its per capita water availability to be the lowest in the
world (APWF, 2009).
Unsustainable water withdrawals are a major concern in the region, as some countries
withdraw unsustainable proportions of their freshwater supply – exceeding half of the total
water availability – and seven of the world’s 15 biggest abstractors of groundwater are in Asia
and the Pacific (UNESCAP/UNESCO/ILO/UN Environment, 2018). Research suggests that
groundwater use will increase 30% by 2050 (UNESCAP/UNESCO/ILO/UN Environment, 2018;
ADB, 2016).
In addition to the low levels of per capita water availability, high levels of water pollution
are observed in the region, with more than 80% of the wastewater generated in the region’s
developing countries not being treated (Corcoran et al., 2010).
The Arab region
In the Arab region, nearly 86% of the population, or nearly 362 million people, live under
conditions of water scarcity or absolute scarcity (UNESCWA, 2019a).
Fourteen countries in the region use more than 100% of their available freshwater resources,
which strains efforts to achieve the SDG Target 6.4 that aims to reduce the number of people
facing water stress (UNDESA, n.d.b).
This scarcity has increased dependency on transboundary waters, non-renewable groundwater
resources and non-conventional water resources.
The use of treated wastewater has been expanding in the region. More than two thirds of
collected wastewater in the Arab region is safely treated at the secondary or tertiary level.
In most countries of the Arabian Peninsula, treated wastewater is used for greenbelts and
nature reserves, and to combat land degradation (UNESCWA, 2017).
10 THE UNITED NATIONS WORLD WATER DEVELOPMENT REPORT 2021 VALUING WATERWhile agriculture represents only 7% of the regional GDP, the sector consumes 84% of
all freshwater withdrawals in the region (UNESCWA, 2019a). Although the value of this
water is not well reflected in the pricing and export of agricultural commodities, the
sector employs approximately 38% of the region’s population and produces 23% of GDP
in Arab Least Developed Countries (UNESCWA, 2020a). This renders water for crops and
livestock essential for sustaining rural livelihoods, income and food security in some of
the most vulnerable parts of the region.
Water service providers are under increasing pressure to meet the needs of growing cities
and informal settlements, including around 26 million of those that are forcibly displaced
(refugees and internally displaced persons) in the Arab region (UNESCWA, 2020b).
This leads to additional costs and has many health implications, particularly given the
need to stem the transmission of COVID-19.
Northern Africa and Western Asia, which largely overlaps with the Arab region, have the
second-highest rate of water expenditures. Nearly 20% of the population spent more than
2 to 3% of their household expenditures on WASH services (United Nations, 2018).
Knowledge, research and capacity development as
enabling conditions
A literature review of economic studies assessing the returns on investment from
hydrological monitoring programmes found that a dollar of investment in public water
data systems generates at the median four dollars in social benefits (Gardner et al., 2017),
which highlights the socio-economic and management value of hydrological data.
Facts and figures 11Prepared by WWAP | Engin Koncagül, Michael Tran and Richard Connor
This publication is produced by WWAP on behalf of UN-Water.
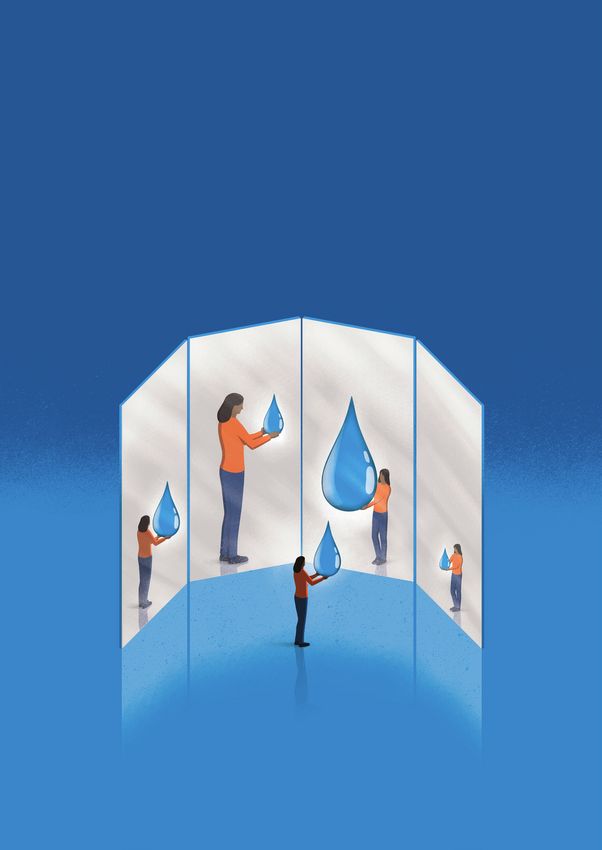
Cover artwork by Davide Bonazzi
© UNESCO 2021
The designations employed and the presentation of material throughout this publication do not imply the expression
of any opinion whatsoever on the part of UNESCO concerning the legal status of any country, territory, city or area or
of its authorities, or concerning the delimitation of its frontiers or boundaries. The ideas and opinions expressed in this
publication are those of the authors; they are not necessarily those of UNESCO and do not commit the Organization.
For further information concerning copyrights and licensing, please refer to the full report available at
www.unesco.org/water/wwap.
UNESCO World Water Assessment Programme
Programme Office for Global Water Assessment
Division of Water Sciences, UNESCO
06134 Colombella, Perugia, Italy
Email: wwap@unesco.org
www.unesco.org/water/wwap
We acknowledge with gratitude the financial support provided by the Government of Italy and Regione Umbria.
SC-2021/WS/3You can also read