KIEL POLICY BRIEF Gabriel Felbermayr, Steffen Gans, Hendrik Mahlkow, and Alexander Sandkamp - Kiel Institute for the World Economy
←
→
Page content transcription
If your browser does not render page correctly, please read the page content below

KIEL
POLICY BRIEF
Gabriel Felbermayr, Steffen Gans, Hendrik Mahlkow,
and Alexander Sandkamp
Decoupling
Europe
No. 153 July 2021
The COVID-19 pandemic revealed the vulnerability of international value chains in the face of global
shocks. This has triggered a political discussion regarding a possible reshoring of vulnerable supply
chains back home. The aim is to reduce dependencies on foreign suppliers and thus improve crisis
resilience of the domestic economy.
The debate is also rooted in the growing dependence on Asian suppliers and the colliding political
and ideological systems between China and the West.
Unilateral decoupling of the EU from China (a doubling of trade costs) would reduce real income in the
EU on average by 0.8 %. In terms of GDP in 2019, this equals a permanent loss in real income of
131.4 bn EUR. Should China retaliate, real income would fall by 1.0 % (170.3 bn EUR). With its ex-
tremely interconnected economy, real income in Germany would even decline by 1.4 % (48.4 bn EUR).
China would also lose from such a trade war, with real income declining by 1.3 %.
Should the EU increase its trade barriers against all its non-European trading partners, real income
in the Union would fall by 3.5 % or 584.3 bn EUR in case of a unilateral increase and by 5.3 % or
873.1 bn EUR in case the rest of the world responds by also raising trade barriers.
Kiel Institute for the World Economy
ISSN 2195–7525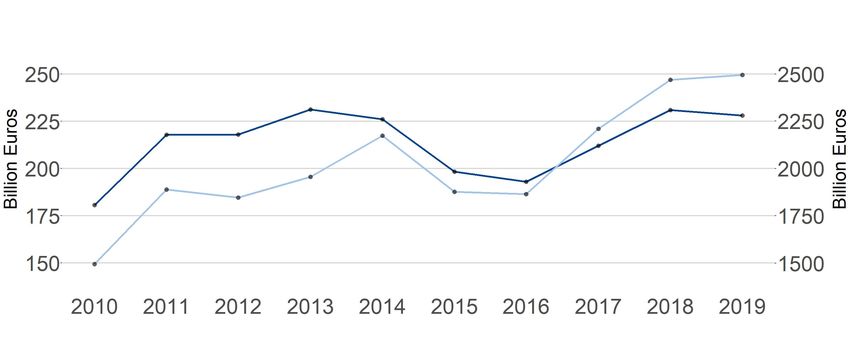
KIEL POLICY BRIEF NO. 153 | JULY 2021
OVERVIEW/ÜBERBLICK
The COVID‐19 pandemic revealed the vulnerability of international value chains in the face of global
shocks. This has triggered a political discussion regarding a possible reshoring of vulnerable supply
chains back home. The aim is to reduce dependencies on foreign suppliers and thus improve crisis
resilience of the domestic economy.
The debate is also rooted in the growing dependence on Asian suppliers and the colliding political
and ideological systems between China and the West.
Unilateral decoupling of the EU from China (a doubling of trade costs) would reduce real income in
the EU on average by 0.8 %. In terms of GDP in 2019, this equals a permanent loss in real income of
131.4 bn EUR. Should China retaliate, real income would fall by 1.0 % (170.3 bn EUR). With its
extremely interconnected economy, real income in Germany would even decline by 1.4 % (48.4 bn
EUR). China would also lose from such a trade war, with real income declining by 1.3 %.
Should the EU increase its trade barriers against all its non‐European trading partners, real income
in the Union would fall by 3.5 % or 584.3 bn EUR in case of a unilateral increase and by 5.3 % or
873.1 bn EUR in case the rest of the world responds by also raising trade barriers.
Keywords: European Union, China, Germany, Trade, Global Value Chains
Die COVID‐19 Pandemie hat die Verletzbarkeit internationaler Wertschöpfungsketten in Folge
globaler Schocks offen gelegt. In der politischen Diskussion werden seitdem Rufe nach einer
Renationalisierung vulnerabler Lieferketten laut, um die Abhängigkeit von ausländischen Zulieferern
zu verringern und die heimische Wirtschaft krisenfester zu machen.
Hintergrund dieser Debatte ist auch die zunehmende Abhängigkeit von asiatischen Zulieferern
verbunden mit zunehmenden politischen und ideologischen Spannungen zwischen China und dem
Westen.
Eine einseitige Abkopplung der EU von China würde die Wohlfahrt über alle EU‐Mitgliedsstaaten im
Durchschnitt um 0,8 % reduzieren. Gemessen am BIP 2019 entspräche dies einem dauerhaften
Einkommensverlust in Höhe von 131,4 Mrd. EUR. Sollte China zurückschlagen, so würde das Realein‐
kommen um 1 % sinken (170,3 Mrd. EUR). Aufgrund seiner starken internationalen Verflechtungen
wäre Deutschland mit einem Einkommensverlust in Höhe von 1,4 % (48,4 Mrd. EUR) besonders stark
betroffen. China würde durch solch einen Handelskrieg Einkommenseinbußen in Höhe von 1,3 %
erleiden.
2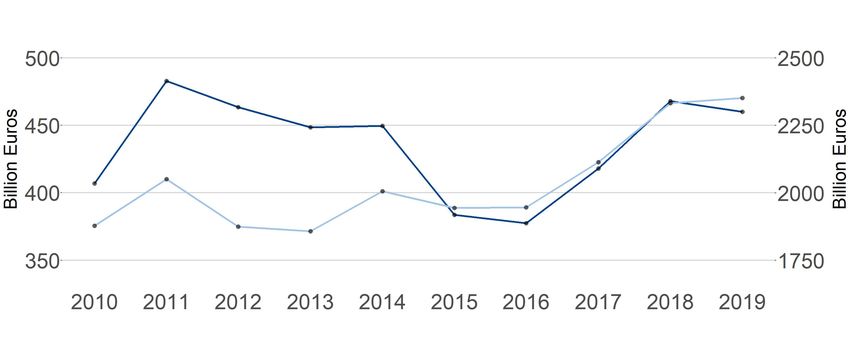
KIEL POLICY BRIEF NO. 153 | JULY 2021
Sollte die EU ihre Handelsbarrieren gegenüber allen außereuropäischen Handelspartnern erhöhen,
so wäre das Realeinkommen in der Union 3,5 % bzw. 584,3 Mrd. EUR niedriger. Im Falle eines
Handelskriegs würde sich dieser Verlust auf 5,3 % bzw 873,1 Mrd. EUR erhöhen.
Schlüsselwörter: Europäische Union, China, Deutschland, Handel, Globale Wertschöpfungsketten
Gabriel Felbermayr Steffen Gans
Kiel Institute for the World Economy Kiel Institute for the World Economy
Kiellinie 66 Kiellinie 66
24105 Kiel, Germany 24105 Kiel, Germany
Tel.: +49 431 8814 235 Tel.: +49 431 880 6383
E‐Mail: felbermayr@ifw‐kiel.de E‐Mail: steffen.gans@ifw‐kiel.de
Hendrik Mahlkow Alexander Sandkamp
Kiel Institute for the World Economy Kiel Institute for the World Economy
Kiellinie 66 Kiellinie 66
24105 Kiel, Germany 24105 Kiel, Germany
Tel.: +49 431 8814 499 Tel.: +49 431 8814 225
E‐Mail: hendrik.mahlkow@ifw‐kiel.de E‐Mail: alexander.sandkamp@ifw‐kiel.de
The responsibility for the contents of this publication rests with the authors, not the Institute. Any comments
should be sent directly to the authors.
3KIEL POLICY BRIEF NO. 153 | JULY 2021
Decoupling Europe
1 Introduction: COVID-19 as a catalyst enforcing
renationalization of value chains
The COVID-19 pandemic has caused a severe economic crisis both in Europe and globally. In 2020
European GDP fell by about 6.3 %, which is the largest collapse in post-war history (European
Commission, 2020). Globally, GDP contracted by 3.3 % in 2020. On the one hand, the Covid-
19 disease and lockdowns of various forms and guises have caused a rapid decline in demand both
in domestic and export markets. On the other hand, production shutdowns and, increasingly, export
restrictions around the globe have led to supply shortages for both consumer products and intermediate
goods. This was particularly evident in the case of medical supplies such as face masks, gloves,
disinfectants and lung ventilators, which were no longer available in sufficient quantities during the
beginning of the pandemic (Fuchs et al., 2020), but is currently very much the case in the area of
vaccine production and, increasingly, also in other areas, from wood to containers.
The revealed vulnerability of international value chains in the face of global shocks has lead to
a political discussion regarding a possible reshoring of vulnerable supply chains back home. The aim
is to reduce dependencies on foreign suppliers and thus improve the crisis resilience of the domestic
economy. Attention among economists is awakening as well. In a survey by Blum et al. (2020), 38 % of
German economics professors surveyed, supported shifting value creation back to the EU or Germany.
Only 19 % are in favor of greater international diversification. Triggered by the pandemic, the debate
is rooted in the growing dependence on Asian suppliers and the colliding political and ideological
systems between China and the West.1 It is thus also linked to fears of growing Chinese influence,
for example through increased foreign direct investment in Europe (Felbermayr et al., 2019a,b).
It is, however, unclear how such a reintroduction of domestic manufacturing can be implemented.
Although an increase in EU tariffs against third countries would be feasible in principle, it would be
incompatible with the EU’s commitments towards the WTO. More likely, manipulation of international
trade flows would be achieved by introducing additional non-tariff barriers (NTBs). These include
a wide spectrum of policy instruments, some of which strongly affect trade. One example are new
rules on public procurement, requiring that certain goods must be provided by at least one European
producer (Joachimsen, 2020). Alternatively, import quotas, tax breaks, import bans, or subsidies for
European suppliers of certain goods are also conceivable.
1
Cf. Merz, F. (January 8, 2021), “Wir haben den Machtwillen Chinas in Europa massiv unterschätzt...”, [Tweet],
Twitter, https://twitter.com/_FriedrichMerz/status/134762588505100698.
4KIEL POLICY BRIEF NO. 153 | JULY 2021
This policy brief shows that decoupling the EU from China and the world economy would be very
costly in terms of economic value added.2 In contrast, the alleged advantages of a higher degree of
autonomy or sovereignty are hard to quantify and may well be illusionary, in particular if reshoring leads
to a concentration of risk in a smaller number of markets. This brief contributes to a recently emerging
strand of literature investigating implications of the call for reshoring value chains.3 It is structured
as follows: Section 2 starts with a brief description of recent developments in European trade with
particular emphasis on China. Section 3 provides a scenario analysis capturing the economic effects
of an isolation of the EU and possible cascading effects through trade partner reactions. Section 4
concludes.
2 Developments in EU trade
The world financial crisis of 2009 brought a period of strong and consistent export growth to an
abrupt end. In the immediate aftermath of the trade collapse, the EU’s exports recovered by around
21 % between 2010 and 2011; however, in the following years trade expanded only sluggishly. From
2014 to 2016 exports even decreased; see Figure 1.
Figure 1: EU exports to China and the world, in bn EUR
Note: Exports to China - left scale, light blue. Exports to RoW - right scale, dark blue.
Source: Data from UN Comtrade database.
Exports to China behaved broadly similarly, although with a more pronounced momentum.4 While
exports to China declined in 2012 despite overall export growth, the years 2013 and 2014 were
characterized by higher growth than overall EU exports. The average annual growth rate of exports
2
In doing so, the policy brief partly borrows from Felbermayr et al. (2020).
3
See for example D’Aguanno et al. (2021), Miroudot (2020). Also see the recent paper by Eppinger et al. (2021),
which studies additional barriers only in input trade while keeping final goods trade unimpaired.
4
For an extensive overview of current trade and investment relations between China and the EU, the reader is referred
to Garcia-Herrero et al. (2020).
5KIEL POLICY BRIEF NO. 153 | JULY 2021
to China during the ten years considered is around 7 % compared to 3 % for total EU exports. Between
2010 and 2019, exports to China increased by nearly 67 % compared to a 26 % increase in overall
exports. In 2019, EU exports to China amounted to 250 bn EUR, accounting for 11 % of total EU
exports (2,281 bn EUR).
Taking a look at EU imports over the same time frame, one can observe an average annual
increase in imports from China of slightly above 2.7 %, compared to an average annual increase in
total imports of around 1.8 % (Figure 2). The recovery years after 2009 are once again characterized
by stronger growth dynamics for total imports as well as for imports from China. This was followed
by a steady decrease in most years up until 2016. From 2017, imports started to recover, reaching a
total value of 2,300 bn EUR (470 bn EUR from China) in 2019. Relative to 2010, this constitutes
an overall growth rate of about 25.3 % for imports from China but only 13.1 % growth in overall
imports.
Figure 2: EU imports from China and the world, in bn EUR
Note: Imports from China - left scale, light blue. Imports from RoW - right scale, dark blue.
Source: Data from UN Comtrade database.
3 Economic effects of decoupling the EU
In the following, we examine how decoupling of the EU could affect trade, output and real income
inside the EU and outside. In addition to average effects, we also show results for individual member
states, with a focus on the largest economy in the EU, Germany. We also pay special attention to the
behavior of China as one of the EU’s most important trading partners and a global value chain hub,
transmitting shocks throughout the global production and trade network. Note that our analysis sheds
lights on the costs of decoupling. It does not model the risks that may be associated to international
production networks and that decoupling may actually reduce. Eppinger et al. (2021) have used a
related model and have investigated supply shocks in foreign countries. They demonstrate that the
6KIEL POLICY BRIEF NO. 153 | JULY 2021
gains from decoupling are by about a factor ten smaller than the costs. Hence, we think that focusing
on costs, as we do in the present paper, is a reasonable approximation.5
The analysis is carried out with the help of the “Kiel Institute Trade Policy Evaluation” model
(“KITE model”) which is based on the trade model proposed by Caliendo and Parro (2015). This
is a computable general equilibrium model of international trade that pays special attention to the
intra- and international input–output linkages which are important characteristcs of our modern world
economy, where countries are strongly linked through global value chains. The model quantifies the
effects of changes in bilateral trade barriers on 65 sectors in 141 countries, covering more than 90 %
of economic activity worldwide. We use standard sources of data to calibrate this model. The global
input-output-database GTAP 10 provides us with detailed information about intra- and international
input-output linkages and, thus, about global value chains. Furthermore, standard sources such as
the UN Comtrade database for trade data as well as WITS and MacMap for tariff data are used to
define the baseline scenario (status-quo) in our model. Therefore, direct and indirect trade effects
such as trade diversion and real income effects can be quantified and international value chains are
explicitly taken into account.
The model is used to examine through several scenarios how a decoupling of the EU affects
trade and real income in the EU, Germany and their main trading partners, first and foremost China.
Decoupling is modelled through an increase in the use of NTBs. These are chosen for the scenario
analysis because they are both feasible in principle and have been shown to cause significant trade
destruction (Bratt, 2017; Ghodsi et al., 2017; Kinzius et al., 2019). Following Flach and Steininger
(2020) and Sforza and Steininger (2020), all scenarios model an increase in NTBs by 100 percentage
points, which amounts to a doubling of barriers. As shown in Table 1, increasing NTBs to such an
extent results in a sharp decline in international trade. Self-sufficiency is not reached though, since
many EU countries rely upon certain raw materials which can only be covered through imports.6
3.1 Overview of the four scenarios
Scenario I simulates a unilateral decoupling of the EU from the rest of the world (RoW). This is
achieved by an increase in (a doubling of) the EU’s NTBs on imports, while exports remain unaffected.
Scenario II, additionally, assumes that the rest of the world retaliates with import restrictions by also
doubling their levels. As a consequence, both EU exports and imports are subject to higher NTBs.
The remaining two scenarios simulate decoupling from China. Specifically, Scenario III assumes that
the EU doubles its non-tariff trade barriers on imports from China only. Finally, Scenario IV examines
5
Also see Sforza and Steininger (2020) or D’Aguanno et al. (2021) who come to a similar conclusion.
6
For this reason, import restrictions on oil and gas were not increased in the scenarios.
7KIEL POLICY BRIEF NO. 153 | JULY 2021
the possibility of a trade war between the EU and China, in which case all bilateral trade between the
EU and China (i.e. exports and imports) becomes subject to a doubling of NTBs.
While Table 1 reports the change in EU trade, Tables 2 and 3 illustrate the average real income
loss and output decline in the four scenarios across all EU member states as well as for Germany. Not
surprisingly all scenarios clearly indicate negative effects following decoupling of the EU and possible
retaliation measures by third countries.
Scenario II - decoupling of the EU in combination with retaliation from trading partners - causes
the highest trade reductions between the EU and its trading partners. In this scenario, EU imports from
China (Rest of the world) decline by 83.6 % (84.1 %), whereas exports even fall by 89.1 % (87 %).
Correspondingly, trade within the EU increases by 12.9 %. Consequently, real income declines by 5.3
(6.9) % in the EU (Germany). Relative to GDP in 2019, this amounts to a drop in income of 873.1
bn EUR (236.7 bn EUR for Germany). Even without retaliation, unilateral decoupling as modeled in
Scenario I would have a strong negative impact on trade and consequently on real income in the EU
(3.5 % or 584.3 bn EUR) and its largest economy (3.3 % or 114.5 bn EUR).
Table 1: Trade effects for the EU 28
Source: Authors’ own calculations.
Table 2: Change in EU real output and real income following decoupling
Change in income based on GDP 2019 for EU-28. Source: Data from Eurostat database, authors’ own calculations.
Table 3: Change in Germany’s real output and real income following decoupling
Change in income based on GDP 2019. Source: Data from Eurostat database, authors’ own calculations.
8KIEL POLICY BRIEF NO. 153 | JULY 2021
Scenarios III and IV investigate the expected loss of a decoupling from China. Unilateral imposition
of NTBs by the EU against China would reduce European (German) real income by 0.8 % (0.9 %). In
terms of GDP in 2019, this amounts to an income loss of 131.4 bn EUR for the EU (32.3 bn EUR for
Germany). In case China retaliates (Scenario IV), the German decline in real income would amount to
1.4 % (48.4 bn EUR), while EU real income would fall by 1 % (170.3 bn EUR). Germany, therefore,
seems to react more strongly to NTBs imposed against its exports than the EU average. This is not
surprising given the country’s strong export orientation.
Real income effects for China are reported in Figure 3. It can be seen that China would lose from
a trade war with the EU, which would lead to a real income reduction of 1.3 % (Scenario IV). If NTBs
were imposed unilaterally by the EU against China, Chinese real income would fall by 0.7 % (Scenario
III). Interestingly, China would lose more in Scenario I (1 %, complete unilateral decoupling of the
EU) than in Scenario III. European decoupling would lead to an increase in the cost of intermediates
in the EU. This cost increase is then passed on along the value chain and increases the price of EU
exports, which are in turn used as inputs in other countries. The results, therefore, emphasize the
role global value chains play in modern economies.
Figure 3: Real income losses in the most important trading partners of the EU
−7.5
Real income change in %
−5.0
−2.5
0.0
n
es
a
na
a
a
ey
a
ay
nd
pa
re
ad
di
si
at
rk
w
hi
la
us
In
Ko
Ja
an
or
St
C
Tu
er
R
N
C
itz
h
d
ut
te
Sw
So
ni
U
Scenario I Scenario II Scenario III Scenario IV
Scenario I: Complete Unilateral Decoupling of the EU. Scenario II: Complete Reciprocal Decoupling of the
EU. Scenario III: Unilateral Decoupling of the EU vis-à-vis China. Scenario IV: Trade War EU-China.
Source: Authors’ own calculations.
9KIEL POLICY BRIEF NO. 153 | JULY 2021
Figure 3 also reports real income losses for the largest trading partners of the EU. Focusing on
Scenario I, the highest losses can be observed for Switzerland (6.5 %) and Norway (2.2 %). Both
countries are strongly integrated into the European trade network through the European Free Trade
Association (EFTA) and are thus highly dependent on the EU’s trade policies. Russia and Turkey as
the EU’s neighbors would also be strongly affected. Within the EU, small countries such as Malta,
Luxembourg and Belgium would be hit hardest (Figure 4).
Figure 4: Real income losses of the EU member states (plus UK), sorted by real income loss in Scenario II.
−20
Real income change in %
−15
−10
−5
0
Fr nia
rtu e
ro al
ia
ng ly
Po om
G and
Sp e
A ain
Lu en ia
m ark
ov g
ed a
C en
La us
lg a
N in ria
r d
er ds
Es any
un ia
z y
th ia
ov ia
lg a
M m
Ire lta
nd
C gar
Po c
ec
Sl our
Sw aki
Bu tvi
he n
Be eni
Ki Ita
g
at
D ustr
H ton
Li ech
Sl an
iu
an
r
G lan
a
a
et la
la
a
d
xe m
yp
re
m
l
om
u
b
C
F
R
d
te
ni
U
Scenario I Scenario II Scenario III Scenario IV
Scenario I: Complete Unilateral Decoupling of the EU. Scenario II: Complete Reciprocal Decoupling of the
EU. Scenario III: Unilateral Decoupling of the EU vis-à-vis China. Scenario IV: Trade War EU-China.
Source: Authors’ own calculations.
10KIEL POLICY BRIEF NO. 153 | JULY 2021
3.2 Taking a closer look at the scenarios
Scenario I: Complete Unilateral Decoupling of the EU
Scenario I simulates the unilateral increase in EU NTBs against imports from the rest of the world.7
This means that the EU member states double their bilateral non-tariff trade barriers against third
countries in all sectors (except oil and gas).8 European exports and trade among EU member states
remain unaffected.
The effects of this unilateral European decoupling are shown in Tables 1 and 2 (Scenario I) for
EU countries and in Table 3 for Germany. Not surprisingly, EU imports from China (RoW), fall
dramatically by 66.7 % (62.5 %) following the imposition of NTBs on EU imports. In addition, and
perhaps less straightforward, EU exports to China (Row) also decline on average by 59 % (54.2 %).
The increase in the price of imports leads to production being shifted back to Europe. However,
this results in a decrease in specialization and thus to reduced productivity, so that products are
produced at higher costs than is currently the case. More expensive intermediate products (both due
to more expensive imports and due to the substitution of previously imported intermediate products
with more expensive domestic products) lead to additional costs and thus to rising prices, reducing
the competitiveness of EU producers and thus exports. Despite a trade increase within the European
Union of 10.2 %, output in the EU (price-adjusted) would fall by 3 %, leading to a 3.5 % fall in real
income.9 Real income in the EU would permanently be 584.3 bn EUR lower than in a world without
these additional NTBs (measured in GDP 2019).
Real income losses in Scenario I are less than 5 % in most of the EU countries (Figure 4). In
Germany, real income would drop by 3.3 %. However, as small economies are particularly dependent
on foreign trade (D’Aguanno et al., 2021), countries such as Malta (19.3 %), Luxembourg (10.5 %)
and Belgium (10.1 %) experience the most severe negative impact.
Outside the EU, the Union’s trading partners would face average income losses of 0.9 % in Scenario
I. Countries on the European continent that maintain close trade relations with the EU are particularly
affected (Figure 3). This applies first and foremost to Swtzerland and Norway, but also to Iceland
and Liechtenstein (4.6 %, both not shown).10 The Balkan states such as Montenegro and Bosnia and
7
The UK is counted as an EU country in the scenarios, as the country’s future trade relations cannot yet be clearly
depicted in the model.
8
Although the European continent has certain oil and gas reserves, it can be assumed that the EU will not be able
to cover its needs exclusively through its own production. The trade barriers for these goods therefore remain
unchanged in the analyzed scenarios.
9
This is an average weighted by the GDP of the member countries.
10
Since all four countries are members of the EFTA and Iceland and Liechtenstein are also in the European Economic
Area, it would be likely that these states would be excluded from the increased trade barriers. Nevertheless, an
increase in non-tariff trade barriers against these countries would be possible in principle and is therefore taken into
account accordingly in the scenario analysis.
11KIEL POLICY BRIEF NO. 153 | JULY 2021
Herzegovina are also severely affected (but not shown), with real income losses averaging 4.3 %.11
Ukraine is also expected to see a real income decline of 3.7 %.
In addition to the countries closely linked to the EU, oil and gas exporting countries such as Qatar
(3.9 %) and Kuwait (3.4 %) are among the losers of a protectionist EU trade policy. Although an
increase in import barriers against oil and gas has been explicitly ruled out, trade barriers against
refined petroleum products cause a decline in the export of these goods, and those have a higher
value-added than raw products. Although the export of crude oil and natural gas increases in the
simulation, there is a shift of value-added in the further processing and refining of raw materials from
the exporting countries towards the EU.12
The EU’s largest trading partners would also lose out, albeit to a much lesser extent. China and
the US, for example, are expected to suffer real income losses of 1 % and 0.3 %, respectively. Russia
(1.2 %), Turkey (2 %), Japan (0.4 %) and the Republic of Korea (1 %) also lose. Large emerging
economies such as India (0.9 %) and Brazil (0.5 %) are not spared either. Overall, real income is
falling in more than 96 % of the countries analyzed. The EU is therefore not only harming itself, but
also the rest of the world.
Scenario II: Complete Reciprocal Decoupling of the EU
Against the backdrop of the current trade conflicts between the EU, the US and China, it is unlikely
that European trading partners will readily accept unilateral import restrictions by the EU. Scenario II
therefore examines how countermeasures by non-European trading partners affect real income in the
EU and Germany. Specifically, in this scenario, it is assumed that the rest of the world also imposes
import restrictions against exports originating from the EU. This is simulated by doubling the NTBs
in all sectors (excluding oil and gas).
An imposition of NTBs against EU exports makes European products more expensive in destination
countries. Consequently, in Scenario II, EU exports to China (RoW) fall by 89.1 % (87 %) relative to
a world without any additional trade barriers (Table 1). Compared to Scenario I, imports also take an
additional hit and are 83.6 % (China) and 84.1 % (Row) lower than in the baseline scenario. Trade
within the EU increases by 12.9 % relative to a scenario where all NTBs are left unchanged.
The real income effects arising from such a trade war are again reported in Tables 2 and 3.
Across the EU, real income falls by an average of 5.3 %, or 873.1 bn EUR in this scenario (Table 2).
Two-thirds of EU member states suffer from real income losses higher than 5 % (Figure 4). Ireland
11
These countries are not considered separately in the input-output tables, so that only an aggregated value can be
presented here.
12
In the event of an increase in EU import barriers also against oil and gas, real income in the exporting countries
concerned would decline even further.
12KIEL POLICY BRIEF NO. 153 | JULY 2021
is most heavily affected, facing a real income loss of 23.2 %. It is followed by Malta (15 %) and
Belgium (9.3 %). The newer Eastern European members of the EU Slovenia (7.8 %), Lithuania (7.6
%), the Czech Republic (7.3 %), Estonia (7 %) and Hungary (7.3 %) also pay a high price induced
by retaliation measures. In contrast to these, Romania (3 %) and Croatia (3.7 %) are least affected
within the European Union.
As a result of the more difficult export conditions, output in Germany would fall by 5.8 %.
Compared to the output decline of 3.8 % observed in Scenario I, it may seem surprising at first
glance that the import restrictions against the EU only reduce output in Germany by two additional
percentage points. This is partly due to the fact that restrictions in the rest of the world make those
intermediate products that non-European producers import from the EU more expensive. German
industry is thus gaining competitiveness on the European market against non-European producers.
Nevertheless, total real income in Germany falls by 6.9 % in this scenario.
In the rest of the world, the average real income loss rises to 1.5 %. With declines in real income of
9.1 % and 6.3 % respectively, Switzerland and Norway are once again most severely affected. Russia
would also suffer significantly from the imposition of NTBs on exports from the EU, with real income
declining by 4.9 %. It is followed by Turkey, which would experience a real income loss of 3.7 %.
Scenario III: Unilateral Decoupling of the EU vis-à-vis China
The third scenario simulates decoupling from China by assuming an increase in NTBs on EU imports
from China only. In this scenario, EU imports from China fall by 81.4 % (Table 1) or around 400 bn
USD (Figure 5). The resulting increase in the cost of intermediate products reduces EU exports to
China by 15.1 %. Exports to the rest of the world fall by 6.2 %. As illustrated in Figure 6, exports
to all of the EU’s major trading partners fall. Even though NTBs against other countries remain
unchanged, EU imports from the rest of the world also decline by 8 % as EU output falls by 0.6 %
(Table 2). However, there is also some evidence for import diversion, as EU imports from countries
such as the US, Switzerland, Russia and Norway increase (Figure 5). The Union would also trade
more with itself, as real intra-EU trade would increase by 1.9 %.
Following this decline in trade, the EU is looking at an average real income loss of 0.8 % (131.4
bn EUR, Table 2). Real income in China would decline to a similar extent, by 0.7 %. The European
real income loss induced by Scenario III makes up nearly one-fourth of the overall loss in Scenario I,
pronouncing the strength of the interconnections between China and the EU economies.
Real income in Germany would decline by 0.9 % in this scenario. The aforementioned smaller
European countries Estonia (2 %), Latvia (1.3 %), Belgium (1.3 %), Luxembourg (1.3 %) and also
Denmark (1.2 %) appear within the strongest affected economies under Scenario III. They are led
13KIEL POLICY BRIEF NO. 153 | JULY 2021
by Malta with a loss of 6.5 %. The least affected countries across the largest economies inside the
EU are Portugal (0.1 %) and Italy (0.15 %), similar to Slovakia (0.1 %) and Cyprus (0.2 %) which
are the least affected among the smaller countries. France and the UK, in line with Germany, suffer
significantly more from the decoupling from China with losses of 0.8 % and 0.9 %, respectively.
Unsurprisingly, the rest of the world (without China) would only be mildly affected, with real
income falling by 0.1 % on average. This decline in real income is likely to result from the increasing
price of EU exports which is a consequence of the increased cost of intermediates imported from
China by the EU as well as the shift to less efficient production within the Union. With a real income
increase of 0.08 % for India, 0.05 % for Turkey, 0.04 % for the US and South Korea, 0.03 % for
Canada and Japan, some countries could even gain from a protectionist EU policy against China.
Figure 5: Import change for EU’s top trading partners (Scenarios III and IV)
−400,000
−300,000
in m. US $
−200,000
−100,000
0
es
nd
a
ay
na
si
at
w
la
hi
us
or
St
er
C
R
N
itz
d
te
Sw
ni
U
Scenario III Scenario IV
Scenario III: Unilateral Decoupling of the EU vis-à-vis China. Scenario IV: Trade War EU-China.
Source: Authors’ own calculations.
14KIEL POLICY BRIEF NO. 153 | JULY 2021
Figure 6: Export change for EU’s top trading partners (Scenarios III and IV)
−300,000
in m. US $
−200,000
−100,000
0
nd
n
a
es
na
pa
si
at
la
hi
us
Ja
er
St
C
R
itz
d
te
Sw
ni
U
Scenario III Scenario IV
Scenario III: Unilateral Decoupling of the EU vis-à-vis China. Scenario IV: Trade War EU-China.
Source: Authors’ own calculations.
Scenario IV: Trade War EU-China
Scenario IV builds on Scenario III and assumes that China responds to European protection by in-
creasing NTBs against exports from the EU. In this scenario, EU exports to China (RoW) are 92.5 %
(11.7 %) lower than in a world without a trade war between the EU and China (Table 1). EU imports
from China (Row) fall by 82.7 % (11.8 %) compared to the baseline scenario. Trade within the Union
would increase by 2 %.
Relative to Scenario III the magnitude of the real income loss for the European Union only increases
by 0.2 percentage points (to 1 % or 170.3 bn EUR). Given the EU’s trade deficit with China, this
small change is perhaps not surprising. Imports from China simply play a more important role for the
EU than exports.
For Germany for which China is an important export market, the magnitude of the real income
loss is larger in this scenario, amounting to 1.4 %. Germany is thus among the most affected countries
in Scenario IV, alongside the UK (1.3 %), but otherwise significantly smaller economies like the Czech
Republic (1.3 %), Denmark (1.3 %), Belgium (1.2 %) and the Netherlands (1.2 %). Surprisingly,
15KIEL POLICY BRIEF NO. 153 | JULY 2021
France (0.8 %), Portugal (0.3 %) and Italy (0.5 %) are positioned more comfortably and experience
smaller losses.
China would lose from such retaliation, as real income losses increase to 1.3 %. The loss for other
non-European trading partners (without China), doubles to 0.2 %.
3.3 Sectoral effects
For Scenarios III and IV, Figure 7 reports absolute changes in output for the most affected sectors
in the EU. A few sectors would benefit from the unilateral imposition of EU NTBs on imports
from China. These include wholesale and retail trade, construction and the machinery and equipment
industry. However, other sectors, first and foremost motor vehicles but also other transport equipment
would suffer from unilateral decoupling. This heterogeneity disappears in Scenario IV, as all of the
aforementioned sectors would experience declines in output following a trade war between the EU and
China.
Figure 7: Output change in the top ten affected sectors in the EU (sorted by Scenario IV)
25,000
0
in m. US $
−25,000
−50,000
−75,000
s
n
n
s
e
s
t
t
de
s
en
en
e
al
e
e
io
io
c
iti
an
ic
cl
ra
et
ct
at
m
m
tiv
rv
i
lT
eh
ru
M
ic
r
ip
p
su
Se
Ac
ui
un
st
qu
ai
rV
us
In
Eq
on
et
m
s
tE
e
ro
o
s
R
at
om
C
ot
&
ne
er
or
st
&
M
y
−F
C
si
sp
lE
er
le
Bu
&
on
an
in
a
ea
es
n
h
N
Tr
er
R
io
ac
l
ho
th
at
er
M
O
rm
W
th
O
fo
In
Scenario III Scenario IV
Scenario III: Unilateral Decoupling of the EU vis-à-vis China. Scenario IV: Trade War EU-China.
Source: Authors’ own calculations.
16KIEL POLICY BRIEF NO. 153 | JULY 2021
4 Final remarks
As a catalyst for economic and political transition the global COVID-19 pandemic has revealed how
vulnerable the global trade network and specifically global supply chains are to supply and demand
shocks. This has triggered a political discussion about the rising dependence of domestic economic
performance on global trade relations, especially with China. In particular, relocating value chains
back to the EU is proposed in order to improve resilience in the face of crises.
This policy brief has shown that such reshoring, implemented through a unilateral increase in
NTBs on EU imports, would have devastating impacts on extra EU trade. On average, it would
reduce real income by 3.5 % across EU member states. Relative to GDP in 2019, this equals a
permanent income loss of 584.3 bn EUR. These effects would be extremely unevenly distributed, with
small open economies such as Malta and Belgium being affected most severely. In case other countries
follow the same strategy, the average real income loss in the EU would rise to 5.3 % (584.3 bn EUR).
The real income of non-European trading partners would decrease by up to 1.5 % on average. Such
a decoupling of the EU would considerably worsen the standard of living for people inside the EU
as well as for its trading partners outside, and should thus be avoided by all means. A decoupling
from China only would cost the EU between 0.8 % (131.4 bn EUR) and 1 % (170.3 bn EUR) of real
income.
Nevertheless, there is a need for action. Diversification of supply chains, advances in recycling
techniques and improved warehousing are but a few examples that can reduce singular dependencies.
Unlike isolationism, they can help increase the crisis resilience of the European economy without
forgoing the benefits of the international division of labor that has contributed to the continent’s
prosperity.
17KIEL POLICY BRIEF NO. 153 | JULY 2021
REFERENCES
Blum, J., M. Mosler, N. Potrafke, F. Ruthardt and F. Ruthardt (2020), Ökonomenpanel: Wie bewerten
Ökonom*innen die Wirtschaftspolitischen Reaktionen auf die Coronakrise?, ifo Schnelldienst 73 04,
48–51.
Bratt, M. (2017), Estimating the Bilateral Impact of Non-Tariff Measures on Trade, Review of Inter-
national Economics 25 5, 1105–1129.
Caliendo, L. and F. Parro (2015), Estimates of the Trade and Welfare Effects of NAFTA, Review of
Economic Studies 82 1, 1–44.
D’Aguanno, L., O. Davies, A. Dogan, R. Freeman, S. Lloyd, D. Reinhardt, R. Sajedi and R. Zymek
(2021), Global Value Chains, Volatility and Safe Openness: Is Trade a Double-Edged Sword?,
Financial Stability Paper 46.
Eppinger, P. S., G. Felbermayr, O. Krebs and B. Kukharskyy (2021), Decoupling Global Value Chains,
CESifo Working Papers 9079.
European Commission (2020), European Economic Forecast. Autumn 2020., Institutional Paper 136.
Felbermayr, G., M. Goldbeck and A. Sandkamp (2019a), Chinas ausländische Direktinvestitionen: Ein
Überblick, Kiel Policy Brief 123.
Felbermayr, G., M. Goldbeck and A. Sandkamp (2019b), Feindliche Übernahme? Chinas Auslandsin-
vestitionen unter der Lupe, ifo Schnelldienst 72 08, 27–39.
Felbermayr, G., A. Sandkamp, H. Mahlkow and S. Gans (2020), Lieferketten in der Zeit nach Corona,
Kurzgutachten im Auftrag der IMPULS Stiftung, November.
Flach, L. and M. Steininger (2020), Globalisierung Nach Covid-19: Die Folgen der Pandemie für die
Deutsche Wirtschaft, ifo Schnelldienst 73 07, 17–23.
Fuchs, A., L. Kaplan, K. Kis-Katos, S. S. Schmidt, F. Turbanisch and F. Wang (2020), Mask Wars:
China’s Exports of Medical Goods in Times of COVID-19, Center for European, Governance and
Economic Development Research Discussion Papers 398.
Garcia-Herrero, A., G. Wolff, J. Xu, N. Poitiers, G. Felbermayr, W.-H. Liu, A. Sandkamp and R. Lang-
hammer (2020), EU-China Trade and Investment Relations in Challenging Times, European Par-
liament, May.
Ghodsi, M., J. Grübler, O. Reiter and R. Stehrer (2017), The Evolution of Non-Tariff Measures and
Their Diverse Effects on Trade, wiiw Research Reports 419.
18KIEL POLICY BRIEF NO. 153 | JULY 2021
Joachimsen, K. (2020), Worauf es jetzt ankommt, ifo Schnelldienst 73 05, 29–31.
Kinzius, L., A. Sandkamp and E. Yalcin (2019), Trade Protection and the Role of Non-Tariff Barriers,
Review of World Economics (Weltwirtschaftliches Archiv) 155 4, 603–643.
Miroudot, S. (2020), Resilience Versus Robustness in Global Value Chains: Some Policy Implications,
in R. E. Baldwin and S. J. Evenett, editors, COVID-19 and Trade Policy: Why Turning Inward
Won’t Work, VOXeu/CEPR Press, London.
Sforza, A. and M. Steininger (2020), Globalization in the Time of Covid-19, CESifo Working Paper
Series 8184.
19KIEL POLICY BRIEF NO. 153 | JULY 2021
Kiel POLICY BRIEF NR. XX | MONAT 2018
IMPRESSUM
DR. KLAUS SCHRADER
Head of Area Special Topics
Leiter Bereich Schwerpunktanalysen
> klaus.schrader@ifw-kiel.de
Publisher: Authorized Representative:
Kiel Institute for the World Economy Prof. Gabriel Felbermayr, Ph.D. (President)
Kiellinie 66, 24105 Kiel, Germany
Phone +49 (431) 8814-1 Photos:
Fax +49 (431) 8814-500 Cover: © takenobu – iStockphoto
Head of Editorial Team: Responsible Supervisory Authority:
Dr. Klaus Schrader Ministry of Education, Science and Cultural
Affairs of the Land Schleswig-Holstein
Editorial Team:
Marlies Thiessen, Korinna Werner-Schwarz
The Kiel Institute for the World Economy is a
foundation under public law of the State of
Schleswig-Holstein, having legal capacity.
Value Added Tax Id.-Number:
DE 251899169 © 2021 The Kiel Institute for the World Economy.
All rights reserved.
https://www.ifw-kiel.de/de/publikationen/kiel-policy-briefs/You can also read