As of: 01/2017 - Immofinanz

Page created by Christian Black
 
CONTINUE READING
As of: 01/2017 - Immofinanz
As of: 01/2017
As of: 01/2017 - Immofinanz
CONTENT
01 IMMOFINANZ at a Glance & Strategy

02 Combination of IMMOFINANZ and CA Immo

03 Portfolio

04 Financing

05 Q1-2 2016A Results

06 Appendix

                                           Q1-2 2016A – 2
As of: 01/2017 - Immofinanz
IMMOFINANZ - A EUROPEAN COMMERCIAL PROPERTY
SPECIALIST
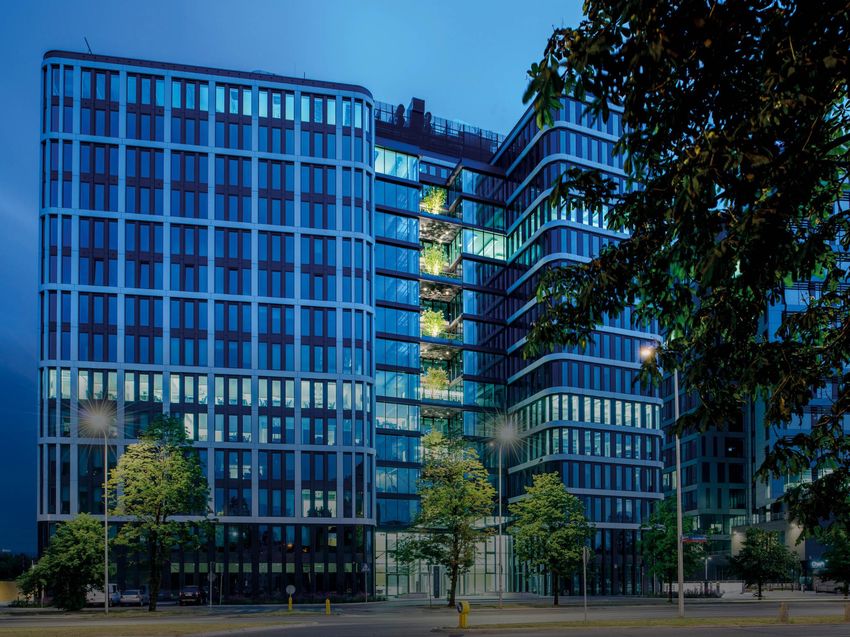
> Among the largest European commercial real estate players with a                    IMMOFINANZ Headquarter
                                                                               Business Park Vienna, 168,500 sqm
  portfolio value of EUR 5.2 bn and a clear focus on Austria, Germany and
  CEE

> Geography mix providing simultaneous exposure to stable commercial
  Western European markets and fast-growth in CEE countries

> Activities concentrated on office and retail with a ~50/50 portfolio split
  and more than 350 properties

> Office: only capital cities and Big 7 cities in Germany yielding between
  5% and 7%

> Retail: focus on secondary and tertiary cities levering on highly stand-
  ardized products (STOP SHOP and VIVO!) yielding between 6% and 8%

> High quality development pipeline and strong track record

> Sustainable dividend play with attractive dividend yield (2015/16: EUR
  0.06 per share, 2016Re: EUR 0.06 per share – expected dividend
  payment date: 7 June 2017)

> Attractive merger growth story with CA Immo
                                                                                                   Data as of 31 October 2016

                                                                                                          Q1-2 2016A – 3
As of: 01/2017 - Immofinanz
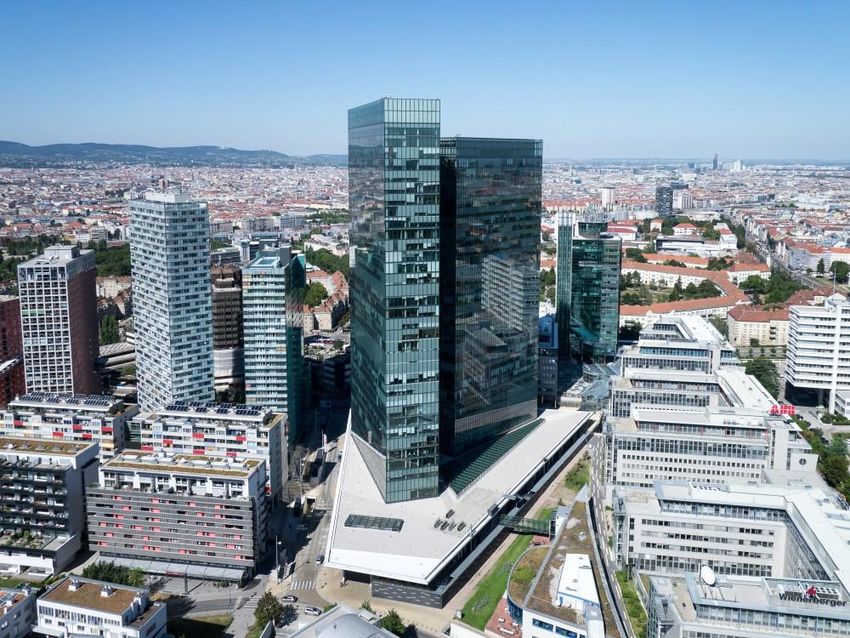
PORTFOLIO SPLIT – COMMERCIAL REAL ESTATE
PLAYER WITH FOCUS ON EUROPE
ASSET CLASSES                                                                                     PROPERTY PORTFOLIO
                                                                                                           19.9%                 11.6%              8.8%      4.2%
                                                                                                           Austria               Poland       Germany       Slovakia

49.2%                                            45.8%                                   4.9%     20.5%               16.3%                 8.9%           7.5%        2.2%
Office                                           Retail                                  Others   Russia             Romania              Hungary       Czech         Non-
                                                                                                                                                      Republic        core
                                                                                                                                                                  countries1

KEY DATA ON THE PROPERTY PORTFOLIO
                                                                                                                                                    31 OCTOBER 2016
Total number of properties                                                                                                                                         351
Rentable space                                                                                                          in sqm                               2,146,314
Occupancy rate                                                                                                            in %                                    87.5%
Gross return on the standing investments                                                                                  in %                                     6.3%
Gross return on the standing investments (occupancy-adjusted)                                                             in %                                     7.2%
                  2
Portfolio value                                                                                                        in MEUR                                    5,243
 Thereof office                                                                                                        in MEUR                                    2,582
 Thereof retail                                                                                                        in MEUR                                    2,403
 Thereof other                                                                                                         in MEUR                                     258

1 In declining order based on the carrying amount: Slovenia, Serbia, Croatia, Bulgaria, Ukraine
2 Including properties held for sale
                                                                                                                                                             Q1-2 2016A – 4
As of: 01/2017 - Immofinanz
BRANDS OF IMMOFINANZ

             RETAIL    OFFICE

                                Q1-2 2016A – 5
As of: 01/2017 - Immofinanz
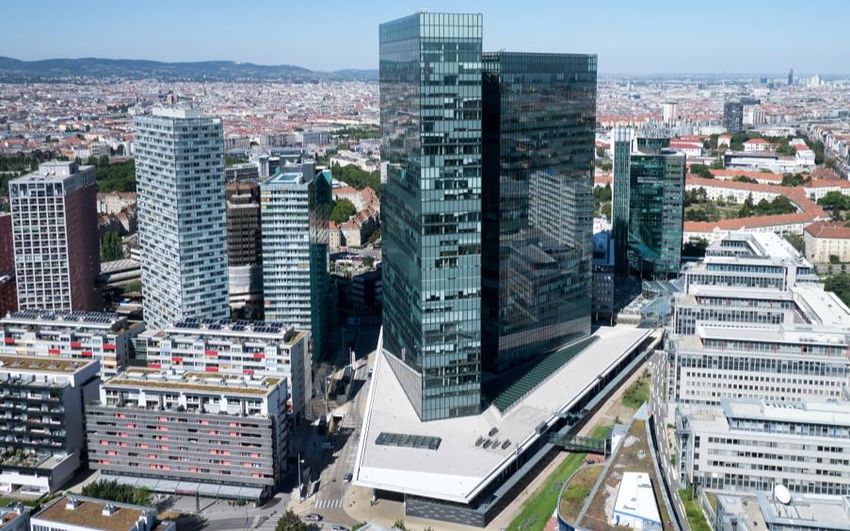
STOP SHOP – THE LOCAL SUPPLIER

> STOP SHOP is our brand for retail parks in Central and Eastern Europe
> Likeable and convenient local supplier located in catchment areas of 30,000 to
   150,000 residents
> Broad product range offering good value for money
> Good transport links and extensive parking facilities
> Target group is price conscious “smart shoppers”

                                                                                   Q1-2 2016A – 6
As of: 01/2017 - Immofinanz
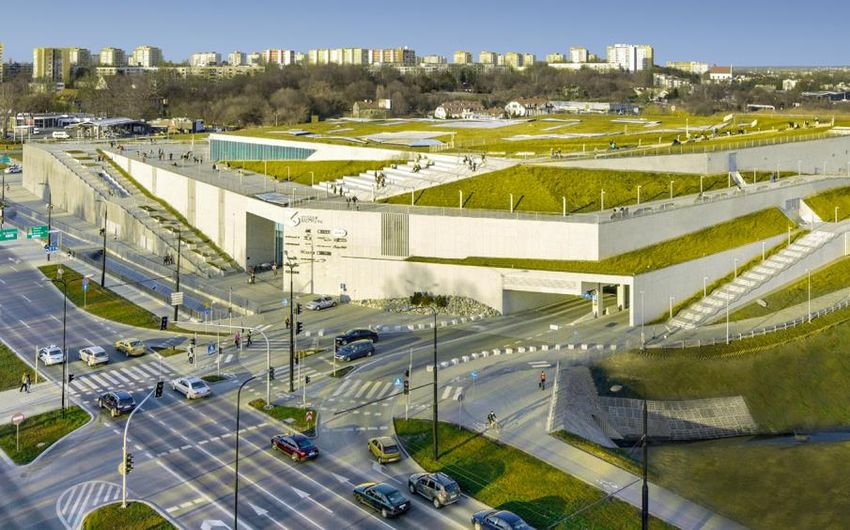
STOP SHOP – 671 LOCATIONS IN EIGHT COUNTRIES
> Opening of three fully-let
    locations in Poland and Serbia,
    with total rental space of
    13,500 sqm
>   Acquisition of nine existing
    retail parks in Hungary,                                                                571 OBJECTS AS OF 31 OCT. 2016
    Slovakia and Romania,                                                                   Rentable space                        374,299 sqm
    with total rentable                                              POLAND                 Occupancy rate                                 96.6%
    of 74,000 sqm
    (closing 2017)                                                                          Carrying amount                        MEUR 532.9
                                                                                            Gross return                                    7.5%
>   Serbia: three further
    locations being                                                                         Gross return (occupancy adj.)                   7.8%
    developed –                                     CZECH REPUBLIC
    completion 2017
>   Poland: further locations
                                                                                       SLOVAKIA
    under evaluation
>   Doubling of the STOP SHOP
    portfolio to over 100 locations in
    the coming years                          AUSTRIA                HUNGARY

                                         SLOVENIA                                         ROMANIA

                                                                              SERBIA
                                                                                                  1 Different number of properties resulting from
                                                                                                  acquisitions/development completions after the
                                                                                                  balance sheet date

                                                                                                                                 Q1-2 2016A – 7
As of: 01/2017 - Immofinanz
VIVO! – THE SHOPPING CENTER

> VIVO! is our brand for shopping centers
> Designed for cities with a catchment area of at least 200,000 residents
> Strong anchor tenants and an attractive retail mix
> VIVO! combines shopping with an experience and is geared toward the entire
   family
> Mostly single storey buildings; high brand recognition value

                                                                               Q1-2 2016A – 8
As of: 01/2017 - Immofinanz
VIVO! – ROLLOUT TO FURTHER LOCATIONS
> Rollout of VIVO! brand
  under way across existing
  shopping centers
> New development
  project in Krosno with
  21,000 sqm –
  opening 2017 /                                              10 OBJECTS AS OF 31 OCT. 2016
  tenants include                                             Rentable space                  285,535 sqm
                                               POLAND         Occupancy rate                        96.3%
  Media Markt, H&M,
  Helios Cinema                                               Carrying amount                  MEUR 613.9
                                                              Gross return                           7.2%
> Further develop-
  ment projects and                                           Gross return (occupancy adj.)          7.4%
  acquisitions under
  evaluation                  CZECH REPUBLIC
                                                  SLOVAKIA

                                                             ROMANIA

                                                                                              Q1-2 2016A – 9
As of: 01/2017 - Immofinanz
MYHIVE – NEW INTERNATIONAL OFFICE BRAND
myhive – the vibrant and welcoming office from IMMOFINANZ
> Friendly and vibrant atmosphere, like a hotel
> Attentive employees
> Optimal infrastructure and top-quality services
> Ideal place for networking
> Good accessibility and contemporary flexibility

                                                            Q1-2 2016A – 10
MYHIVE – ONGOING ROLLOUT TO SIX COUNTRIES
> Brand rollout to 20 locations
   in six countries
> Focus for develop-
   ment projects and
   acquisitions on
   further myhive
   locations                                                     POLAND                           151 OBJECTS AS OF 31 OCT. 2016
                                                                                                  Rentable space                           387,983 sqm
> Exclusively capital                                              Warsaw
                                      GERMANY                                                     Occupancy rate                                    84.9%
   cities plus the major
                                                                                                  Carrying amount                           MEUR 867.4
   office cities in Germany Cologne
                                                                                                  Gross return                                       5.2%
                                                                                                  Gross return (occupancy adj.)                      6.1%
                                                     Prague
                                                CZECH REPUBLIC

                                                    Vienna
                                                 AUSTRIA             Budapest

                                                                 HUNGARY

                                                                                               ROMANIA

                                                                                                               Bucharest

                                                                      1 Twenty properties, including 15 standing investments will be branded as myhive.
                                                                      Two of these standing investments are not listed separately because they are part of
                                                                      the IRIDE Business Park. The other three properties are classified as development
                                                                      projects.
                                                                                                                                         Q1-2 2016A – 11
PORTFOLIO GROWTH OFFICE
HIGH PRELETTING RATES IN GERMANY
> IMMOFINANZ’s future portfolio in Germany will include premium properties
    in Düsseldorf, Cologne and Aachen
> Construction of corporate headquarters for trivago and Uniper in the Düsseldorfer
    Medienhafen
> Construction of the largest technology cluster within the RWTH Aachen expansion
> Planned development of the German office portfolio1:                                                               trivago, Düsseldorf (GER)

RENTABLE SPACE                                               CARRYING AMOUNT                        RENTAL INCOME
in sqm                                                       in MEUR                                in MEUR, p.a.
                                         ~111,000                                      ~506.4                                     ~26.0
                      +94.7%                                                +272.6%                                 +306.3%
        ~57,000
                                                                    135.9                                   6.4

      FY 2015/16                         Mid 2018                 FY 2015/16          Mid 2018          FY 2015/16              Mid 2018

LARGEST PROJECTS                                      PRIMARY       PLANNED RENTABLE SPACE       PRELETTING RATE     SCHEDULED COMPLETION
IN GERMANY                                                USE            IN SQM (ROUNDED)                    IN %       (CALENDAR QUARTER)
FLOAT                                                    Office                       30,000                 95%                      Q3 2018
RWTH Aachen                                              Office                       28,000                 95%                      Q2 2017
trivago2                                                 Office                       26,000                100%                      Q3 2018
1 Total sale of Gerling Quartier already considered
2 Project phase I
                                                                                                                                    Q1-2 2016A – 12
OPERATIONAL UPDATE OFFICE – OCCUPANCY RATE
OCCUPANCY RATE                                                                                         >87.0%
                                                                               82.7%
                                                  81.7%
                        75.0%                                                             >+4.3Pp
                                   +6.7Pp                      +1.0Pp

                      FY 2014/15                FY 2015/16                  Q2 2016A                  Forecast
                                                                                                 FY 2016A (12/2016)
RENTAL PERFORMANCE Q1-2 2016A

                       Developments                                                   Contract
                         14,000 sqm                                                 extensions
                                                                                   32,000 sqm
                                               Total                                                   Total
                                            106,000 sqm                                             106,000 sqm
                                                               Standing                                               New rentals
                                                               investments                                            74,000 sqm
                                                               92,000 sqm

                                   RANKING         COUNTRY                      BUILDING                          TENANT                SQM
LARGEST NEW RENTALS                                                                 Iride 18            Int. medical company            11,500
Q1-2 2016A                         1                  Romania
                                   2                   Austria          Business Park Vienna           Coca-Cola HBC Austria             6,500
                                   3             Czech Republic      Brno Business Park I+II           NOTINO internet shop              4,000
                                   4             Czech Republic          CSOB Jungmannova                    Alpiq Energy SE             2,600
                                   5                      Austria        Vienna Twin Tower                   POOL4TOOL AG                2,500

                                                                                                                                    Q1-2 2016A – 13
OPERATIONAL UPDATE OFFICE – PORTFOLIO EFFICIENCY
REDUCTION OF NUMBER OF PROPERTIES FOR THE BENEFIT OF AN INCREASED AVERAGE SIZE AND
CARRYING AMOUNT
    Number of properties
    Average carrying amount (in MEUR)
    Average space (in sqm)

                                                     14,632.4           14,912.3   Overall change:
                                  12,947.0
                                             30.0               30.7
                        26.7                                                       ø SPACE: +15.2%

                               85                                                  ø CARRYING AMOUNT: +15.2%
                                                    72                 69
                                                                                   NUMBER OF PROPERTIES: -18.8%

                          30 April 2016       31 July 2016      31 October 2016

>   Sale of smaller properties: disposal of buildings with rentable space of ≤ 5,000 sqm
>   Sale of properties in peripheral locations
>   Redevelopments: conversion of office properties into residential in peripheral locations
>   Refurbishments: modernisation of larger properties and new rentals
>   Own development projects: e.g. Panta Rhei in Düsseldorf, Nimbus in Warsaw

                                                                                                     Q1-2 2016A – 14
OPERATIONAL UPDATE OFFICE – FOCUS ON CORE
COUNTRIES AND MARKETS

2014                                        2016
      Vienna              HR   Zagreb             Vienna              HR   Zagreb
      St. Pölten          HU   Budapest           St. Pölten          HU   Budapest
AT    Salzburg            NL   Amsterdam    AT    Salzburg            NL   Amsterdam
      Klagenfurt          PL   Warsaw             Klagenfurt          PL   Warsaw
      Linz                RO   Bucharest          Linz                RO   Bucharest
BG    Sofia               SK   Bratislava   BG    Sofia               SK   Bratislava
      Prague                                      Prague
CZ                                          CZ
      Brno                                        Brno
      Neu-Isenburg                                Neu-Isenburg
      Frankfurt am Main                           Frankfurt am Main
GER   Offenbach                             GER   Offenbach
      Cologne                                     Cologne
      Düsseldorf                                  Düsseldorf

                                                                                        Q1-2 2016A – 15
OPERATIONAL UPDATE – DISPOSAL PROGRAMME

    PLANNED SALES 1                                                          Total
    In MEUR as of 30 April 2016                                             MEUR
                                                                           ~1,000.0

    ~1,000.0
    Sales volume

    PROGRESS
    In MEUR as of 31 October 2016

    224.4                     254.3                          ~500.0
    Sold                      IFRS 5: Assets held for sale   Outstanding

    > Proceeds will finance development activities & portfolio growth

1 Excluding Russia
                                                                            Q1-2 2016A – 16
OUTLOOK

            FURTHER PORTFOLIO GROWTH WITH OUR BRANDS

                      FURTHER INCREASE IN OCCUPANCY RATE

  TARGETS
                      PORTFOLIO OPTIMISATION

            PLANNED MERGER OF IMMOFINANZ AND CA IMMO

                                                           Q1-2 2016A – 17
CONTENT
01 IMMOFINANZ at a Glance & Strategy

02 Combination of IMMOFINANZ and CA Immo

03 Portfolio

04 Financing

05 Q1-2 2016A Results

06 Appendix

                                           Q1-2 2016A – 18
Merger update

January 2017

                Q1-2 2016A – 19
The combination of IMMOFINANZ and CA Immo –
a strategically compelling and value enhancing combination

                                                                                                                                                                                   Pro-forma data as of Jan-2017

                                                    1       Creating a leading commercial real estate company in Europe                                                                        €6.6bn
                                                                                                                                                                                          portfolio value(a)

                                                            Regionally balanced portfolio with leading positions in Germany, Austria and the
                                                    2       main CEE markets, benefitting from strong macro conditions
                                                                                                                                                                                     42% DE/AT vs 58% CEE
                                                                                                                                                                                     74% office vs 21% retail(b)

                                                            High quality, recently built unique German office portfolio with strong development                                    c.€1.5-2.0bn(e) of development
                                                    3       capability and sizeable German landbank
                                                                                                                                                                                      pipeline, predominantly
                                                                                                                                                                                   focused on Germany (c. 78%)

                                                                                                                                                                                        €33mm p.a. pre-tax
                                                    4       Synergetic combination driven through revenue, cost and financing synergies                                             run-rate synergies(c) initially
                                                                                                                                                                                    assessed by IMMOFINANZ,
                                                                                                                                                                                       joint analysis initiated

                                                    5       Enhanced scale and diversity to improve credit profile, aiming to reach investment                                           Targeted range of
                                                            grade rating for combined entity                                                                                              40-45% net LTV

                                                    6       Highly liquid and investable stock with re-rating potential                                                             €2.7bn combined free-float
                                                                                                                                                                                      market capitalisation(d)

Note: Pro-forma data as per January 2017: Q2-16 for IMMOFINANZ and Q3-16 for CA Immo
(a) Including CA Immo at-equity investments, excluding development
(b) Differential of approx five percentage points belongs to ‘Other’ segment (comprises all other business activities that cannot be allocated to the office or retail segments)
(c) Synergies announced by IMMOFINANZ in April 2016 currently under joint review
(d) As of 9-Jan-17, not reflecting a potential impact on market cap of the envisioned Russian disposal from IMMOFINANZ portfolio
(e) Includes landbank for CA Immo and outstanding development costs for both IMMOFINANZ and CA Immo
Source: IMMOFINANZ and CA Immo company information, Bloomberg

                                                                                                                                                                                                   Q1-2 2016A – 20
The combination between IMMOFINANZ and CA Immo, planned to be
completed in 2018, provides an attractive opportunity of creating a European
leader in commercial real estate

                2016                                  2017                                             2018

Step 1                               Step 2                           Step 3

 Acquisition of a 26% stake in CA    Disposal/spin-off of            Merger of IMMOFINANZ and CA Immo
  Immobilien Anlagen AG by             IMMOFINANZ Russian portfolio
  IMMOFINANZ AG                                                        Detailed merger discussions will be rescheduled until separation of
                                      Spin-off to existing             IMMOFINANZ’s Russian portfolio is completed
 Antitrust approvals obtained         IMMOFINANZ shareholders or
                                       sale to a third party buyer     Statutory merger according to Austrian law
 Recording of registered shares                                           Exchange ratio based on broad range of customary valuation
  and closing of acquisition          Execution in progress: to be          methodologies
  executed in August                   completed prior to merger           Exchange ratio review by auditor
                                                                           Merger document and exchange ratio to be published approx. 1
                                                                             month ahead of General Meetings

                                                                                   General Meetings resolving on merger
                                                Ongoing
                                                                                             planned in 2018

                                                                                                                                              Q1-2 2016A – 21
The proposed statutory merger is an opportunity to combine two highly
   complementary portfolios and implement best-in-class corporate governance
                                             Corporate structure                                                                  Structure and governance

                 Shareholders                                                  Shareholders
                                                                                                                 Statutory merger of the two entities
                                74%                                                         94%
                                                           26%
                                                                                                                 IMMOFINANZ exit from Russia prior to the respective
                     CA Immo                                                   IMMOFINANZ                         general meetings
                                                             6%

        Austria                                                        Austria                                 The exchange ratio will be determined by reference to a
        Germany                                                        Germany                                  broad range of customary valuation methodologies
        Poland                                                         Poland
        Romania                                                        Romania
        Czech Republic                                                 Czech Republic                          75% shareholder approval required in both AGMs/EGMs
        Hungary                                                        Hungary
        Other countries(a)                                             Other countries(b)
                                                                        Russia (sale or spin-off pre merger)
                                                                                                                 Details of the structure will be developed by both parties in
                                                                                                                  the best economic interest for the shareholders, including
                                                                                                                  tax considerations

                                                 Shareholders
                                                                                                                 Combined company to operate under a new name
                                                               100%
                                                                                                                 Best-in-class corporate governance
                                                     MergeCo

                                      Austria               Czech Republic
                                      Germany               Hungary
                                      Poland                Other countries(c)
                                      Romania

Source: CA Immo and IMMOFINANZ company information
(a) Slovakia, Slovenia, Serbia, Croatia, Bulgaria
(b) Slovakia, Slovenia, Serbia, Croatia, Bulgaria, Ukraine, Turkey
(c) Slovakia, Slovenia, Serbia, Croatia, Bulgaria, Ukraine, Turkey

                                                                                                                                                                         Q1-2 2016A – 22
Regionally balanced portfolio with leading positions in Germany, Austria and
the main CEE markets, benefitting from strong macro conditions

  Regional distribution (standing assets)(a)                                                                              Asset classes (standing assets)(a)

                                               Others(b) 8%                                                                                               Others(c) 5%
                           Czech
                         Republic 9%                                Austria 24%
                                                                                                                                            Retail 21%

                  Hungary 14%

                                                                           Germany                                                                                               Office 74%
                                                                             18%
                        Poland 14%

                                                        Romania 14%

                                             Total: €6,600m                                                                                               Total: €6,600m

GDP and prime office rental growth per country (%)

Country                                                               2017E GDP growth (%)(d)                                                                  Prime office rental growth (%)(e)
Austria                                                                                         1.2%                                                                             Vienna, 1.9%

Germany                                                                                         1.4%                                                                               Berlin, 8.7%

Czech Republic                                                                                  2.7%                                                                             Prague, 2.6%

Hungary                                                                                         2.5%                                                                           Budapest, 5.0%

Poland                                                                                          3.4%                                                                           Warsaw, (2.0)%

Romania                                                                                         3.8%                                                                          Bucharest, 0.0%

Note: Portfolio including CA Immo pro-rata share of at-equity investments, excluding development and pipeline projects and IMMOFINANZ Russia properties
(a) Data as of 31-Oct-16 for IMMOFINANZ and as of 30-Sep-16 for CA Immo
(b) Bulgaria, Croatia, Serbia, Slovakia, Slovenia, Turkey, Ukraine
(c) Comprises all other business activities that cannot be allocated to the office or retail segments
(d) Data as per IMF (International Monetary Fund)
(e) As of September 2016, one-year growth, Vienna and Bucharest as of June 2016
Source: Company reports; IMF; Cushman & Wakefield

                                                                                                                                                                                                   Q1-2 2016A – 23
Significant synergy potential in proposed combination

        Revenue synergies                                                Cost synergies         Financing synergies

   Potential additional                                        Reduction of corporate       Reduced financing costs
    acquisition opportunities                                    overheads                     through enlarged
    (better visibility in the                                                                  platform and stronger
    market)                                                     Combination of asset          balance sheet
                                                                 management platforms
   Coordinated letting                                          (as well as country hubs)    Targeted investment
    activities, in particular in                                                               grade rating of combined       Initial assessment by
                                                                Cash savings on               entity will help to further     IMMOFINANZ: €33mm
         Eastern European                                                                     improve access to capital
                                                                 maintenance and capex                                         p.a. total run-rate
          capitals lead to                                                                     and will reduce funding         synergy potential(a)
                                                                 from increased
          vacancy reduction                                                                    costs
                                                                 purchasing power and
          and lease up                                                                                                        Joint analysis of
                                                                 improved procurement
          potential                                                                                                            synergies initiated
                                                                 organisation                 Higher free float and
         #1 “go to” provider of                                                               trading volume levels of
          class A office space                                  Reduced letting costs         combined entity expected
                                                                 due to better terms with      to reduce cost of equity
                                                                 brokers

(a) Synergies announced by IMMOFINANZ in April 2016 currently under joint review

                                                                                                                                           Q1-2 2016A – 24
Creating a leading commercial Real Estate company in Europe and the clear
market leader in CEE

Largest listed Continental Europe commercial Real Estate companies                                                                                               Largest listed European commercial Real Estate companies with CEE
by GAV (Total GAV(a), €bn, latest available)                                                                                                                     portfolio by GAV (CEE GAV(a), €bn, latest available)
 33.8

                                                                                                        Largest listed European                                                                                                              Largest portfolio in CEE (excl.
                                                                                                            commercial real estate                                 3.8                                                                          Russia) vs relevant peers
                                                                                                            company not focused on UK,                                                   3.5
                                                                                                            France or Switzerland
                     19.4

                                                                                                                                                                                                             2.6
                                                                                                                                                                                                                      2.3
                                 12.5

                                          11.8

                                                                                                                                                                                                                                   1.5
                                                 8.5

                                                                                                                                                                                                                                              1.2
                                                         6.6

                                                                                                                                                                                                                                                        1.2
                                                                              5.2

                                                                                                                                                                                                                                                                     0.7
                                                                                    3.4

                                                                                                 3.4

                                                                                                                   3.2
                                                                                                         3.0

                                                                                                                             2.6

                                                                                                                                      2.0

                                                                                                                                                                                                                                                                               0.4
                                                                                                                                               1.9

                                                                                                                                                           1.2
                                          FdR

                                                                                                 DES

                                                                                                                                                           GTC

                                                                                                                                                                                                                                               GTC
                                                                                                                                      S Immo
                     Klepierre

                                                         Pro forma CAI & IF

                                                                                                                             Atrium

                                                                                                                                               DIC Asset

                                                                                                                                                                    Pro forma CAI & IF

                                                                                                                                                                                                             Atrium

                                                                                                                                                                                                                                                         Klepierre
                                 Gecina

                                                 Icade

                                                                              SFL

                                                                                                                   CA Immo

                                                                                                                                                                                                                                   CA Immo
                                                                                                         Alstria
 Unibail - Rodamco

                                                                                    IMMOFINANZ

                                                                                                                                                                                         Unibail - Rodamco

                                                                                                                                                                                                                      IMMOFINANZ

                                                                                                                                                                                                                                                                     S Immo

                                                                                                                                                                                                                                                                                Segro
Note: Ranking as per last reported GAVs; CA Immo including pro-rata share of at-equity investments; IMMOFINANZ figures exclude Russian properties, GAV including Russia is €4.5 billion; Alstria incl
Deutsche Office; DES has exposure to CEE region via Galeria Baltycka in Gdansk (Poland) and Árkád in Pécs (Hungary), DES CEE GAV na
(a) GAV of investment property/standing assets excl. development
Source: IMMOFINANZ and CA Immo company information, Latest company information of peers

                                                                                                                                                                                                                                                                              Q1-2 2016A – 25
Among the leaders in the major German office markets with strong combined
development capabilities

Geographic breakdown of development pipeline (a)                                                                       Complementary development capabilities

             CA Immo                                                                                                      Existing landbank reserves secures organic growth strategy over the next decade
      Others                                                                                                              Both companies with successful track record of project development for own use
      ~14%                                                                                                                 or disposal to third parties

                                                                                                                          With a combined development pipeline of c. €1.5-2.0 billion with a strong focus on
                                                                                                                           the key European market Germany, the high quality pipeline value will be a
                                                                                                                           significant driver of future stable growth

                           Germany
                            ~86%                                 CA Immo + IMMOFINANZ
                                                                    Others                                             CA Immo
                                                                    ~22%
                                                                                                                          High quality landbank of ~€300m in Germany with estimated potential of c.€2bn
                                                                                                                           valuation when fully developed

                                                                                                                          Focus on office project development in Germany (e.g. Tower One in Frankfurt,
                                                                                                                           Cube in Berlin, Nymphenburg and Neo in Munich)

                                                                                               Germany
                                                                                                ~78%
                                                                                                                       IMMOFINANZ
          IMMOFINANZ                                                                                                      Focus on office project development in Germany and retail products /
                                                                                                                           STOP.SHOP & VIVO! in other core countries; significant land bank to use for
 Others
                                                                                                                           project development
 ~29%

                                                                                                                       Combined
                                Germany                                                                                   Significant development activities in key growth regions in Germany (Berlin,
                                 ~71%                                                                                      Cologne, Dusseldorf, Frankfurt and Munich)(b)

Note: IMMOFINANZ excluding pipeline projects and Russia development; figures as of 31-Oct-16 for IMMOFINANZ and 30-Sep-16 for CA Immo
(a) Value of CA Immo development pipeline of approximately €800 million (inclusive of landbank and estimated development costs but not including equity accounted development projects) and for IMMOFINANZ of approximately €1,000
million (inclusive of outstanding development costs) (b) Additional development activities in Germany are in Aachen, Mainz and Regensburg
Source: IMMOFINANZ and CA Immo company information

                                                                                                                                                                                                                      Q1-2 2016A – 26
Highly liquid and investable stock with re-rating potential

  Highly liquid…                                                                                                                                                                                             …with significant re-rating potential

                                                    Daily trading volume CEE players (6m ADTV, €m)                                                                                                                                      Re-rating potential to peer group average

                                                                                                                                                                                          Relative level
                         0.34%                       0.34%                                 0.28%                 0.08%                            0.11%                0.12%
                                                                                                                                                                                          of liquidity (a)         Current and
                                                                                                                                                                                                                potential discount     (33.2%)   (17.9%)         (39.7%) (17.9%)            (36.8%)   (17.9%)
                           8.4                                                                                                                                                                                     to NAV (%)
                                                                                                                                                                                                               Current and potential
                                                      5.2                                                                                                                                                      market capitalization
                                                                                                                                                                                                                       (€m)
                                                                                            3.2                                                                                                                        5,000
                                                                                                                                                                                                                                                                                                  4,513
                                                                                                                      0.5                          0.5                     0.4                                         4,500
                                                                                             CA Immo

                                                                                                                                                                                                                                                                  Combined re-

                                                                                                                                                                              GTC
                                                                                                                         Atrium
                          IMMOFINANZ &

                                                                                                                                                   S Immo
                                                       IMMOFINANZ

                                                                                                                                                                                                                       4,000
                                                                                                                                                                                                                                                                 rating potential                 3,475
                             CA Immo

                                                                                                                                                                                                                       3,500                                         of 29.8%

                                                                                                                                                                                                                       3,000
                                                                                                                                                                                                                                                                      2,492
                                                                                                                                                                                                                       2,500
  … and investable stock…                                                                                                                                                                                                                   2,021                     1,831
                                                                                                                                                                                                                       2,000
            Continental European commercial Real Estate (free float market cap, €bn)                                                                                                                                                        1,644
                                                                                                                                                                                                                       1,500
     22.2

                               9.1

                                                                                                                                                                                                                       1,000
                                           4.3

                                                     3.7

                                                                                                                                                                                                                          500
                                                                       2.7

                                                                                   2.4

                                                                                               1.7

                                                                                                       1.5

                                                                                                                 1.5

                                                                                                                                  1.2

                                                                                                                                            1.0

                                                                                                                                                     0.6

                                                                                                                                                              0.6

                                                                                                                                                                       0.4

                                                                                                                                                                                    0.3

                                                                                                                                                                                             0.1

                                                                                                                                                                                                                              -
                                                                                                                                                                                                                                         CA Immo                 IMMOFINANZ                  CA Immo +
                               Klepierre

                                                                                                                                                                                    GTC
                                                     FdR

                                                                                                                                            TLG
                                           Gecina

                                                                                               DES

                                                                                                                                                     Atrium

                                                                                                                                                                       DIC Asset
                                                                    IMMOFINANZ &

                                                                                                       alstria

                                                                                                                                                              S Immo
                                                                                   Icade

                                                                                                                                  CA Immo

                                                                                                                                                                                             SFL
     Unibail - Rodamco

                                                                                                                 IMMOFINANZ

                                                                                                                                                                                                                                                                                            IMMOFINANZ
                                                                       CA Immo

                                                                                                                                                                                                               Note: Re-rating potential represents an indication in a potential scenario of closing discount gap between
Note: 6M ADTV and relative liquidity based on all European trading platforms (as per Bloomberg). Not reflecting a                                                                                              peers and a combined entity and is not meant to be a valuation; Calculated based on the simple average of
potential impact of the spin-off of IMMOFINANZ Russian portfolio                                                                                                                                               peer group consisting relevant German, Austrian and CEE peers (IMMOFINANZ, CA Immo, alstria, Atrium,
(a) Calculated as average daily trading volume /free float (in shares)                                                                                                                                         DES, DIC Asset, GTC, S Immo, TLG). Not reflecting a potential impact of the spin-off of IMMOFINANZ
Source: Bloomberg, Company information, Factset as of 9-Jan-17                                                                                                                                                 Russian portfolio

                                                                                                                                                                                                                                                                                                                Q1-2 2016A – 27
CONTENT
01 IMMOFINANZ at a Glance & Strategy

02 Combination of IMMOFINANZ and CA Immo

03 Portfolio

04 Financing

05 Q1-2 2016A Results

06 Appendix

                                           Q1-2 2016A – 28
PROPERTY PORTFOLIO
                                                                  STANDING             DEVELOPMENT               REAL ESTATE     PIPELINE       PROPERTY      PROPERTY
DATA                                     NUMBER OF             INVESTMENTS                 PROJECTS             INVENTORIES     PROJECTS       PORTFOLIO     PORTFOLIO
AS OF 31 OCTOBER 2016                    PROPERTIES                IN MEUR                  IN MEUR                 IN MEUR      IN MEUR         IN MEUR          IN %
Austria                                              134                   997.2                      34.0                0.3        11.2          1,042.6       19.9%
Germany                                               23                    83.7                     290.6               88.1         0.0            462.3        8.8%
Czech Republic                                         22                  371.7                      21.4                0.0         0.9           394.0         7.5%
Hungary                                                30                  433.8                       3.7                0.0        31.6           469.1         8.9%
Poland                                                 28                  592.8                       5.4                6.2         4.0           608.4        11.6%
Romania                                                76                  633.3                      44.8                1.7      173.5            853.2        16.3%
Russia                                                  6                1,072.8                       0.0                0.0         4.1          1,076.9       20.5%
Slovakia                                               15                  176.0                      42.7                0.0         1.1           219.8         4.2%
Non-core    countries1                                 17                    97.7                     10.0                0.2         8.8           116.7         2.2%
IMMOFINANZ                                           351                 4,459.0                     452.5               96.5      235.1           5,243.1      100.0%
                                                                          85.0%                      8.6%               1.8%        4.5%           100.0%

 85.0%                                                                        8.6%                           71.2%                                  28.8%
 Standing investments                                   Development projects                                 Eastern Europe                 Western Europe

                                                                                       4.5%
                                                                Real estate inventories

                                                                                           1.8%
                                                                            Pipeline projects

1 In declining order based on the carrying amount: Slovenia, Serbia, Croatia, Bulgaria and Ukraine
                                                                                                                                                             Q1-2 2016A – 29
STANDING INVESTMENTS
DATA                                                    NUMBER OF              CARRYING AMOUNT                      CARRYING AMOUNT             RENTABLE SPACE                              RENTED SPACE                    OCCUPANCY RATE
AS OF 31 OCTOBER 2016                                   PROPERTIES                      IN MEUR                                 IN %                   IN SQM                                     IN SQM                               IN %
Austria                                                               127                             997.2                     22.4%                         515,617                                  443,352                                 86.0%
Germany                                                                 5                              83.7                      1.9%                          34,174                                   28,045                                 82.1%
Czech Republic                                                         20                             371.7                      8.3%                         236,301                                  194,503                                 82.3%
Hungary                                                                23                             433.8                      9.7%                         281,926                                  248,347                                 88.1%
Poland                                                                 20                             592.8                     13.3%                         288,693                                  267,279                                 92.6%
Romania                                                                20                             633.3                     14.2%                         344,957                                  316,542                                 91.8%
Russia                                                                  5                           1,072.8                     24.1%                         278,459                                  229,327                                 82.4%
Slovakia                                                               12                             176.0                      3.9%                          90,819                                   89,486                                 98.5%
Non-core countries                                                     10                              97.7                      2.2%                          75,369                                   61,332                                 81.4%
IMMOFINANZ                                                            242                           4,459.0                    100.0%                       2,146,314                                1,878,213                                 87.5%

DATA                                            RENTAL INCOME                          GROSS RETURN                 CARRYING AMOUNT                     FINANCING                    FINANCING COSTS                                             LTV
AS OF 31 OCTOBER 2016                        Q2 2016A IN MEUR1                                  IN %                FINANCING IN MEUR                  COSTS IN %2             INCL. DERIVATIVES IN %                                           IN %
Austria                                                              13.8                      5.5% (6.4%)                       521.1                             1.9%                                     2.8%                               52.3%
Germany                                                               1.3                      6.2% (7.6%)                        41.9                             1.3%                                     1.5%                               50.1%
Czech Republic                                                        5.6                      6.0% (7.3%)                       120.6                             2.0%                                     2.4%                               32.4%
Hungary                                                               6.6                      6.1% (6.9%)                       140.2                             1.9%                                     2.2%                               32.3%
Poland                                                                8.8                      5.9% (6.4%)                       371.5                             1.9%                                     2.2%                               62.7%
Romania                                                              11.2                      7.1% (7.7%)                       193.7                             3.3%                                     4.2%                               30.6%
Russia                                                               17.8                      6.6% (8.1%)                       700.4                             7.7%                                     7.7%                               65.3%
Slovakia                                                              3.3                      7.4% (7.5%)                        70.7                             3.1%                                     3.5%                               40.2%
Non-core countries                                                    1.8                      7.2% (8.8%)                        39.7                             3.2%                                     3.6%                               40.6%
IMMOFINANZ                                                           70.1                      6.3% (7.2%)                     2,199.8                             3.9%                                     4.3%                               49.3%
Development and
pipeline projects                                                     1.5                                                        277.7                             1.6%                                     1.8%
In Q2 2016A: properties sold
or reported as held for sale                                          4.9                                                          0.0                             0.0%                                     0.0%
Investment financing                                                  0.0                                                        122.0                             0.7%                                     0.7%
Group financing                                                       0.0                                                        836.8                             3.9%                                     3.9%
IMMOFINANZ                                                           76.5                                                      3,436.3                             3.5%                                     3.8%
Market value of property
portfolio                                                                                                                                                                                                                                    5,243.1
Market value of BUWOG
shares (10 million shares)3                                                                                                                                                                                                                    219.3
EPRA NAV CA Immo shares
(25.7 million shares)4                                                                                                                                                                                                                         674.4
Cash and cash equivalents                                                                                                       -359.5
Properties / liabilities held
for sale (asset & share deals)                                                                                                   221.7                                                                                                          254.3
IMMOFINANZ                                                                                                                     3,298.5                                                                                                         51.6%
1 Rental income based on the primary use of the property (rental income reported in the income statement is based
  on the actual use of the property; marginal differences to the income statement are therefore possible)                            3 10 million BUWOG shares multiplied by the stock exchange closing price of EUR 22.015 on 31 October 2016
2 Financing costs based on nominal outstanding liability                                                                             4 25.7 million shares of CA Immobilien Anlagen AG at the EPRA NAV of EUR 26.25 per share as of 30 September 2016
Values in brackets = adjusted for occupancy
                                                                                                                                                                                                                                    Q1-2 2016A – 30
ASSET CLASS RETAIL
                                                                                                TENANT MIX – RETAIL,
                                                                                                EXCLUDING RUSSIA
                                                 ASSET CLASS RETAIL
                                                                                                                               6.3%
                                                 Number of properties              164                            12.2%        Elec-   5.7%    5.0%
                                                                                                                  Food         tronics Shoes   Furniture
                                                 Carrying amount in MEUR       2,326.8
                                                 Rentable space in sqm       1,106,797
                                                 Occupancy rate                  92.1%
                                                 Rental inc. Q2 2016A in MEUR1    41.6
                                                                                                30.0%                      6.6%     5.8%   5.2%              23.2%
                                                 Gross return              7.1% (7.8%)          Fashion                    Enter-   Health Sports             Other
                                                                                                                           tain-    & Beauty
1 Rental income based on the primary use of the property
  (rental income reported in the income statement is based on the actual use of the property;                              ment
  marginal differences to the income statement are therefore possible)
Values in brackets = adjusted for occupancy
Data as of 31 October 2016

                                                                                                  > Focus on secondary and tertiary cities

                                                                                                  > Long-lasting networks with international
                                                                                                     and local retailers

                                                                                                  > Established brand policy: STOP SHOP and VIVO!

                                                                                                  > Focus on optimised tenant mix and inclusion
                                                                                                     of leisure and entertainment alternatives

 Tarasy Zamkowe, Lublin, 38,000 sqm

                                                                                                                                                           Q1-2 2016A – 31
STANDING INVESTMENTS – THE RETAIL
                                                                                                                                                                                                46.1%
             SECTOR IN THE IMMOFINANZ CORE MARKETS                                                                                                                                                RUSSIA

RUSSIA                            46.1%
Number of properties                     5
Carrying amount in MEUR            1,072.8
Rentable space in sqm             278,459
Occupancy rate                      82.4%
Rental income Q2 2016A (MEUR)1        17.8
Gross return                   6.6% (8.1%)

ROMANIA                           12.9%                                                                                       9.9%
                                                                                                                              POLAND
Number of properties                      5
Carrying amount in MEUR              299.3
Rentable space in sqm             147,317
Occupancy rate                      97.5%
Rental income Q2 2016A (MEUR)1          6.0
Gross return                   8.0% (8.2%)
                                                                                                           5.7%
                                                                                                     CZECH REPUBLIC
POLAND                              9.9%                                                                                                                    IMMOFINANZ                         100.0%
Number of properties                     10                                                                                   7.6%                          Number of properties                      164
Carrying amount in MEUR              230.1                                                                                    SLOVAKIA
                                                                                                                                                            Carrying amount in MEUR               2,326.8
Rentable space in sqm             126,919
Occupancy rate                      95.3%                                                              7.9%                                                 Rentable space in sqm
                                                                                                                                                            Occupancy rate
                                                                                                                                                                                                1,106,797
                                                                                                                                                                                                    92.1%
                                                                                                      AUSTRIA
Rental income Q2 2016A (MEUR)1
Gross return
                                        3.7
                               6.5% (6.8%)
                                                                                                                              7.0%                          Rental income Q2 2016A (MEUR)1
                                                                                                                                                            Gross return
                                                                                                                                                                                                     41.6
                                                                                                                                                                                              7.1% (7.8%)
                                                                                                                              HUNGARY
AUSTRIA                             7.9%
Number of properties                   100    Data as of 31 October 2016
                                                                                                                                                       12.9%
Carrying amount in MEUR              184.4    1 Rental income based on the primary use of the property                                                 ROMANIA
Rentable space in sqm             189,650       (rental income reported in the income statement is based on the actual
Occupancy rate                      92.6%       use of the property; marginal differences to the income statement are
                                                therefore possible)
Rental income Q2 2016A (MEUR)1          4.0   2 Non-core countries: Slovenia and Serbia
Gross return                   8.7% (9.4%)    Values in brackets = adjusted for occupancy

SLOVAKIA                            7.6% HUNGARY                                                  7.0% CZECH REPUBLIC                             5.7%      NON-CORE COUNTRIES2                   3.0%
Number of properties                     12   Number of properties                     12                     Number of properties                     12   Number of properties                         8
Carrying amount in MEUR              176.0    Carrying amount in MEUR              163.1                      Carrying amount in MEUR              132.1    Carrying amount in MEUR                     69
Rentable space in sqm              90,819     Rentable space in sqm             118,285                       Rentable space in sqm             105,599     Rentable space in sqm                 49,750
Occupancy rate                      98.5%     Occupancy rate                      92.4%                       Occupancy rate                      97.5%     Occupancy rate                         96.9%
Rental income Q2 2016A (MEUR)1          3.3   Rental income Q2 2016A (MEUR)1          2.9                     Rental income Q2 2016A (MEUR)1          2.5   Rental income Q2 2016A (MEUR)1             1.4
Gross return                   7.4% (7.5%)    Gross return                   7.2% (7.8%)                      Gross return                   7.6% (7.8%)    Gross return                      7.9% (8.1%)
                                                                                                                                                                                             Q1-2 2016A – 32
ASSET CLASS OFFICE
                                                                                                                        Business Park Vienna, 168,500 sqm

                                                 ASSET CLASS OFFICE
                                                 Number of properties               69
                                                 Carrying amount in MEUR       2,120.6
                                                 Rentable space in sqm       1,028,949
                                                 Occupancy rate                  82.7%
                                                 Rental inc. Q2 2016A in MEUR1    28.4
                                                 Gross return              5.4% (6.5%)
1 Rental income based on the primary use of the property
  (rental income reported in the income statement is based on the actual use of the property;
  marginal differences to the income statement are therefore possible)
Values in brackets = adjusted for occupancy
Data as of 31 October 2016

                                                                                                > Focus only on capital cities of our core countries
                                                                                                  and Big-7 cities in Germany

                                                                                                > Overall size and relevant market position ensure
                                                                                                  high flexibility and synergies

                                                                                                > “More than office” concept guarantees high service
                                                                                                  approach

                                                                                                > Increasing occupancy rate: refurbishment offensive
                                                                                                  launched / strong sales orientation
 Nimbus, Warsaw, 21,000 sqm

                                                                                                                                                Q1-2 2016A – 33
STANDING INVESTMENTS – THE OFFICE
             SECTOR IN THE IMMOFINANZ CORE MARKETS

AUSTRIA                           38.1%                                   3.9%                                               17.1%
                                                                                                                              POLAND
Number of properties                     24                              GERMANY
Carrying amount in MEUR              808.3
Rentable space in sqm             324,316
Occupancy rate                      82.2%
Rental income Q2 2016A (MEUR)1          9.7
Gross return2                  4.8% (5.9%)
                                                                                                         11.3%
                                                                                                     CZECH REPUBLIC
POLAND                            17.1%                                                                                                                     IMMOFINANZ                           100.0%
Number of properties                     10                                                                                                                 Number of properties                         69
Carrying amount in MEUR              362.7                                                                                                                  Carrying amount in MEUR                 2,120.6
Rentable space in sqm             161,774
Occupancy rate                      90.4%                                                            38.1%                                                  Rentable space in sqm
                                                                                                                                                            Occupancy rate
                                                                                                                                                                                                  1,028,949
                                                                                                                                                                                                      82.7%
                                                                                                      AUSTRIA
Rental income Q2 2016A (MEUR)1
Gross return2
                                        5.0
                               5.6% (6.2%)
                                                                                                                             12.8%                          Rental income Q2 2016A (MEUR)1
                                                                                                                                                            Gross return2
                                                                                                                                                                                                       28.4
                                                                                                                                                                                                5.4% (6.5%)
                                                                                                                              HUNGARY
ROMANIA                           15.4%
Number of properties                      9   Data as of 31 October 2016
                                              1 Rental income based on the primary use of the property
                                                                                                                                                       15.4%
Carrying amount in MEUR              326.9      (rental income reported in the income statement is based on the actual                                 ROMANIA
Rentable space in sqm             188,723       use of the property; marginal differences to the income statement are
Occupancy rate                      87.9%       therefore possible)
                                              2 Gross return excl. properties used by IMMOFINANZ: 5.3%
Rental income Q2 2016A (MEUR)1          5.2   3 Non-core countries: Croatia and Bulgaria
Gross return2                  6.3% (7.2%)    Values in brackets = adjusted for occupancy

HUNGARY                           12.8% CZECH REPUBLIC                                          11.3% GERMANY                                     3.9%      NON-CORE COUNTRIES3                     1.4%
Number of properties                     11   Number of properties                      8                     Number of properties                      5   Number of properties                           2
Carrying amount in MEUR              270.7    Carrying amount in MEUR              239.6                      Carrying amount in MEUR               83.7    Carrying amount in MEUR                    28.7
Rentable space in sqm             163,641     Rentable space in sqm             130,702                       Rentable space in sqm              34,174     Rentable space in sqm                    25,619
Occupancy rate                      85.0%     Occupancy rate                      70.1%                       Occupancy rate                      82.1%     Occupancy rate                            51.2%
Rental income Q2 2016A (MEUR)1          3.7   Rental income Q2 2016A (MEUR)1          3.1                     Rental income Q2 2016A (MEUR)1          1.3   Rental income Q2 2016A (MEUR)1               0.4
Gross return2                  5.5% (6.4%)    Gross return2                  5.2% (7.4%)                      Gross return2                  6.2% (7.6%)    Gross return2                      5.6% (10.9%)
                                                                                                                                                                                             Q1-2 2016A – 34
ACTIVE DEVELOPMENTS
GERMANY                                         64.2%
Number of properties                                 10
Carrying amount in MEUR                           290.6
Outstanding construction costs in MEUR            281.1
Planned rentable space in sqm                   131,529
Expect. fair value after completion in MEUR       617.8
Expect. rental inc. at full occupancy in MEUR      29.7
Yield on cost in % at full occupancy               5.2%
ROMANIA                                         9.9%
Number of properties
Carrying amount in MEUR
                                                      2
                                                   44.8               64.2%                                          1.2%
Outstanding construction costs in MEUR             50.0                                                              POLAND
                                                                      GERMANY
Planned rentable space in sqm                    58,995
Expect. fair value after completion in MEUR       105.4
Expect. rental inc. at full occupancy in MEUR      10.1
Yield on cost in % at full occupancy              10.6%
SLOVAKIA        2
                                                 9.4%                                            4.7%
Number of properties                                   2                                    CZECH REPUBLIC                        IMMOFINANZ                                           100%
Carrying amount in MEUR
Outstanding construction costs in MEUR
                                                   42.7
                                                     9.6
                                                                                                                     9.4%         Number of properties                                      20
Planned rentable space in sqm                    35,584                                                              SLOVAKIA     Carrying amount in MEUR                                452.5
                                                                                                                                  Outstanding construction costs in MEUR                 375.3
Expect. fair value after completion in MEUR
Expect. rental inc. at full occupancy in MEUR
                                                   52.3
                                                     5.1
                                                                                              7.5%                                Planned rentable space in sqm                        300,026
                                                                                             AUSTRIA
Yield on cost in % at full occupancy               9.8%                                                              0.8%         Expect. fair value after completion in MEUR
                                                                                                                                  Expect. rental inc. at full occupancy in MEUR
                                                                                                                                                                                         889.0
                                                                                                                                                                                          54.2
AUSTRIA                                         7.5% POLAND                                                1.2%      HUNGARY      Yield on cost in % at full occupancy                    6.6%
Number of properties                                   2   Number of properties                                  1
Carrying amount in MEUR                            34.0    Carrying amount in MEUR                             5.4              9.9%
Outstanding construction costs in MEUR               0.0   Outstanding construction costs in MEUR            26.5               ROMANIA
Planned rentable space in sqm                    21,691    Planned rentable space in sqm                   21,239                                               1 Expansion of an existing
Expect. fair value after completion in MEUR        34.0    Expect. fair value after completion in MEUR       36.4                                                 STOP SHOP
                                                                                                                                                                2 Modernisation of two existing
Expect. rental inc. at full occupancy in MEUR        2.4   Expect. rental inc. at full occupancy in MEUR       2.9                                                office properties
Yield on cost in % at full occupancy               7.0%    Yield on cost in % at full occupancy              9.2%                                               Data as of 31 October 2016
                                                                            1
CZECH REPUBLIC                                  4.7% HUNGARY                                               0.8%                   NON-CORE COUNTRIES                                    2.2%
Number of properties                                   1   Number of properties                                  0                Number of properties                                         2
Carrying amount in MEUR                            21.4    Carrying amount in MEUR                             3.7                Carrying amount in MEUR                                  10.0
Outstanding construction costs in MEUR               8.1   Outstanding construction costs in MEUR              0.0                Outstanding construction costs in MEUR                     0.0
Planned rentable space in sqm                    21,803    Planned rentable space in sqm                    2,081                 Planned rentable space in sqm                           7,104
Expect. fair value after completion in MEUR        29.5    Expect. fair value after completion in MEUR         3.7                Expect. fair value after completion in MEUR              10.0
Expect. rental inc. at full occupancy in MEUR        3.0   Expect. rental inc. at full occupancy in MEUR       0.2                Expect. rental inc. at full occupancy in MEUR              0.8
Yield on cost in % at full occupancy              10.1%    Yield on cost in % at full occupancy              6.3%                 Yield on cost in % at full occupancy                     8.3%
                                                                                                                                                                           Q1-2 2016A – 35
CONTENT
01 IMMOFINANZ at a Glance & Strategy

02 Combination of IMMOFINANZ and CA Immo

03 Portfolio

04 Financing

05 Q1-2 2016A Results

06 Appendix

                                           Q1-2 2016A – 36
FINANCING – RATIONALE OF THE LATEST LIABILITY
MANAGEMENT TRANSACTION
Reduction of financing costs (fully effective from April 2018 on)
> Convertible Bonds 2018 (March 2018), MEUR 287.3 nominal value, 4.25% coupon
> Convertible Bonds 2017 (November 2017), MEUR 21.4 nominal value, 1.25% coupon                                                             MEUR 27.1 interest p.a.
> Corporate Bonds 2017 (July 2017), MEUR 100.0 nominal value, 5.25% coupon

> New Convertible Bond 2024, MEUR 297.2 nominal value, 2.00% 1 coupon                                                                       MEUR 5.9 interest p.a.

Result > Positive effect on FFO by MEUR 21.1 p.a.
Redemption of outstanding bonds in 2017 and 2018 already secured:
 Convertible Bonds 2018
                                         MEUR 287.3
 (reduced volume)
 Convertible Bonds 2017                    MEUR 21.4
 Corporate Bonds 2017                    MEUR 100.0                           > Redemption of outstanding bonds in 2017 and 2018 means cash outflow
                                        MEUR -408.7                               of up to MEUR -408.7 (assumption: CB 2018 not “in the money” at
                                                                                  maturity, no further conversions into shares)
 Convertible Bonds 2024 (net
                                         MEUR 182.4
 cash inflow)2                                                                > Approx. 4.5 mn BUWOG shares free after incentivised conversion of CB
 Disposal of 4.5 mn BUWOG                                                         2018 – Placement already took place
                                           MEUR 97.4
 shares (total net proceeds)3
 Market value of remaining
                                         MEUR 104.3                           > Further 4.7 mn BUWOG shares serve as underlying – either delivered to
 4.7 mn BUWOG shares4                                                             bondholders or free to sell after maturity of CB 2018
                                         MEUR 384.1
1 With 0.50% step down in case of investment grade rating | 2 Issue volume of MEUR 297.2 minus cash payments and fees for the incentivised conversion of the CB 2018
3 Placed through an accelerated bookbuilding on 1 Feb 2017; transaction was settled on 6 Feb 2017 | 4 Closing price of EUR 22.3 on 3 Feb 2017
                                                                                                                                                                       Q1-2 2016A – 37
FINANCING – MATURITY SCHEDULES
TERM STRUCTURE OF FINANCIAL LIABILITIES BY FINANCIAL YEAR AS OF 31 OCTOBER 2016 IN MEUR
  MEUR Historical
        refinancing volumes
  1,600                                                                                                                                            Scheduled instalment
                                                                                                                                                   Scheduled instalment paid
                                                        In January 2017, IMMOFINANZ has partly refinanced its
                                                                                                                                                   Property financing end of maturity
   1,400                                                4.25% convertible bonds due in 2018 by an incentivised
                                                        conversion invitation to the holders. The outstanding volume                               Property financing end of maturity
                                                        was thereby reduced to MEUR 287.3. Concurrently, the                                       already refinanced
                                                        company has placed 2% convertible bonds due in 2024 with a                                 Convertible bonds
   1,200                                                volume of MEUR 297.2* (Put option 2022).                                                   Group financing
                                                                                                                                                   Corporate bond
                                                                                                                                                   Financing secured by cash collateral
   1,000
                                                                                                                                                   Cash and cash equivalents
                                                                                                                                                   (as of 31 October)

     800                                                                                                                           *

     600

     400

     200

               FY            FY            2016                                                                                                                         Starting in
             2014/15       2015/16      (8 months)        2017          2018          2019          2020           2021          2022       2023   2024        2025        2026

Weighted average interest rate excl. derivatives costs 3.54% and excl. derivatives costs and excl. Russia 2.55%;
weighted average term to maturity: 3.5 years; net LTV: 51.6%1
1 Net LTV = Total debt less cash and cash equivalents in relation to property value plus market value of BUWOG and EPRA NAV of CAI shares
                                                                                                                                                                         Q1-2 2016A – 38
FINANCING – STRUCTURE
                                                 OUTSTANDING          WEIGHTED
                                                     LIABILITY1 AVERAGE INTEREST                     SHARE OF             SHARE OF                    FIXED               FLOATING
                                                       IN TEUR        RATE EXCL.                        FIXED             FLOATING                 INTEREST                INTEREST
                                             AS OF 31 OCT 2016      DERIVATIVES2                INTEREST IN %2       INTEREST IN %2                   RATE2                   RATE2

Convertible bonds in EUR                                 525,259.4                      4.23%          100.00%                 0.00%                     4.23%                     n/a
Corporate bond in EUR                                    101,530.1                      5.25%          100.00%                 0.00%                     5.25%                     n/a
Bank liabilities in EUR                                2,330,838.3                      2.05%             4.60%               95.40%                     0.86%                2.11%
Bank liabilities in USD                                  700,393.1                      7.74%             0.00%              100.00%                       n/a                7.74%
IMMOFINANZ                                            3,658,020.8                       3.54%           20.11%               79.89%                      3.88%                3.46%

FINANCIAL LIABILITIES
                                                                                                                                                             6.93%
                                                                                                                                                             Deutsche Bank
                                                                                                                                                                      3.82%
                                                                                                                                             9.86%                    Aareal
                                                                                                                  18.64%                     Sparkasse                Bank 2.23%
                                                                                                                  SBERBANK                   KölnBonn                 Group HELABA

 80.85%                                                                    19.15%                  18.86%                       13.95%               8.22%                3.51%
 Financial liabilities in EUR                            Financial liabilities in USD              UniCredit                    Raiffeisen           Erste                Nordea
                                                                                                   Group                        Group                Group
                                                                                                                                                                  5.64%       8.35%
                                                                                                                                                                  pbb           Other
                                                                                                                                                                  Deutsche
                                                                                                                                                                  Pfandbriefbank

1 Including liabilities in discontinued operations and disposal groups
2 Calculation basis: actual remaining debt (nominal amount)
                                                                                                                                                                        Q1-2 2016A – 39
In January 2017, IMMOFINANZ has partly refinanced its
                                                                                4.25% convertible bonds due in 2018 by an incentivised
                                                                                conversion invitation to the holders. The outstanding volume

BONDS                                                                           was thereby reduced to MEUR 287.3. Concurrently, the
                                                                                company has placed 2% convertible bonds due in 2024 with a
                                                                                volume of MEUR 297.2.

DATA AS OF                                  CONVERTIBLE BOND 2017                  CONVERTIBLE BOND 2018                  CORPORATE BOND 2017                      CONVERTIBLE BOND 2024
16 JANUARY 2017                             ISIN XS0332046043                      ISIN XS0592528870                      ISIN AT0000A0VDP8                        ISIN XS1551932046
Nominal value                               MEUR 21.4                              MEUR 287.3                             MEUR 100.0                               MEUR 297.2
Denomination                                EUR 100,000                            EUR 4.12                               EUR 1,000                                EUR 100,000
Repayment amount                            EUR 129,670                            EUR 4.12                               EUR 1,000                                EUR 100,000
Security / ranking                          Unsecured, unsubordinated              Unsecured, unsubordinated              Unsecured, unsubordinated                Unsecured, unsubordinated
Term                                        19 Nov. 2007 – 19 Nov. 2017            8 March 2011 – 8 March 2018            3 July 2012 – 3 July 2017                24 Jan. 2017 – 24 Jan. 2024
Coupon                                      1.25%                                  4.25%                                  5.25%                                    2.00%2
Dividend protection                         Adjustments to conversion price        Adjustments to conversion price        n/a                                      Adjustments to conversion price
Put option                                                                                                                                                         24 Jan. 2022
Conversion price                                                                                                                                                   2.39
Quotation1                                  112.00%                                EUR 4.33                               101.93%                                  n/a

Adjusted conversion terms…                  1.25% convertible bond 2017            4.25% convertible bond 2018

… currently applicable calculation         One 2017 convertible bond One 2018 convertible bond certificate (nominal value of EUR 4.12) entitles conversion into 1.1908
method due to BUWOG spin-off:              certificate (nominal value of EUR IMMOFINANZ      shares    and     0.0649    BUWOG       shares.     A      share     price  of
(including BUWOG & IMMOFINANZ              100,000) entitles conversion into EUR 2.00 (IMMOFINANZ) and EUR 22.00 (BUWOG) corresponds to a share price value of EUR 3.81.
dividend 2016)                             12,909.75 IMMOFINANZ shares
                                           and 718.10 BUWOG shares.

5.0                                                                              CALCULATION FOR CB 2018 CONVERSION PRICE ADJUSTMENT
                “In-the-money” line CB 2018                                      REGARDING IMMOFINANZ DIVIDEND                                                                               IN EURO
4.5
                                                                                 Number of underlying shares old (per CB)                                                                      1.1573
4.0                                                                              Conversion price new = CP * (M - V) / M                                                                          3.46
                                                                                 3.56 * (2.1256 – 0.06) / 2.1256
3.5                                                                              Number of underlying shares new (per CB)                                                                      1.1908
                                                                                 (Number of underlying shares old / (conversion price new / conversion price old) 1.1573 / (3.46 / 3.56)
3.0
                       Market value of underlying shares
2.5                                                                              Input Factor “CP“                           Conversion price old                                                3.56
    Jan        July         Jan         July         Jan       July     Nov      Input Factor “M“                            Average market price                                              2.1256
   2014        2014        2015        2015         2016       2016     2016     Input Factor “V“                            Cash dividend                                                       0.06
1 Stock Exchange Frankfurt as of 16 January 2017 | 2 With 0.50% step down in case of investment grade rating
                                                                                                                                                                                           Q1-2 2016A – 40
CONTENT
01 IMMOFINANZ at a Glance & Strategy

02 Combination of IMMOFINANZ and CA Immo

03 Portfolio

04 Financing

05 Q1-2 2016A Results

06 Appendix

                                           Q1-2 2016A – 41
P&L Q1-2 2016A VS. Q1-2 2015/16
AMOUNTS IN MEUR                                          Q1-2        Q1-2     CHANGE      CHANGE     COMMENT
AS OF 31 OCTOBER 2016                                   2016A     2015/16    ABSOLUTE        IN %
                                                                                                     1.   Decline of MEUR -7.2 in RU; completions
Rental income                                       1    153.3       160.3         -7.0      -4.4%
                                                                                                          and new rentals successfully offset the
Operating costs charged to tenants                        48.6        46.5          2.1       4.6%        decline in rental income from the sale of
Other revenues                                              4.2        4.4         -0.2      -4.2%        properties
Revenues                                                 206.1       211.2         -5.1      -2.4%   2.   Higher maintenance due to
Expenses from investment property                   2     -52.0      -64.2        12.2       19.0%        refurbishments (by MEUR 7.7) more than
Operating expenses                                        -46.8      -44.9         -1.9      -4.2%        offset by lower vacancy costs
Results of asset management                              107.3       102.1          5.2      5.1%         (by MEUR 2.0), a decline in operating
                                                                                                          costs charged to building owners
Results of property sales                                  -2.5        6.1         -8.6        n/a
                                                                                                          (by MEUR 4.9) due to lower property-
Results of property development                             0.7       -5.6          6.3        n/a
                                                                                                          based tax, and reduced receivables
Other operating income                                      8.2       19.2        -11.0     -57.4%
                                                                                                          write-offs (by MEUR 10.2)
Other operating expenses                            3     -26.1      -53.5        27.4       51.2%   3.   Negative one-off effect in prior year
Results of operations                                      87.6       68.3         19.3     28.2%         period from termination of investor
Revaluation of investment properties adjusted for   4    -104.1       24.0       -128.1        n/a        lawsuits (MEUR -28.1)
foreign exchange effects
                                                                                                     4.   Foreign exchange-adjusted revaluation
Revaluation of investment properties resulting      5     -32.1      335.4       -367.5        n/a
from foreign exchange effects                                                                             loss in RU (MEUR -95.1), positive effects
                                                                                                          primarily in CZ (MEUR +9.5)
Goodwill impairment and other revaluation results         -12.2        3.1        -15.2        n/a
                                                                                                     5.   Decline due to more stable ruble rate than
Operating profit (EBIT)                                   -60.7      430.8       -491.5        n/a
                                                                                                          in prior year period
Net financing costs                                       -75.1      -80.1          5.0       6.2%
                                                                                                     6.   Offsetting item to currency-driven
Foreign exchange differences                        6     35.4      -180.5       215.9         n/a        revaluation loss in RU
Other financial results                                   -11.0      -22.3        11.3       50.5%   7.   Proportional share of profit of BUWOG
Gains/losses from equity-accounted investments      7     -33.1       79.8       -112.9        n/a        (MEUR 29.5) und CA Immo (MEUR 7.5),
Taxes                                                     -20.3      -92.9         72.6      78.1%        sale of BUWOG shares (MEUR 34.2),
Net profit for the period from continuing                -164.8      134.9       -299.7        n/a        and market-based valuation in accordance
operations                                                                                                with IFRS of the CA IMMO shares
Net profit for the period from discontinued               10.4        -1.7        12.1         n/a        (MEUR -105.7)
operations
Net profit for the period                                -154.4      133.2       -287.6        n/a

                                                                                                                                     Q1-2 2016A – 42
LIKE-FOR-LIKE – RENTAL INCOME
On a like-for-like basis (i.e. comparable to the prior quarter, adjustments made for acquisitions, completions and sales), rental income in Q2 2016A
was stable overall and amounted to MEUR 68.3. In comparison to the prior quarter, rental income from Russia declined by MEUR 0.5 to MEUR
17.8, while there were slight increases in Germany, Hungary and the Czech Republic.

STANDING INVESTMENTS1,                                        CARRYING            CARRYING                RENTAL               RENTAL             Q2 2016A               GROSS               GROSS
AMOUNTS IN MEUR                        NUMBER OF               AMOUNT               AMOUNT               INCOME               INCOME                    VS.             RETURN              RETURN
AS OF 31 OCTOBER 2016                  PROPERTIES           31 OCT 2016         31 JULY 2016            Q2 2016A             Q1 2016A             Q1 2016A             Q2 2016A            Q1 2016A
Austria                                          123                902.3                916.0                 12.3                12.6                  -0.3        5.4% (6.3%)         5.5% (6.3%)
Germany                                            5                 83.7                 83.2                  1.3                 0.9                   0.4        6.2% (7.6%)         4.5% (5.7%)
Czech Republic                                     20               371.7                361.8                  5.6                  5.4                  0.2        6.0% (7.3%)         6.0% (7.3%)
Hungary                                            23               433.8                432.7                  6.6                  6.4                  0.3        6.1% (6.9%)         5.9% (6.8%)
Poland                                             18               583.0                587.8                  8.6                  8.5                  0.1        5.9% (6.4%)         5.8% (6.4%)
Romania                                            19               609.2                640.0                 11.2                11.3                  -0.1        7.3% (8.0%)         7.0% (7.8%)
Russia                                              5             1,072.8             1,114.6                  17.8                18.3                  -0.5        6.6% (8.1%)         6.6% (8.1%)
Slovakia                                           12               176.0                166.3                  3.3                  3.3                  0.0        7.4% (7.5%)         7.9% (8.0%)
Non-core countries                                 10                97.7                 93.9                  1.8                  1.8                  0.0        7.2% (8.8%)         7.5% (9.6%)
IMMOFINANZ                                235                     4,330.2             4,396.4                  68.3                68.5                  -0.1       6.3% (7.2%)         6.2% (7.2%)
Rental income Q1-2 2016A from properties sold/                                                                  8.1                                         Values in brackets = adjusted for occupancy
acquired and developments
IMMOFINANZ                                                                                                     76.5

Office                                             64             2,001.6             2,019.3                  26.9                27.1                  -0.2        5.4% (6.5%)         5.4% (6.6%)
Retail                                           162              2,317.0             2,358.2                  41.3                41.3                   0.1        7.1% (7.7%)         7.0% (7.7%)
Others                                              9                11.6                 18.9                  0.1                  0.1                  0.0        3.2% (4.1%)         1.3% (2.2%)
IMMOFINANZ                                       235              4,330.2             4,396.4                  68.3                68.5                  -0.1       6.3% (7.2%)         6.2% (7.2%)
                                                                                                                                                            Values in brackets = adjusted for occupancy

1 This calculation only includes the properties owned by IMMOFINANZ during both financial quarters, i.e. an adjustment was made for new acquisitions, completions and sales
Rounding differences may result from the use of automatic data processing equipment for the addition of rounded amounts and percentage rates
                                                                                                                                                                                       Q1-2 2016A – 43
LIKE-FOR-LIKE – PROPERTY VALUATION
The currency-adjusted valuation result amounted to MEUR -102.7 in Q1-2 2016A (Q1-2 2015/16: MEUR 29.6), of which MEUR -95.0 (prior year
period: MEUR 2.4) was attributable to the Russian portfolio. This was primarily driven by the difficult market environment and numerous
completions and openings of new shopping centers in Moscow, as well as the resulting extensions of the rent reductions granted and fixed FX rates
for tenants. There were positive valuation effects in particular in the Czech Republic amounting to MEUR 9.5, mainly due to the improved market
environment.

STANDING INVESTMENTS1,
AMOUNTS IN MEUR                                      NUMBER OF         CARRYING AMOUNT            VALUATION RESULT
AS OF 31 OCTOBER 2016                                PROPERTIES          31 OCTOBER 2016                Q1-2 2016A COMMENT
Austria                                                        123                      902.3                      -13.7 Portfolio optimisation in line with strategic reorientation
Germany                                                          5                       83.7                       -0.6
Czech Republic                                                  20                      371.7                         9.5 Positive market environment
Hungary                                                         23                      433.8                         1.2
Poland                                                          18                      583.0                        -5.8
Romania                                                         19                      609.2                        -3.7
Russia                                                            5                   1,072.8                      -95.0 Difficult market environment, extensions of rent reductions
Slovakia                                                        12                      176.0                         2.8
Non-core countries                                              10                       97.7                         2.6
IMMOFINANZ                                                     235                    4,330.2                     -102.7

Office                                                          64                    2,001.6                        0.4
Retail                                                         162                    2,317.0                     -103.0 Difficult market environment and extensions of rent reductions in
                                                                                                                         RU, portfolio optimisation in Austria
Others                                                            9                      11.6                       -0.1
IMMOFINANZ                                                     235                    4,330.2                     -102.7

1 This calculation only includes the properties owned by IMMOFINANZ during both financial quarters, i.e. an adjustment was made for new acquisitions, completions and sales
Rounding differences may result from the use of automatic data processing equipment for the addition of rounded amounts and percentage rates
                                                                                                                                                                                   Q1-2 2016A – 44
FUNDS FROM OPERATIONS I & II
AMOUNTS IN MEUR                                    Q1-2       Q1-2     CHANGE     CHANGE
AS OF 31 OCTOBER 2016                             2016A    2015/16    ABSOLUTE       IN %

Gross cash flow before tax                          84.1       68.1        15.9      23.3%
Gross cash flow before tax from discontinued        -1.2      -19.7       -18.5     -94.1%
operations (in the gross cash flow included)
Expenses from property sales                         2.2       2.9         -0.7     -22.8%
(in the gross cash flow included as an expense)
Expense for the settlement of investor claims        0.0      28.1        -28.1     >100%
Dividends received from equity-accounted             7.0      27.6        -20.6     -74.7%
investments
Interest or dividends received from financial        2.3       1.5         0.7      48.5%
instruments
Interest paid                                      -65.2      -72.2        6.9       9.6%
Derivatives payments                               -12.2      -20.9        8.7      41.6%
FFO 1                                              16.9       15.6         1.4       8.8%
Results of property sales                           -2.5       6.1         -8.6        n/a
FFO 2                                              14.5       21.7         -7.3     -33.4%

                                                                                             Q1-2 2016A – 45
BUSINESS UPDATE:
RUSSIA AS OF 31 OCTOBER 2016 (1)
OCCUPANCY RATE
                                                                                                        ~90.0%
                  86.2%                                                                     7.6Pp
                                                                                   82.4%
                                     81.9%                81.0%     1.4Pp
                          -4.3Pp

                                                -0.9Pp

             FY 2014/15            FY 2015/16            Q1 2016A                Q2 2016A              FY 2016A
                                                                                                       expected

LARGEST RENTALS
in sqm

                      RANKING             BUILDING                      TENANT                      SQM
                      1                      Rostokino                      Hamleys                 4,800
                      2                      Rostokino              Podium Market                   3,200
                      3                      Rostokino                      Zamania                 2,300
                      4                   GOODZONE                           Familia                1,800
                      5                   GOODZONE                     Detskiy Mir                  1,400

                                                                                                                  Q1-2 2016A – 46
BUSINESS UPDATE:
RUSSIA AS OF 31 OCTOBER 2016 (2)
 TERM STRUCTURE OF FINANCIAL LIABILITIES
 Values in MEUR
                                             350
                                             300        Property financing end of maturity
                                             250        Property financing; scheduled repayments from rental income1
                                             200
                                             150
                                             100
                                              50
                                               0
                                                         2017              2018                 2019          2020             2021             2022
         1 A reduction or suspension of principal repayments up to March 2017 was arranged for individual financial liabilities, a further suspension until March 2018 is in negotiation

 PROPERTY APPRAISAL
 Standing Investments                                                                                                   EXTRAORDINARY
                                                                                                                             APPRAISAL
                                         30 APRIL 20131               30 APRIL 2014                30 APRIL 2015       31 JANUARY 2016                 30 APRIL 2016          31 OCTOBER 2016
 Appraiser                                               JLL                         JLL                        JLL                     CBRE                        CBRE                     CBRE
 Prime yield2                                      9.0-9.5%                    9.3-9.5%                      10.8%                     10.0%                       10.0%                    10.0%
 Discount rate                               11.75-12.00%                11.50-12.50%                  12.50-13.75%            12.50-13.75%               12.50-13.75%               12.50-13.75%
 Exit yield                                  10.75-11.00%                10.50-11.50%                  11.50-12.25%            11.00-12.25%               11.00-12.25%               11.00-12.25%
 Occupancy rate                                       99.1%                       93.3%                      86.2%                     84.5%                       81.9%                    82.4%
 Fair value (MEUR)                                  1,575.4                     1,710.2                     1,536.5                   1,234.7                    1,114.6                   1,072.8
 LTV                                                  42.2%                       37.7%                      48.0%                     59.2%                       60.1%                    65.3%
 Gross yield                                          11.0%                        9.7%                       8.9%                       6.4%                       6.8%                     6.6%
 Gross return (occupancy-adj.)                        11.1%                       10.4%                      10.3%                       7.6%                       8.3%                     8.1%
 1 Excl. GOODZONE
 2 Source: JLL (30 April 2013 to 30 April 2015) respectively Colliers (up to 31 January 2016)
                                                                                                                                                                                           Q1-2 2016A – 47
BUSINESS UPDATE:
RUSSIA AS OF 31 OCTOBER 2016 (3)
  RENTAL INCOME (LIKE-FOR-LIKE)                            FOOTFALL
  Values in MEUR                                           Values in million
            18.3                  17.8                                   18.7
                    -2.7%                                                           -6.9%         17.4

         Q1 2016A             Q2 2016A                              Q1-2 2015/16               Q1-2 2016A

  CONTRACT EXPIRATION PROFILE RUSSIA                       RENT RECEIVABLES RUSSIA
                                                           Values in MEUR

14%                                up to 31 October 2017

1%                                 up to 31 October 2018                 10.4

3%                                 up to 31 October 2019
                                                                                                   8.5
                                                                                    -18.3%
16%                                up to 31 October 2020

66%                               as of 1 November 2020

0%                                             unlimited
                                                                     31 July 2016            31 October 2016

                                                                                                            Q1-2 2016A – 48
CONTENT
01 IMMOFINANZ at a Glance & Strategy

02 Combination of IMMOFINANZ and CA Immo

03 Portfolio

04 Financing

05 Q1-2 2016A Results

06 Appendix

                                           Q1-2 2016A – 49
KEY FIGURES

ASSET DATA                                                                 31 OCT 2016    STOCK EXCHANGE DATA                                          31 OCT 2016
Balance sheet total                                             in MEUR         7,200.6   Book value per share                                in EUR            2.78
Equity as % of the balance sheet total                             in %          37.2%    Share price at end of period                        in EUR            1.96
Net financial liabilities                                       in MEUR         3,298.5   Discount of share price to diluted NAV per share      in %          37.6%
Cash and cash equivalents                                       in MEUR           359.5   Number of shares                                               975,955,651
Loan to value ratio (net)                                          in %          51.6%     Thereof number of treasury shares                               9,999,973
Gearing                                                            in %         117.4%    Market capitalisation at end of period             in MEUR         1,915.8
Average interest rate on financial liabilities, incl. hedging      in %           3.8%    Earnings per share                                  in EUR           -0.16
Average term of financial liabilities                           in years            3.5   Earnings per share (diluted)                        in EUR           -0.16

EPRA INDICATORS                                                            31 OCT 2016    EARNINGS DATA                                                Q1-2 2016A
EPRA Net Asset Value                                            in MEUR         3,036.7   Rental income                                      in MEUR           153.3
EPRA Net Asset Value per share                                   in EUR            3.14   Results of asset management                        in MEUR           107.3

EPRA Triple Net Asset Value                                     in MEUR         2,972.1   Results of property sales                          in MEUR            -2.5
                                                                                          Results of property development                    in MEUR             0.7
EPRA Triple Net Asset Value per share                            in EUR            3.08
                                                                                          Results of operations                              in MEUR            87.6
                                                                                          Revaluations                                       in MEUR          -132.4
EPRA earnings                                                    in EUR           -46.7
                                                                                          EBIT                                               in MEUR           -60.7
EPRA earnings per share                                          in EUR           -0.05
                                                                                          Financial results                                  in MEUR           -83.8
EPRA earnings after                                             in MEUR             3.8
company-specific adjustments                                                              EBT                                                in MEUR          -144.5
EPRA earnings per share after                                    in EUR            0.00   Net profit or loss                                 in MEUR          -154.4
company-specific adjustments                                                              FFO 1 (excl. results of property sales)            in MEUR            16.9
EPRA Net Initial Yield                                             in %           5.4%    FFO 2 (incl. results of property sales)            in MEUR            14.5

                                                                                                                                                        Q1-2 2016A – 50
TOTAL ECONOMY AND MARKETS
                                                       OFFICE (Q1 2016A)                                                                 RETAIL2 (Q1 2016A)
                                                                                                                                          PRIME RENTS
                                                                                  AVERAGE                                                      ANCHOR    PRIME RENTS
MARKET DATA                    VACANCY RATE               PRIME RENTS                RENTS                 YIELD   VACANCY RATE                TENANTS OTHER TENANTS                    YIELD
CORE MARKET/CITY1                       IN %               IN EUR/SQM          IN EUR/SQM                   IN %            IN %           IN EUR/SQM     IN EUR/SQM                     IN %
GER/Düsseldorf                              8.3%                   26.0                   15.0             4.5%                 n/a                   n/a                n/a              n/a
GER/Cologne                                 5.9%                   18.2                   11.3             5.0%                 n/a                   n/a                n/a              n/a
AT/Vienna                                   6.4%                   25.5                   14.0             4.5%                 n/a                   n/a              130.0             4.8%
PL/Warsaw                                 14.1%                    22.0                   14.3             6.0%                3.1%                   15.5             110.0             5.0%
RO/Bucharest                              14.0%                    17.0                   14.5             7.5%               10.0%                   20.0              65.0             7.5%
RU/Moscow                                    n/a                    n/a                    n/a               n/a               8.0%          USD 100.00           USD 248.00            10.0%
SK/Bratislava                               8.1%                   15.5                   11.0             7.0%                 n/a                   15.0             37-40             5.8%
CZ/Prague                                 13.9%                    19.5                   13.2             5.3%                 n/a                   n/a              110.0             5.5%
HU/Budapest                               11.3%                    18.0                   12.8             7.1%                4.0%                   35.0              75.0             7.3%
Source: 1 Colliers, EHL (for the office market in Vienna); 2 Colliers; EHL (for Vienna shopping centers)

                                  UNEMPLOYMENT                      ANNUAL           GROSS NATIONAL               DEFICITS/                             FORECASTED GDP         FORECASTED GDP
                                             RATE            INFLATION RATE                 DEBT 2015        SURPLUS 2015             GDP GROWTH          GROWTH RATE            GROWTH RATE
ECONOMIC DATA                       IN APRIL 20161             IN APRIL 20161           (IN % OF GDP)        (IN % OF GDP)              RATE 20152                2016                   2017
Germany                                            4.2%                   -0.3%                    71.2%               0.7%                    1.7%                  1.6%                1.6%
Austria                                            5.8%                    0.6%                    86.2%              -1.2%                    0.9%                  1.5%                1.6%
Poland                                             6.3%                   -0.5%                    51.3%              -2.6%                    3.6%                  3.7%                3.6%
Romania                                            6.4%                   -2.6%                    38.4%              -0.7%                    3.8%                  4.2%                3.7%
Russia3                                            5.6%                   15.6%                    13.5%              -2.4%                   -3.7%                  -1.9%               1.1%
Slovakia                                        10.2%                     -0.4%                    52.9%              -3.0%                    3.6%                  3.2%                3.3%
Czech Republic                                     4.1%                    0.5%                    41.1%              -0.4%                    4.2%                  2.1%                2.6%
Hungary                                            5.6%                    0.3%                    75.3%              -2.0%                    2.9%                  2.5%                2.8%
EU 28                                              8.7%                   -0.2%                    85.2%              -2.4%                    2.0%                  1.8%                1.9%
Euro zone (19 countries)                        10.2%                     -0.2%                    90.7%              -2.1%                    1.7%                  1.6%                1.8%

Source: 1 Eurostat; 2 European Commission spring forecast; per cent change versus previous year (2015 - 2017); 3 World Bank, Russia Economic Report, April 2016
                                                                                                                                                                                   Q1-2 2016A – 51
STRUCTURE
PRIVATE AND INSTITUTIONAL INVESTORS BY COUNTRY

PRIVATE AND INSTITUTIONAL INVESTORS

 32.2%                                 3.5%                                   62.8%
 Private Austria                Not identified                                Institutional investors

                                      1.0%       0.5%
                             Treasury shares     Private other

INSTITUTIONAL INVESTORS BY COUNTRY
                                                                                                                         5.1%
                                                                                                                          Other
 25.8%                                                           4.4%           3.3%          2.7%            1.3%         incl.
 Austria                                                         CY             UK            NL              FR        trading

                                                        10.7%           3.6%           3.0%             2.2% 0.7%
                                                        USA             NOR            PL               GER        CH

Source: IPREO, August 2016
                                                                                                                    Q1-2 2016A – 52
CONTACT DETAILS AND FINANCIAL CALENDAR

INVESTOR RELATIONS
+43 (0)1 88 090
E-Mail: investor@immofinanz.com
www.immofinanz.com

FINANCIAL CALENDAR                                                                   TICKER SYMBOLS
FY 2016A results                                   06 April 2017                     Vienna Stock Exchange                           IIA
FY 2016A press conference                          07 April 2017                     Warsaw Stock Exchange                           IIA
FY 2016A report                                    07 April 2017                     ISIN                               AT0000809058
Q1 2017 report                                     30 May 2017                       Reuters                                    IMFI.VI
24th   annual general meeting                      01 June 2017                      Bloomberg                                   IIA AV

ADR PROGRAMME
Ticker symbol: IMNZY        CUSIP: 45253U201        ISIN: US45253U2015                              ADR-Ratio: 1 ADR: 4 Ordinary Shares
Depositary bank: Deutsche Bank Trust Company Americas

ADR broker helpline:                                    E-Mail: adr@db.com
New York: +1 212 250 9100                               ADR Website: www.adr.db.com
London: +44 207 547 6500                                Depositary bank’s local custodian: Deutsche Bank, Frankfurt

1 Publication is scheduled after the close of trading on the Vienna Stock Exchange
                                                                                                                                           Q1-2 2016A – 53
You can also read